Python generates PDF reports with pictures and text

reportlab is a standard library of Python that can draw pictures, tables, edit text, and finally output PDF format. Its logic is very similar to editing a word document or PPT. There are two methods:
1) Create a blank document, and then write text, draw pictures, etc. on it;
2) Create a blank list to fill in the table Insert various text boxes, pictures, etc. into the form, and finally generate a PDF document.
Because we need to generate a report for users, which needs to insert pictures, tables, etc., we use the second method.
Install third-party libraries
reportlab imports the third-party library of Python. You need to install it before using it: pip install reportlab
Module import
Import related content in advance and register fonts. (Font files need to be prepared before registering fonts)
from reportlab.pdfbase import pdfmetrics # 注册字体
from reportlab.pdfbase.ttfonts import TTFont # 字体类
from reportlab.platypus import Table, SimpleDocTemplate, Paragraph, Image# 报告内容相关类
from reportlab.lib.pagesizes import letter# 页面的标志尺寸(8.5*inch, 11*inch)
from reportlab.lib.styles import getSampleStyleSheet# 文本样式
from reportlab.lib import colors# 颜色模块
from reportlab.graphics.charts.barcharts import VerticalBarChart# 图表类
from reportlab.graphics.charts.legends import Legend# 图例类
from reportlab.graphics.shapes import Drawing# 绘图工具
from reportlab.lib.units import cm# 单位:cm
# 注册字体(提前准备好字体文件, 如果同一个文件需要多种字体可以注册多个)
pdfmetrics.registerFont(TTFont('SimSun', 'SimSun.ttf'))Encapsulate functions corresponding to different contents
Create a Graphs class to provide different report contents through different static methods, including : Headings, general paragraphs, pictures, tables and charts. Most of the relevant data in the function are currently fixed values and can be set to relevant parameters according to the situation.
class Graphs:
 # 绘制标题
 @staticmethod
 def draw_title(title: str):
 # 获取所有样式表
 style = getSampleStyleSheet()
 # 拿到标题样式
 ct = style['Heading1']
 # 单独设置样式相关属性
 ct.fontName = 'SimSun'# 字体名
 ct.fontSize = 18# 字体大小
 ct.leading = 50 # 行间距
 ct.textColor = colors.green # 字体颜色
 ct.alignment = 1# 居中
 ct.bold = True
 # 创建标题对应的段落,并且返回
 return Paragraph(title, ct)

 # 绘制小标题
 @staticmethod
 def draw_little_title(title: str):
 # 获取所有样式表
 style = getSampleStyleSheet()
 # 拿到标题样式
 ct = style['Normal']
 # 单独设置样式相关属性
 ct.fontName = 'SimSun'# 字体名
 ct.fontSize = 15# 字体大小
 ct.leading = 30# 行间距
 ct.textColor = colors.red# 字体颜色
 # 创建标题对应的段落,并且返回
 return Paragraph(title, ct)
 # 绘制普通段落内容
 @staticmethod
 def draw_text(text: str):
 # 获取所有样式表
 style = getSampleStyleSheet()
 # 获取普通样式
 ct = style['Normal']
 ct.fontName = 'SimSun'
 ct.fontSize = 12
 ct.wordWrap = 'CJK' # 设置自动换行
 ct.alignment = 0# 左对齐
 ct.firstLineIndent = 32 # 第一行开头空格
 ct.leading = 25
 return Paragraph(text, ct)
 # 绘制表格
 @staticmethod
 def draw_table(*args):
 # 列宽度
 col_width = 120
 style = [
 ('FONTNAME', (0, 0), (-1, -1), 'SimSun'),# 字体
 ('FONTSIZE', (0, 0), (-1, 0), 12),# 第一行的字体大小
 ('FONTSIZE', (0, 1), (-1, -1), 10),# 第二行到最后一行的字体大小
 ('BACKGROUND', (0, 0), (-1, 0), '#d5dae6'),# 设置第一行背景颜色
 ('ALIGN', (0, 0), (-1, -1), 'CENTER'),# 第一行水平居中
 ('ALIGN', (0, 1), (-1, -1), 'LEFT'),# 第二行到最后一行左右左对齐
 ('VALIGN', (0, 0), (-1, -1), 'MIDDLE'),# 所有表格上下居中对齐
 ('TEXTCOLOR', (0, 0), (-1, -1), colors.darkslategray),# 设置表格内文字颜色
 ('GRID', (0, 0), (-1, -1), 0.5, colors.grey),# 设置表格框线为grey色,线宽为0.5
 # ('SPAN', (0, 1), (0, 2)),# 合并第一列二三行
 # ('SPAN', (0, 3), (0, 4)),# 合并第一列三四行
 # ('SPAN', (0, 5), (0, 6)),# 合并第一列五六行
 # ('SPAN', (0, 7), (0, 8)),# 合并第一列五六行
 ]
 table = Table(args, colWidths=col_width, style=style)
 return table
 # 创建图表
 @staticmethod
 def draw_bar(bar_data: list, ax: list, items: list):
 drawing = Drawing(500, 250)
 bc = VerticalBarChart()
 bc.x = 45 # 整个图表的x坐标
 bc.y = 45# 整个图表的y坐标
 bc.height = 200 # 图表的高度
 bc.width = 350# 图表的宽度
 bc.data = bar_data
 bc.strokeColor = colors.black # 顶部和右边轴线的颜色
 bc.valueAxis.valueMin = 5000 # 设置y坐标的最小值
 bc.valueAxis.valueMax = 26000 # 设置y坐标的最大值
 bc.valueAxis.valueStep = 2000 # 设置y坐标的步长
 bc.categoryAxis.labels.dx = 2
 bc.categoryAxis.labels.dy = -8
 bc.categoryAxis.labels.angle = 20
 bc.categoryAxis.categoryNames = ax
 # 图示
 leg = Legend()
 leg.fontName = 'SimSun'
 leg.alignment = 'right'
 leg.boxAnchor = 'ne'
 leg.x = 475 # 图例的x坐标
 leg.y = 240
 leg.dxTextSpace = 10
 leg.columnMaximum = 3
 leg.colorNamePairs = items
 drawing.add(leg)
 drawing.add(bc)
 return drawing
 # 绘制图片
 @staticmethod
 def draw_img(path):
 img = Image(path) # 读取指定路径下的图片
 img.drawWidth = 5*cm# 设置图片的宽度
 img.drawHeight = 8*cm # 设置图片的高度
return imgGenerate report
if __name__ == '__main__':
 # 创建内容对应的空列表
 content = list()
 # 添加标题
 content.append(Graphs.draw_title('数据分析就业薪资'))
 # 添加图片
 content.append(Graphs.draw_img('抗疫必胜.png'))
 # 添加段落文字
 content.append(Graphs.draw_text('众所周知,大数据分析师岗位是香饽饽,近几年数据分析热席卷了整个互联网行业,与数据分析的相关的岗位招聘、培训数不胜数。很多人前赴后继,想要参与到这波红利当中。那么数据分析师就业前景到底怎么样呢?'))
 # 添加小标题
 content.append(Graphs.draw_title(''))
 content.append(Graphs.draw_little_title('不同级别的平均薪资'))
 # 添加表格
 data = [
 ('职位名称', '平均薪资', '较上年增长率'),
 ('数据分析师', '18.5K', '25%'),
 ('高级数据分析师', '25.5K', '14%'),
 ('资深数据分析师', '29.3K', '10%')
 ]
 content.append(Graphs.draw_table(*data))
 # 生成图表
 content.append(Graphs.draw_title(''))
 content.append(Graphs.draw_little_title('热门城市的就业情况'))
 b_data = [(25400, 12900, 20100, 20300, 20300, 17400), (15800, 9700, 12982, 9283, 13900, 7623)]
 ax_data = ['BeiJing', 'ChengDu', 'ShenZhen', 'ShangHai', 'HangZhou', 'NanJing']
 leg_items = [(colors.red, '平均薪资'), (colors.green, '招聘量')]
 content.append(Graphs.draw_bar(b_data, ax_data, leg_items))
 # 生成pdf文件
 doc = SimpleDocTemplate('report.pdf', pagesize=letter)
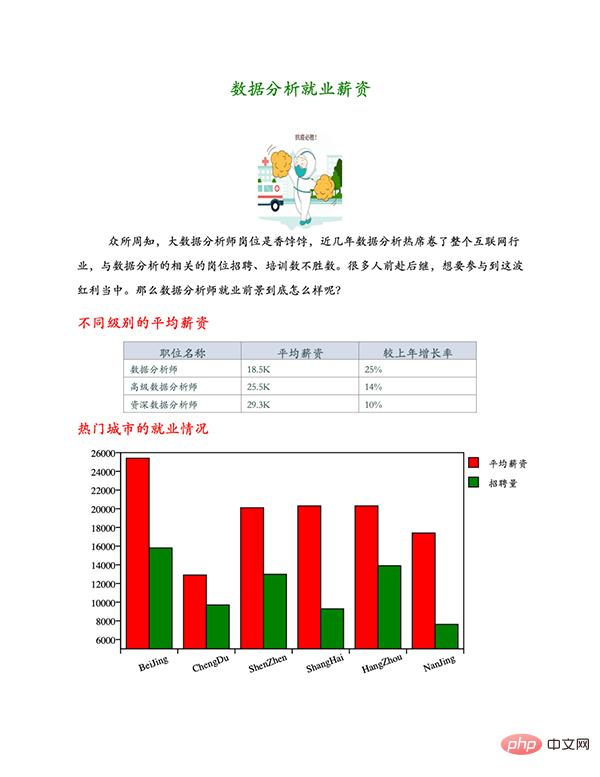
doc.build(content)The results of generating the report are as follows:

The above is the detailed content of Python generates PDF reports with pictures and text. For more information, please follow other related articles on the PHP Chinese website!

Hot AI Tools

Undresser.AI Undress
AI-powered app for creating realistic nude photos

AI Clothes Remover
Online AI tool for removing clothes from photos.

Undress AI Tool
Undress images for free

Clothoff.io
AI clothes remover

AI Hentai Generator
Generate AI Hentai for free.

Hot Article

Hot Tools

Notepad++7.3.1
Easy-to-use and free code editor

SublimeText3 Chinese version
Chinese version, very easy to use

Zend Studio 13.0.1
Powerful PHP integrated development environment

Dreamweaver CS6
Visual web development tools

SublimeText3 Mac version
God-level code editing software (SublimeText3)

Hot Topics
 Is the conversion speed fast when converting XML to PDF on mobile phone?
Apr 02, 2025 pm 10:09 PM
The speed of mobile XML to PDF depends on the following factors: the complexity of XML structure. Mobile hardware configuration conversion method (library, algorithm) code quality optimization methods (select efficient libraries, optimize algorithms, cache data, and utilize multi-threading). Overall, there is no absolute answer and it needs to be optimized according to the specific situation.
 How to convert XML files to PDF on your phone?
Apr 02, 2025 pm 10:12 PM
It is impossible to complete XML to PDF conversion directly on your phone with a single application. It is necessary to use cloud services, which can be achieved through two steps: 1. Convert XML to PDF in the cloud, 2. Access or download the converted PDF file on the mobile phone.
 What is the function of C language sum?
Apr 03, 2025 pm 02:21 PM
There is no built-in sum function in C language, so it needs to be written by yourself. Sum can be achieved by traversing the array and accumulating elements: Loop version: Sum is calculated using for loop and array length. Pointer version: Use pointers to point to array elements, and efficient summing is achieved through self-increment pointers. Dynamically allocate array version: Dynamically allocate arrays and manage memory yourself, ensuring that allocated memory is freed to prevent memory leaks.
 Is there any mobile app that can convert XML into PDF?
Apr 02, 2025 pm 08:54 PM
An application that converts XML directly to PDF cannot be found because they are two fundamentally different formats. XML is used to store data, while PDF is used to display documents. To complete the transformation, you can use programming languages and libraries such as Python and ReportLab to parse XML data and generate PDF documents.
 How to convert xml into pictures
Apr 03, 2025 am 07:39 AM
XML can be converted to images by using an XSLT converter or image library. XSLT Converter: Use an XSLT processor and stylesheet to convert XML to images. Image Library: Use libraries such as PIL or ImageMagick to create images from XML data, such as drawing shapes and text.
 How to control the size of XML converted to images?
Apr 02, 2025 pm 07:24 PM
To generate images through XML, you need to use graph libraries (such as Pillow and JFreeChart) as bridges to generate images based on metadata (size, color) in XML. The key to controlling the size of the image is to adjust the values of the <width> and <height> tags in XML. However, in practical applications, the complexity of XML structure, the fineness of graph drawing, the speed of image generation and memory consumption, and the selection of image formats all have an impact on the generated image size. Therefore, it is necessary to have a deep understanding of XML structure, proficient in the graphics library, and consider factors such as optimization algorithms and image format selection.
 How to open xml format
Apr 02, 2025 pm 09:00 PM
Use most text editors to open XML files; if you need a more intuitive tree display, you can use an XML editor, such as Oxygen XML Editor or XMLSpy; if you process XML data in a program, you need to use a programming language (such as Python) and XML libraries (such as xml.etree.ElementTree) to parse.
 Recommended XML formatting tool
Apr 02, 2025 pm 09:03 PM
XML formatting tools can type code according to rules to improve readability and understanding. When selecting a tool, pay attention to customization capabilities, handling of special circumstances, performance and ease of use. Commonly used tool types include online tools, IDE plug-ins, and command-line tools.


