
 Technology peripherals
AI
The secret weapon to improve the prediction quality of deep learning models—context-aware data
Technology peripherals
AI
The secret weapon to improve the prediction quality of deep learning models—context-aware data
The secret weapon to improve the prediction quality of deep learning models—context-aware data

Translator | Zhu Xianzhong
Reviewer | Sun Shujuan
In this article, I would like to share with you my method of optimizing the input data of the deep learning model. As a data scientist and data engineer, I have successfully applied this technique to my own work. You'll learn how to use contextual information to enrich model input data through some concrete real-world development cases. This will help you design more robust and accurate deep learning models.

Deep learning models are very powerful because they are very good at integrating contextual information. We can improve the performance of neural networks by adding several contexts to the dimensions of the original data. We can achieve this through some clever data engineering.
When you develop a new predictive deep learning algorithm, you may choose a model architecture that is perfectly suitable for your specific use case. Depending on the input data and the actual prediction task, you may have thought of many methods: if you plan to classify images, then you are likely to choose a convolutional neural network; if you are predicting time series or analyzing text, then LSTM network Could be a promising option. Often, decisions about the correct model architecture are largely driven by the type of data flowing into the model.
As a result, finding the correct input data structure (that is, defining the input layer of the model) has become one of the most critical steps in model design. I usually devote more development time to shaping the input data than anything else. To be clear, we don't have to deal with a given raw data structure, just find a suitable model. The ability of neural networks to handle feature engineering and feature selection internally ("end-to-end modeling") does not exempt us from optimizing the structure of the input data. We should serve data in such a way that models can make the best sense from it and make the most informed decisions (i.e., the most accurate predictions). The “secret” factor here is context information. That is, we should enrich the raw data with as much context as possible.
What is context?
So, what do I mean by "context" specifically above? Let us give you an example. Mary is a data scientist who is starting a new job developing a sales forecasting system for a beverage retail company. In short, her task is: given a specific store and a specific product (lemonade, orange juice, beer...), her model should be able to predict the future sales of this product in the specific store. Predictions will be applied to thousands of different products offered by hundreds of different stores. So far, the system has been working fine. Mary's first day was spent in the sales department, where the forecasting work was already done, albeit manually by Peters, an experienced sales accountant. Her goal is to understand on what basis the domain expert determines the future demand for a particular product. As a good data scientist, Mary anticipates that Peters’ years of experience will be very helpful in defining which data might be more valuable to the model. To find out, Mary asked Peters two questions.
First question: "What data did you analyze to calculate how many bottles of a specific brand of lemonade we will sell in our stores in Berlin next month? How did you interpret the data?"
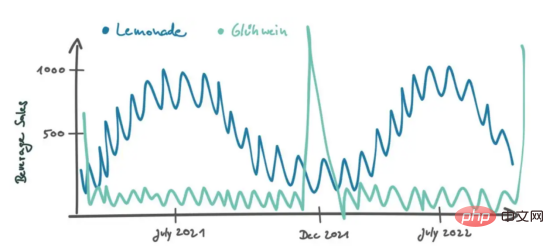
Peters replied: "Over time, we took the first steps in selling lemonade in Berlin." He then drew the following graph to illustrate his strategy:
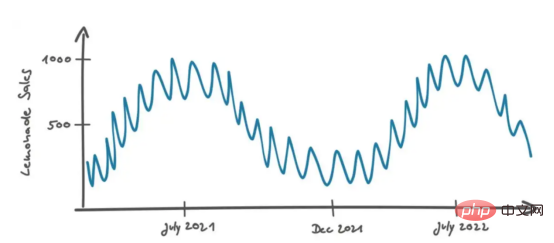
In the graph above, we see that there is a continuous curve, starting at 7 Peaks occur in April/August (Berlin summer time). In summer, when the temperature is higher, people prefer to eat snacks, so the sales of products will increase. This is very intuitive. On a smaller time scale (about a month) we see sales fluctuating within a range of about 10 items, possibly due to unpredictable events (random noise).
Peters continued: “When I see the repeating pattern of increased sales in the summer and decreased sales in the winter, I think it’s highly likely that will happen in the future as well, so I base my estimates on that possibility. sales." That sounds reasonable.
Peters interprets sales data in a temporal context, where the distance of two data points is defined by their time difference. If the data is not in chronological order, it is difficult to interpret. For example, if we only looked at the sales distribution in a histogram, the temporal context would be lost and our best estimate of future sales would be some aggregate value, such as the median of all values.
Context appears when data is sorted in a certain way.
It goes without saying that you should feed your sales forecasting model with historical sales data in the correct chronological order to preserve the "free" context from the database. Deep learning models are very powerful because they are very good at integrating contextual information, similar to our brains (in this case, of course, Peters' brain).
Have you ever wondered: why deep learning is so effective for image classification and image object detection? Because there is already a lot of "natural" context in ordinary images: images are basically data points of light intensity, arranged according to two background dimensions, namely spatial distance in the x direction and spatial spacing in the y direction. And cinema, as an animated form (a time sequence of images), adds time as a third contextual dimension.
Because context is so beneficial for prediction, we can improve model performance by adding more context dimensions - even though these dimensions are already included in the original data. We achieved this through some clever data engineering methods, as described next.
We should serve data in such a way that models can make the best sense from it and make the most informed decisions. I usually devote more development time to shaping the input data than anything else.
Designing context-rich data
Let’s return to Mary and Peters’ discussion. Mary knew that in most cases the real data didn't look as good as the chart above, so she modified the chart slightly so it looks like this:
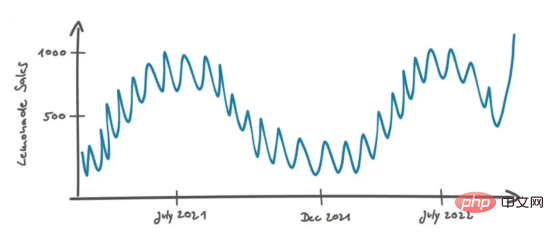
The second question Mary asked was: "What if the last sales data point is above the usual noise level? This could be a real scenario. Maybe the product is running a successful marketing campaign . Maybe the recipe has been changed and now tastes better. In these cases, the effect is long-lasting and future sales will remain at the same high level. Or it could just be an anomaly due to random events. For example, a person visiting Berlin of school class happened to walk into the store and all the children bought a bottle of this lemonade brand. In this case, the sales growth is not stable and can only be regarded as noise data. In this case, how do you Decide if this is going to be a real sales effect?"
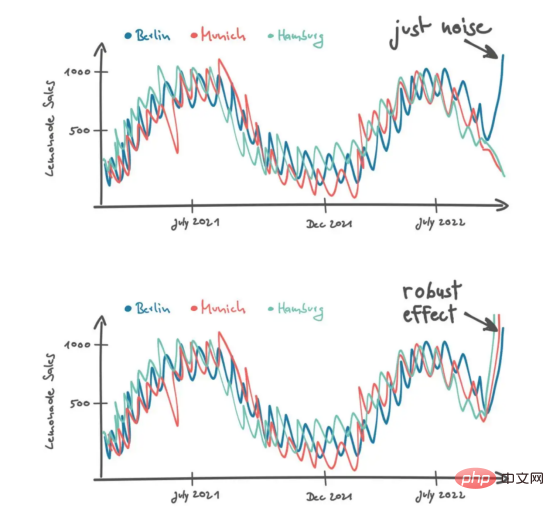
You can see Peters scratching his head before answering: "In this case, I'm looking at sales in stores similar to Berlin. .For example our stores in Hamburg and Munich. These stores are comparable because they are also located in major German cities. I would not consider stores in rural areas because I would expect different customers there with different tastes and preferences."
He added the sales curves of other stores to two possible scenarios. "If I see an increase in sales in Berlin, I think it's noise. But if I see an increase in lemonade sales in Hamburg and Munich, I hope it's a stabilizing effect."
So, in some rather difficult situations, Peters considers more data to make smarter decisions. He adds a new dimension of data in the context of different stores. As mentioned above, context occurs when data is ordered in a certain way. To create a store context, we first have to define a distance measure to order data from different stores accordingly. For example, Peters differentiates stores based on the size of the city in which they are located.
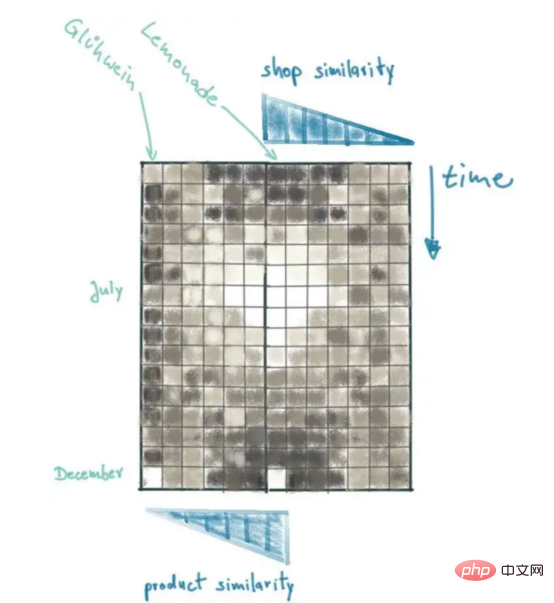
By applying some SQL and Numpy programming techniques, we can provide similar context for our models. First, we need to understand the population size of the city where our company stores are located; then, we measure the distance between all stores based on population differences; finally, we combine all sales data in a 2D matrix, where the first dimension is Time, the second dimension is our store distance metric.
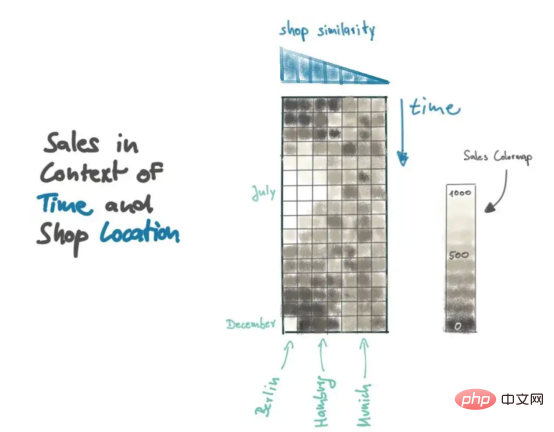
The sales matrix in the figure provides a good summary of recent lemonade sales, and the resulting patterns can be explained visually. Take a look at the data point in the lower left corner of the sales matrix: This is the most recent sales data for Berlin. Note that that bright spot is likely an exception, as similar stores (e.g. Burgers) won't repeat the sharp increase in sales. In contrast, the sales peak in July was reproduced by similar stores.
Therefore, we always need to add a distance indicator to create context.
Now, we translate Peters’ statement into mathematical terms that can be modeled based on the population size of the city where the product is located. When adding new context dimensions, we must consider the correct distance metric very carefully. It depends on what factors affect the entity we want to predict. The influencing factors depend entirely on the product and the distance indicator must be adjusted accordingly. For example, if you look at beer sales in Germany, you'll find that consumers are likely to purchase products from local breweries (you can find approximately 1,300 different breweries across the country).
People from Cologne usually drink Kursch, but when you drive half an hour north to the Düsseldorf region, people avoid Kursch in favor of the darker, maltier beer Stronger Alt beer. Therefore, in the case of German beer sales, modeling store distance by geographical distance might be a reasonable choice. However, this is not the case for other product categories (lemonade, orange juice, sports drinks…).
Because we added an additional context dimension, we created a context-rich dataset where potential predictive models can obtain lemonade sales profiles at different times and in different stores. This allows the model to make informed decisions about future sales at the Berlin store by looking at recent sales history and looking left and right at similar stores in other locations.
From here, we can further add product type as an additional contextual dimension. Therefore, we enrich the sales matrix with data from other products, ranked according to their similarity to lemonade (our prediction target). Again, we need to find a good similarity metric. Is Coke more like lemonade than orange juice? On what data can we define similarity rankings?
In the case of stores, we have a continuous measure, which is the population of the city. Now we are dealing with product categories. What we really want to find are products that have similar sales behavior to lemonade. In contrast to lemonade, we can conduct cross-correlation analysis of time-resolved sales data for all products. In this way, we obtain a Pearson correlation coefficient for each product, which tells us how similar the sales patterns are. Soft drinks such as Coke may have sales patterns similar to lemonade, with sales increasing during the summer. Other products will behave completely differently. For example, Gühwein, a warm, sweet wine served at Christmas markets, may have a strong sales peak in December and then have almost no sales during the rest of the year.
[Translator's Note] Time-resolved: the name of physics or statistics. Other commonly used words related to it are time-resolved diagnosis, time-resolved spectrum, etc.
Cross-correlation analysis will show that Glühwein wine has a lower Pearson coefficient (actually negative), while Coke has a higher Pearson coefficient .
Although adding a third dimension to the sales matrix, we can include product context by connecting the second dimension in the opposite direction. This puts the most important sales data (Berlin Lemonade sales) at the center:
Add more features
While we now have a very informative data structure, so far we only have one feature: the number of products sold for a specific product in a specific store at a specific time. This may already be enough to make robust and accurate predictions, but we can also add additional useful information from other data sources.
For example, beverage purchasing behavior is likely to depend on the weather. For example, during very hot summers, demand for lemonade may increase. We can provide weather data (such as air temperature) as the second layer of the matrix. Weather data will be ordered in the same context (store location and product) as sales data. For different products, we will get the same air temperature data. However, for different times and store locations, we will see that there are differences, which may provide useful information for the data.
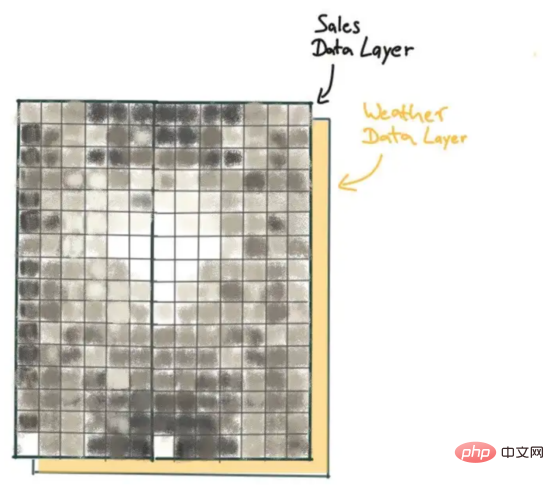
In this way, we have a three-dimensional matrix that further contains sales and temperature data. Note that we did not add an additional contextual dimension by including temperature data. As I pointed out before, context comes in when data is sorted in a certain way. For the data context we established, we sorted the data based on time, product similarity, and store similarity. However, the order of the features (in our case, along the third dimension of the matrix) is irrelevant. In fact, our data structure is equivalent to an RGB color image. In an RGB image, we have two context dimensions (spatial dimensions x and y) and three color layers (red, green, blue). For correct interpretation of the image, the order of the color channels is arbitrary. Once you define it, you have to keep it in order. But for data organized in a specific context, we have no distance metric.
In short, the structure of the input data cannot be determined in advance. Therefore, it is time for us to give full play to our creativity and intuition to discover new feasibility indicators.
Summary
By adding two additional contexts and an additional feature layer to the time-resolved sales data, we obtain a two-dimensional "channel" with two "channels" (sales and temperature) picture". This data structure provides a comprehensive view of recent lemonade sales at a specific store, as well as sales and weather information from similar stores and similar products. The data structures we have created so far are well suited for interpretation by deep neural networks - for example, containing multiple convolutional layers and LSTM units. But due to space limitations, I am not going to discuss how to start designing a suitable neural network based on this. This may be the subject of my follow-up article.
I want you to be able to have your own ideas, and while the structure of your input data may not be predetermined, you can (should) use all your creativity and intuition to extend it.
Generally speaking, context-rich data structures are not freely available. In order to predict various products across all the company's stores, we need to generate thousands of contextually rich sales profile information (one matrix for each store product mix). You have to put in a lot of extra work to design effective processing and buffering measures to get the data into the form you need and provide it for subsequent neural network rapid training and prediction cycles. Of course, by doing this, you get the desired deep learning model that can make accurate predictions and be very robust even with noisy data because it can appear to be able to "break the rules" and do Make very wise decisions.
Translator Introduction
Zhu Xianzhong, 51CTO community editor, 51CTO expert blogger, lecturer, computer teacher at a university in Weifang, and a veteran in the freelance programming industry.
Original title: Context-Enriched Data: The Secret Superpower for Your Deep Learning Model, author: Christoph Möhl
The above is the detailed content of The secret weapon to improve the prediction quality of deep learning models—context-aware data. For more information, please follow other related articles on the PHP Chinese website!

Hot AI Tools

Undresser.AI Undress
AI-powered app for creating realistic nude photos

AI Clothes Remover
Online AI tool for removing clothes from photos.

Undress AI Tool
Undress images for free

Clothoff.io
AI clothes remover

Video Face Swap
Swap faces in any video effortlessly with our completely free AI face swap tool!

Hot Article
Hot Tools

Notepad++7.3.1
Easy-to-use and free code editor

SublimeText3 Chinese version
Chinese version, very easy to use

Zend Studio 13.0.1
Powerful PHP integrated development environment

Dreamweaver CS6
Visual web development tools

SublimeText3 Mac version
God-level code editing software (SublimeText3)
Hot Topics
 1386
1386
 52
52

 Open source! Beyond ZoeDepth! DepthFM: Fast and accurate monocular depth estimation!
Apr 03, 2024 pm 12:04 PM
Open source! Beyond ZoeDepth! DepthFM: Fast and accurate monocular depth estimation!
Apr 03, 2024 pm 12:04 PM
0.What does this article do? We propose DepthFM: a versatile and fast state-of-the-art generative monocular depth estimation model. In addition to traditional depth estimation tasks, DepthFM also demonstrates state-of-the-art capabilities in downstream tasks such as depth inpainting. DepthFM is efficient and can synthesize depth maps within a few inference steps. Let’s read about this work together ~ 1. Paper information title: DepthFM: FastMonocularDepthEstimationwithFlowMatching Author: MingGui, JohannesS.Fischer, UlrichPrestel, PingchuanMa, Dmytr
 Beyond ORB-SLAM3! SL-SLAM: Low light, severe jitter and weak texture scenes are all handled
May 30, 2024 am 09:35 AM
Beyond ORB-SLAM3! SL-SLAM: Low light, severe jitter and weak texture scenes are all handled
May 30, 2024 am 09:35 AM
Written previously, today we discuss how deep learning technology can improve the performance of vision-based SLAM (simultaneous localization and mapping) in complex environments. By combining deep feature extraction and depth matching methods, here we introduce a versatile hybrid visual SLAM system designed to improve adaptation in challenging scenarios such as low-light conditions, dynamic lighting, weakly textured areas, and severe jitter. sex. Our system supports multiple modes, including extended monocular, stereo, monocular-inertial, and stereo-inertial configurations. In addition, it also analyzes how to combine visual SLAM with deep learning methods to inspire other research. Through extensive experiments on public datasets and self-sampled data, we demonstrate the superiority of SL-SLAM in terms of positioning accuracy and tracking robustness.
 Google is ecstatic: JAX performance surpasses Pytorch and TensorFlow! It may become the fastest choice for GPU inference training
Apr 01, 2024 pm 07:46 PM
Google is ecstatic: JAX performance surpasses Pytorch and TensorFlow! It may become the fastest choice for GPU inference training
Apr 01, 2024 pm 07:46 PM
The performance of JAX, promoted by Google, has surpassed that of Pytorch and TensorFlow in recent benchmark tests, ranking first in 7 indicators. And the test was not done on the TPU with the best JAX performance. Although among developers, Pytorch is still more popular than Tensorflow. But in the future, perhaps more large models will be trained and run based on the JAX platform. Models Recently, the Keras team benchmarked three backends (TensorFlow, JAX, PyTorch) with the native PyTorch implementation and Keras2 with TensorFlow. First, they select a set of mainstream
 Slow Cellular Data Internet Speeds on iPhone: Fixes
May 03, 2024 pm 09:01 PM
Slow Cellular Data Internet Speeds on iPhone: Fixes
May 03, 2024 pm 09:01 PM
Facing lag, slow mobile data connection on iPhone? Typically, the strength of cellular internet on your phone depends on several factors such as region, cellular network type, roaming type, etc. There are some things you can do to get a faster, more reliable cellular Internet connection. Fix 1 – Force Restart iPhone Sometimes, force restarting your device just resets a lot of things, including the cellular connection. Step 1 – Just press the volume up key once and release. Next, press the Volume Down key and release it again. Step 2 – The next part of the process is to hold the button on the right side. Let the iPhone finish restarting. Enable cellular data and check network speed. Check again Fix 2 – Change data mode While 5G offers better network speeds, it works better when the signal is weaker
 Implementing Machine Learning Algorithms in C++: Common Challenges and Solutions
Jun 03, 2024 pm 01:25 PM
Implementing Machine Learning Algorithms in C++: Common Challenges and Solutions
Jun 03, 2024 pm 01:25 PM
Common challenges faced by machine learning algorithms in C++ include memory management, multi-threading, performance optimization, and maintainability. Solutions include using smart pointers, modern threading libraries, SIMD instructions and third-party libraries, as well as following coding style guidelines and using automation tools. Practical cases show how to use the Eigen library to implement linear regression algorithms, effectively manage memory and use high-performance matrix operations.
 The vitality of super intelligence awakens! But with the arrival of self-updating AI, mothers no longer have to worry about data bottlenecks
Apr 29, 2024 pm 06:55 PM
The vitality of super intelligence awakens! But with the arrival of self-updating AI, mothers no longer have to worry about data bottlenecks
Apr 29, 2024 pm 06:55 PM
I cry to death. The world is madly building big models. The data on the Internet is not enough. It is not enough at all. The training model looks like "The Hunger Games", and AI researchers around the world are worrying about how to feed these data voracious eaters. This problem is particularly prominent in multi-modal tasks. At a time when nothing could be done, a start-up team from the Department of Renmin University of China used its own new model to become the first in China to make "model-generated data feed itself" a reality. Moreover, it is a two-pronged approach on the understanding side and the generation side. Both sides can generate high-quality, multi-modal new data and provide data feedback to the model itself. What is a model? Awaker 1.0, a large multi-modal model that just appeared on the Zhongguancun Forum. Who is the team? Sophon engine. Founded by Gao Yizhao, a doctoral student at Renmin University’s Hillhouse School of Artificial Intelligence.
 Tesla robots work in factories, Musk: The degree of freedom of hands will reach 22 this year!
May 06, 2024 pm 04:13 PM
Tesla robots work in factories, Musk: The degree of freedom of hands will reach 22 this year!
May 06, 2024 pm 04:13 PM
The latest video of Tesla's robot Optimus is released, and it can already work in the factory. At normal speed, it sorts batteries (Tesla's 4680 batteries) like this: The official also released what it looks like at 20x speed - on a small "workstation", picking and picking and picking: This time it is released One of the highlights of the video is that Optimus completes this work in the factory, completely autonomously, without human intervention throughout the process. And from the perspective of Optimus, it can also pick up and place the crooked battery, focusing on automatic error correction: Regarding Optimus's hand, NVIDIA scientist Jim Fan gave a high evaluation: Optimus's hand is the world's five-fingered robot. One of the most dexterous. Its hands are not only tactile
 Explore the underlying principles and algorithm selection of the C++sort function
Apr 02, 2024 pm 05:36 PM
Explore the underlying principles and algorithm selection of the C++sort function
Apr 02, 2024 pm 05:36 PM
The bottom layer of the C++sort function uses merge sort, its complexity is O(nlogn), and provides different sorting algorithm choices, including quick sort, heap sort and stable sort.
