 Technology peripherals
 AI
AI
 ChiQA - a picture question and answer dataset based on 200,000 real user questions
ChiQA - a picture question and answer dataset based on 200,000 real user questions
In recent years, with the vigorous development of question answering technology and multi-modal understanding technology, visual question answering tasks (Visual Question Answering) have become more and more popular. Large-scale visual question answering datasets such as VQA, CLEVER, and Visual-7W have been released one after another, which has greatly promoted the iterative development of visual question answering tasks. However, most of the current visual question answering data are artificially synthesized questions, such as "What color is her eyes?" which are fictitiously designed by the annotator after seeing the picture. Manually generated data will be relatively simple, low-quality and even biased. Therefore, in this work, we propose a large-scale Chinese-based image question and answer dataset: ChiQA based on real questions from users in QQ browser.
ChiQA contains over 40,000 real user queries and over 200,000 question-image pairs. The data and some baseline models have been published on GitHub. Relevant research has been accepted into the CIKM2022 long article.

##Paper address: https://arxiv.org/abs/2208.03030
Github address: https://github.com/benywon/ChiQA
Comparison of single-modal question answering tasksThree salient features of ChiQAQuestion Answering is one of the very important tasks in artificial intelligence and intelligent language processing. In recent years, with the release of large-scale data sets (such as SQuAD, NaturalQuestions) and the introduction of large-scale pre-trained language models (such as BERT, GPT), question and answer tasks have developed rapidly. However, most current question answering tasks are unimodal, that is, questions, resources, and answers are all text-based. However, from the perspective of cognitive intelligence and practical applications, multi-modal resources such as images can often provide richer information and answers. For example, for a question: What are the dimensions of iPhone13? A size comparison chart for different iPhone13 models would be more clear and intuitive. There are also some examples as shown below:
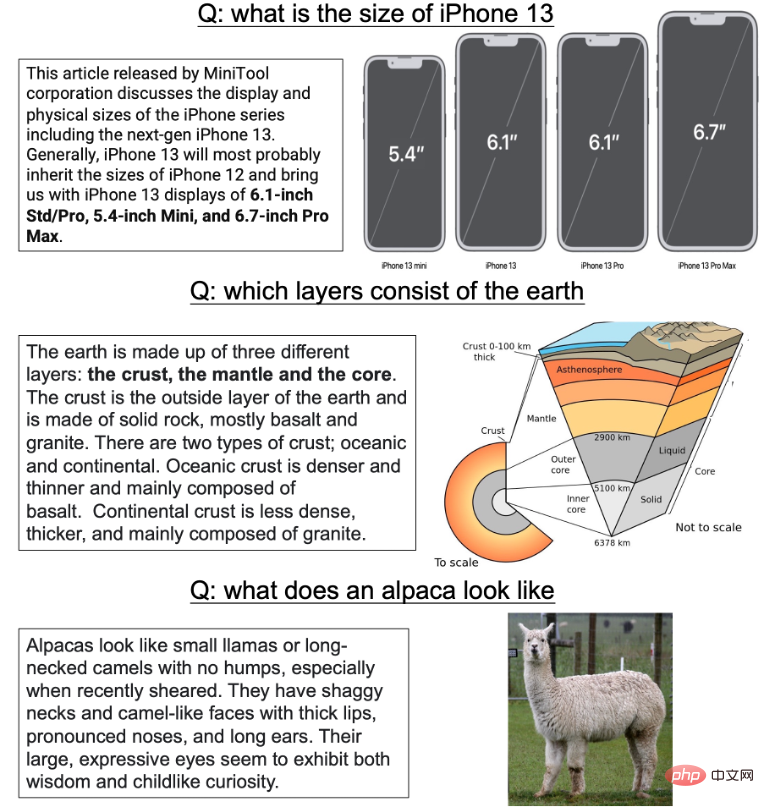
Figure 1: Some examples that are suitable for using pictures to answer user questions
In recent years, question and answer data and tasks for multi-modal understanding have been proposed one after another. Such as VQA1.0 and 2.0, CLEVR, GQA, etc. In most image question and answer data sets, the system provides some artificially generated or real images to annotators, and the annotators need to manually write some questions targeting specific attributes or entities. However, this data collection process inevitably has many flaws:
1) All questions are image-dependent, that is, the annotator asks the question after seeing the picture. question. In the process of large-scale data construction, artificially generated questions often lack diversity and are often biased due to the subjective factors of the annotators. Models trained on this kind of data that looks at the resources first and then asks questions can often easily achieve very good results by looking at the questions without looking at the background resources;
2) Secondly, in the traditional In VQA data, the answer is often a simple entity, relationship or a simple description of a specific area. However, for actual image question and answer tasks, many textual answers are unnecessary. For example, for the question: "What does an alpaca look like?" providing a lengthy answer describing the appearance of an alpaca is very redundant. Secondly, this kind of short entity description often causes annotators to only pay attention to local relationships and pay little attention to some information on the real overall structure;
3) Finally, most of the previous The resources tend to focus on English, with very little image question and answer data in the Chinese domain.
In this work, in response to the above problems, we propose a large-scale Chinese image question answering data set - ChiQA (Chinese Image Question Answering). We started with the user's real search terms in the mobile QQ browser, retrieved several related pictures through a specific API, and then handed the pictures to professionally trained annotators for three-level annotation to indicate whether the picture can answer the question perfectly ( 2 points), partially answered (1 point), and unable to answer (0 points) the user’s question. For ChiQA, there are three notable features:
- #Real questions, real pictures: The pictures in ChiQA come from random user queries. These queries are random user queries in the open domain. These queries are very diverse, and the domain distribution of the queries is very wide. Such random diversity query ensures that the questions in our data will not be biased;
- Answerability: For question and answer tasks, answerability is a very important aspect . In ChiQA we do not require the annotator to give the final answer: this often introduces some additional bias, such as the annotator’s common sense. Instead, we focus on answerability, that is, whether the image can answer the question. This answerability allows ChiQA annotators to understand both the query and the image; Frequent or single questions often appear many times, and questions of this simple pattern will occupy the majority in the data, causing a bias in the true cross-modal understanding of the data. Therefore, we introduced a two-stage active learning process in the data collection process. After the random query annotation was completed in the first stage, we trained a simple model, and then used this model to select some "harder" models, thereby Make the data richness and difficulty in the second-stage annotation data relatively higher.
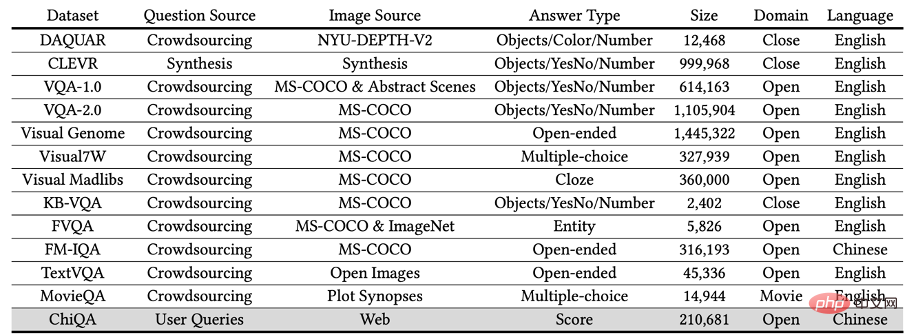
In the end we collected more than 40,000 questions, each question has about 5 related pictures, that is, a total of more than 200,000 question-picture pairs. Each question has several pictures, and we score each picture on a three-step scale of 2-1-0.
Some examples in ChiQA are shown below:
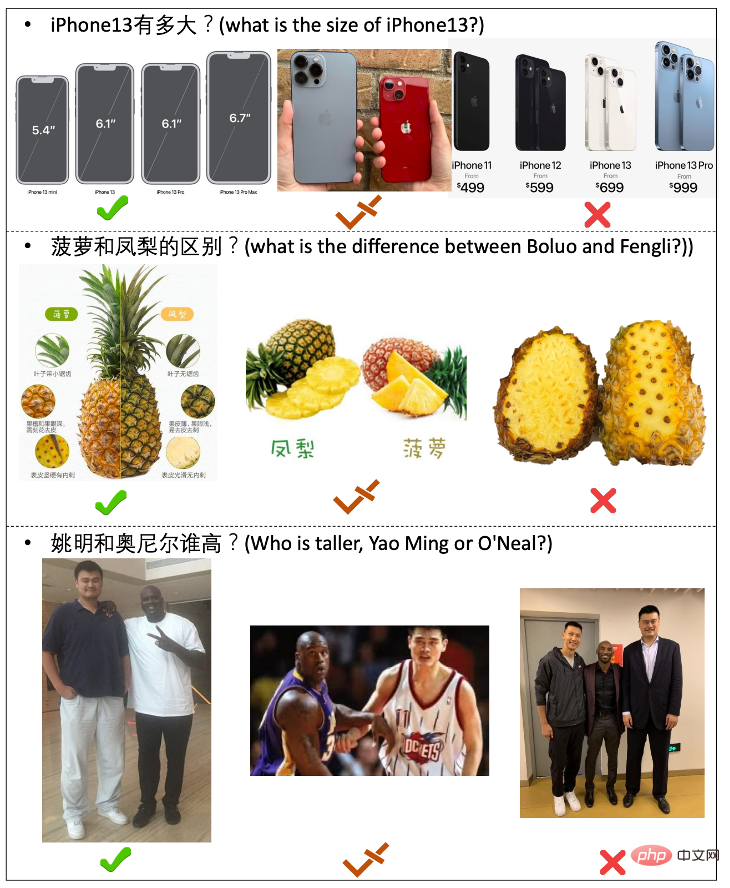
Data collection: All questions come from real user queries
The entire data collection process can be divided into four steps. The overall flow chart is as follows :
##Figure 4: Data collection process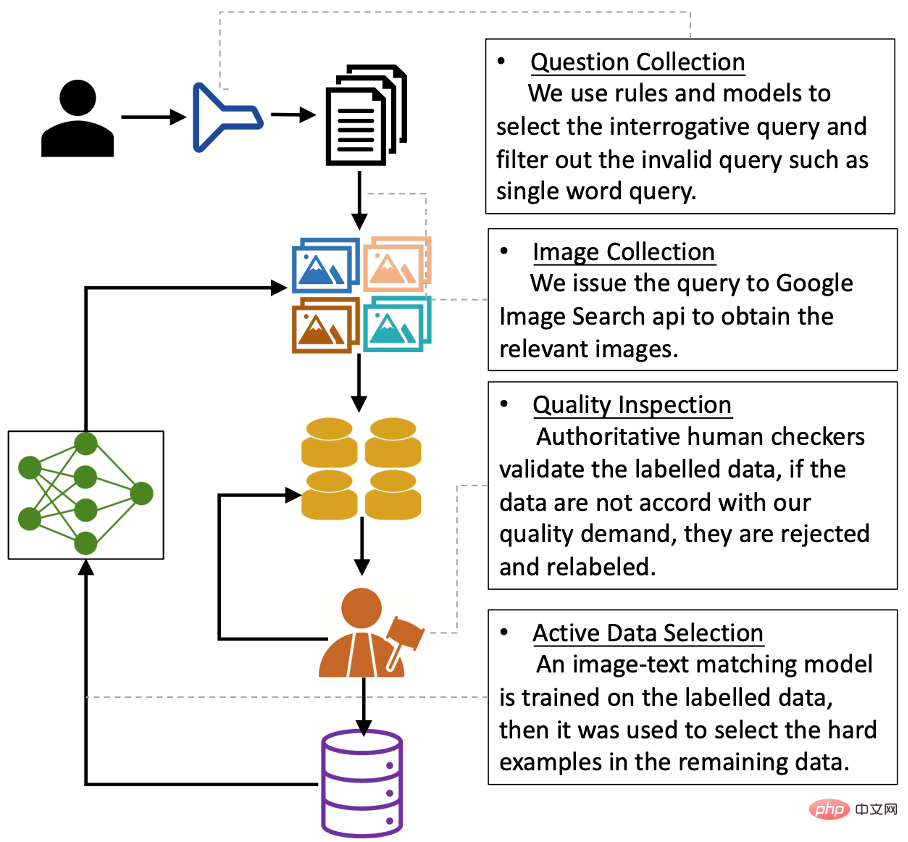
A major feature of ChiQA is that all questions come from real user queries. However, if we randomly sample users' queries from search engine users' search logs, most of the queries will have no question-and-answer intent.
So we first need to filter out queries with question and answer intent. In this work, we use an internally constructed weak supervision method to train a binary classifier to determine whether a query has question-answering intent. Human evaluation of this intent model was able to achieve 90% precision and 80% recall. We used this model to sample user queries and obtained approximately 75,000 user queries that were judged by the model to have Q&A intentions and entered the next round.
Image Collection & Annotation Process and Experience
After getting the questions, we send these questions to the open API provided by Google (Google Images API - SerpApi) for related image retrieval. The Google API returns the 100 most relevant images for each query. In order to ensure the quality of the final data, we removed queries whose length or width were less than 200 pixels and images that were too long or too wide.
After obtaining the original image, we take the first 5 filtered images and ask the annotator to annotate the query and the corresponding 5 images. We have designed an annotation interface specifically for this task, as shown in the figure below.
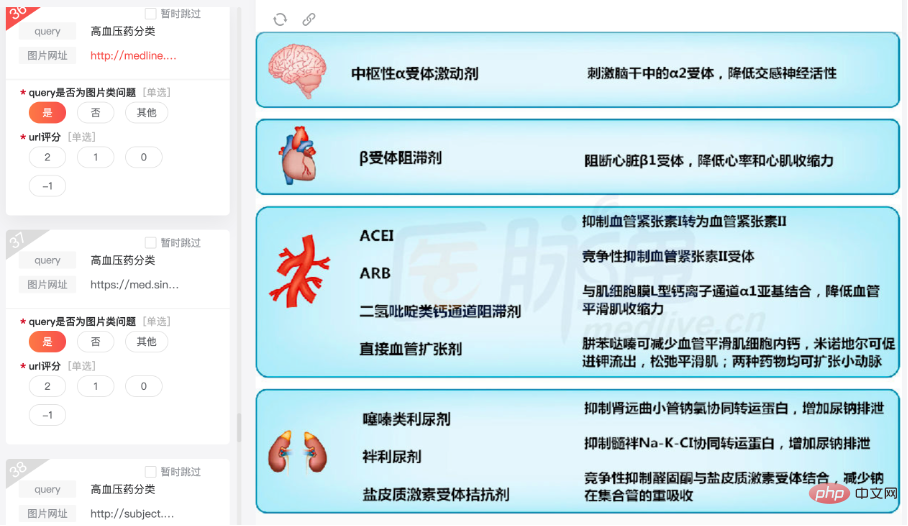
Figure 5: ChiQA annotation interface
During the annotation process , we asked the annotators to mark three aspects:
1) Problem annotation
Since this work mainly focuses on Picture Q&A, in fact, many common user questions have nothing to do with picture Q&A (or are difficult to answer with pictures). Therefore, we first ask the annotator to mark whether this question can be regarded as an image question and answer question. For example:
If a question is "the difference between xxx and xxx", then this question will be considered as a question with the intention of image question and answer;
If a question is vague, ambiguous, or contains opinions that are not based on factual inferences, then the question will be classified as having no image Q&A intention and will not participate in the subsequent image annotation process.
Some query annotation examples are shown in Figure 6:
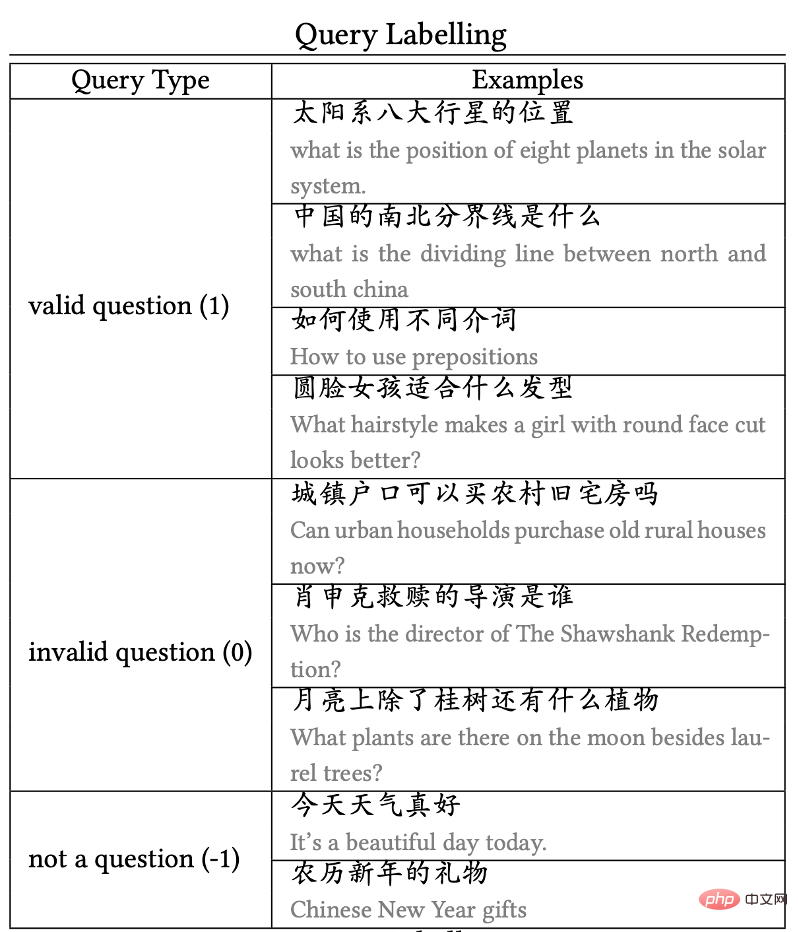
Figure 6: Example of query annotation
2) Image annotation
For the valid query in the previous step, we Label its 5 candidate queries. The annotation standard is three-level 0-1-2 annotation, where:
0 points means that the picture cannot be used to answer this question at all, and 2 points means that the picture quality is acceptable and can be fully used. Answer this question independently. The picture with a score of 1 is somewhere between the two, which means that the picture is related to the query, but it cannot be answered directly. The user may need more queries or reasoning to get the final answer. Some examples of 0 points, 1 points, and 2 points are shown below:
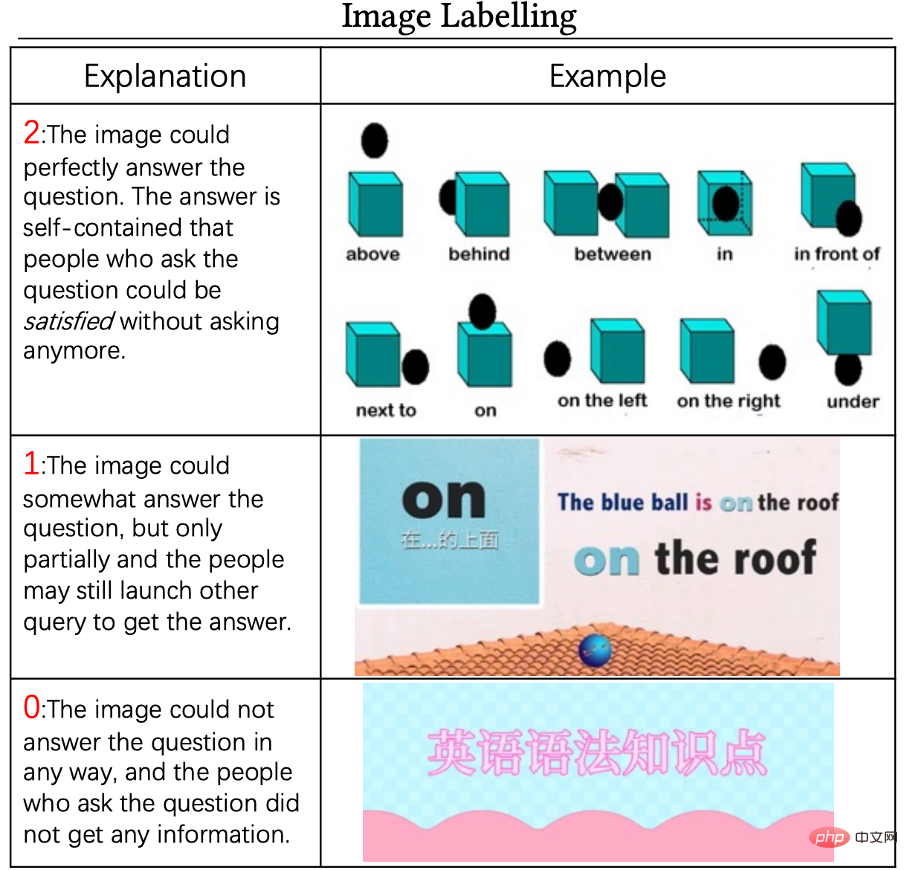
## Figure 7: For the question "How to use different prepositions ”, Example of image annotation and scoring
3) Quality control
We are in the entire annotation process A strict quality control program is adopted. Specifically, we will first invite 3 quality teams to conduct trial annotation, and select the team with the best annotation quality to annotate all the remaining data. Secondly, during the annotation process, we will divide the annotated data into batches. For each batch of data, we will sample one-fifth of the data for manual verification. If the pass rate of the data is less than 90%, then this batch The data will be returned and re-labeled until the data accuracy reaches 90%.
Active learning data annotation
Make the results more unbiased
After data collection work, we found that if the data is randomly sampled and annotated, there will often be There are some simple patterns, and the presence of such simple patterns in large numbers in the data may bias the final model. Therefore, we design an active learning annotation process. Specifically, we will first ask annotators to annotate a batch of data. After the annotation of this batch of data is completed, we will use this batch of data to train a transmembrane text-image matching model. After the model is trained, we start to use this model to "select" new samples: if the model is very uncertain about the prediction of this new sample (that is, the entropy of the final classification prediction is particularly large), then we think this sample is relatively difficult for the model. Therefore, there is a higher probability of retaining it until the middle of the next round. Otherwise, it means that the model is very confident in the data, so the model will retain it with a smaller probability until the next round.
We found that the active learning data selection process indeed makes the dataset more unbiased. We found that the labeled data from the first stage contained some imperceptible biases. For example, questions containing the word "Tips" are marked as valid questions, but almost all corresponding images are marked as unanswerable (i.e., 0 points). Therefore, the model is likely to predict the final question directly based on the questions in the query without looking at the image. result. This active learning process reduces the possibility that this high-confidence and biased shortcut will be difficult to select in the next round, thus reducing the impact of this model.
Test set annotation
We randomly filtered out 2500 pieces of data from the annotated data and asked different annotators to re-annotate them. If the annotation result is the same as the previous result, the data is retained as the test set. If it is different, we ask an "expert" who knows the task very well to re-annotate the data, and finally get 2362 test data and more than 40,000 training data. The statistical information of the training set and the test set is shown in the following figure:

Figure 8: The statistical information of the training set and the test set in ChiQA
Inference and analysis of data
After annotating the data, we perform statistics and analysis on the data in ChiQA.
1) Query common word analysis:
We use stuttering word segmentation to segment query, and query The words in are displayed on the following cloud chart according to frequency:
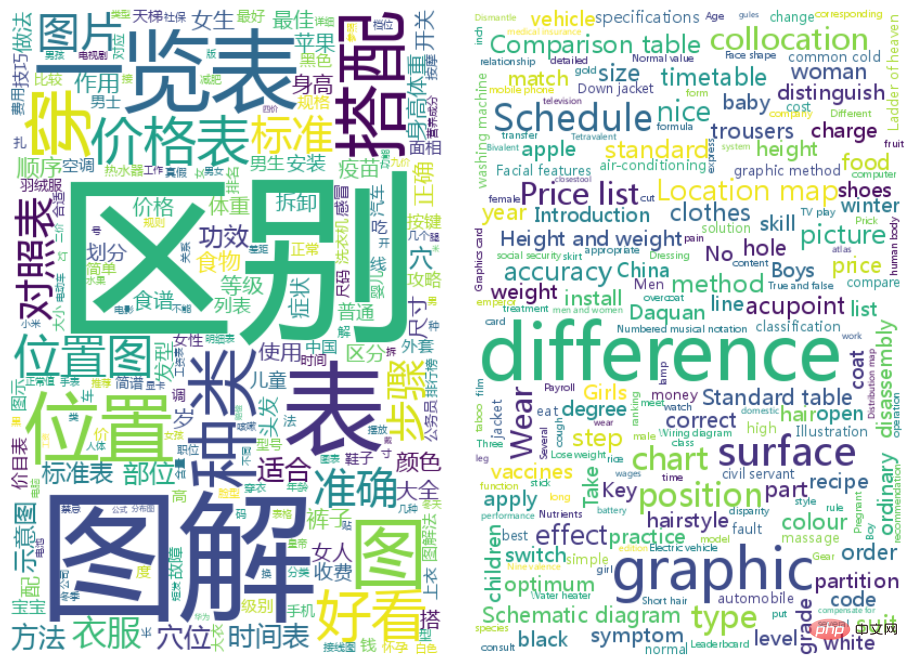
#You can see that the most common query in ChiQA is Differences, illustrations, locations, etc. This is consistent with our intuition, because these words are indeed very suitable questions for pictures to answer.
2) Domain analysis
We use an internal domain classification classifier to perform all queries Classification, the final result is shown in the figure below:
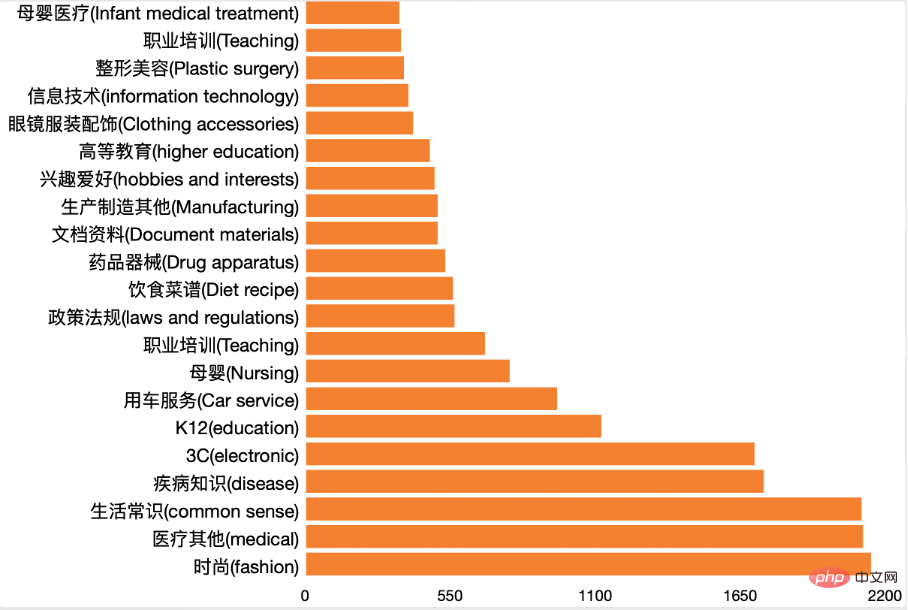
It can be seen that our data contains data in many fields, and there is no one The data in the field account for an absolute majority. This ensures that our data distribution is even. Secondly, we also count the interrogative words in the question. The results are shown in the following figure:
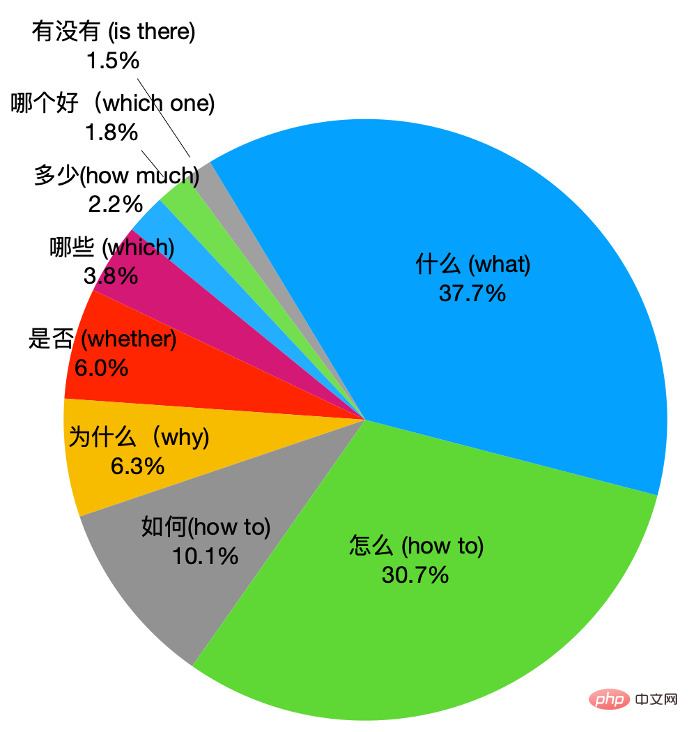
You can see the what class and how to in ChiQA Questions like this account for the majority, and some other questions also have a considerable proportion.
3) Image analysis
In addition to questions, we also performed analysis on images in ChiQA. Since most images are language-independent, we use a target detection model DETR that is recognized as having excellent performance in the industry to mine entities in the image. DETR can map entities in the image to entities defined by standard MS-COCO, such as "person", "dog", etc. We mine entities for each image in ChiQA and display the distribution of the highest frequency entities in the following figure:
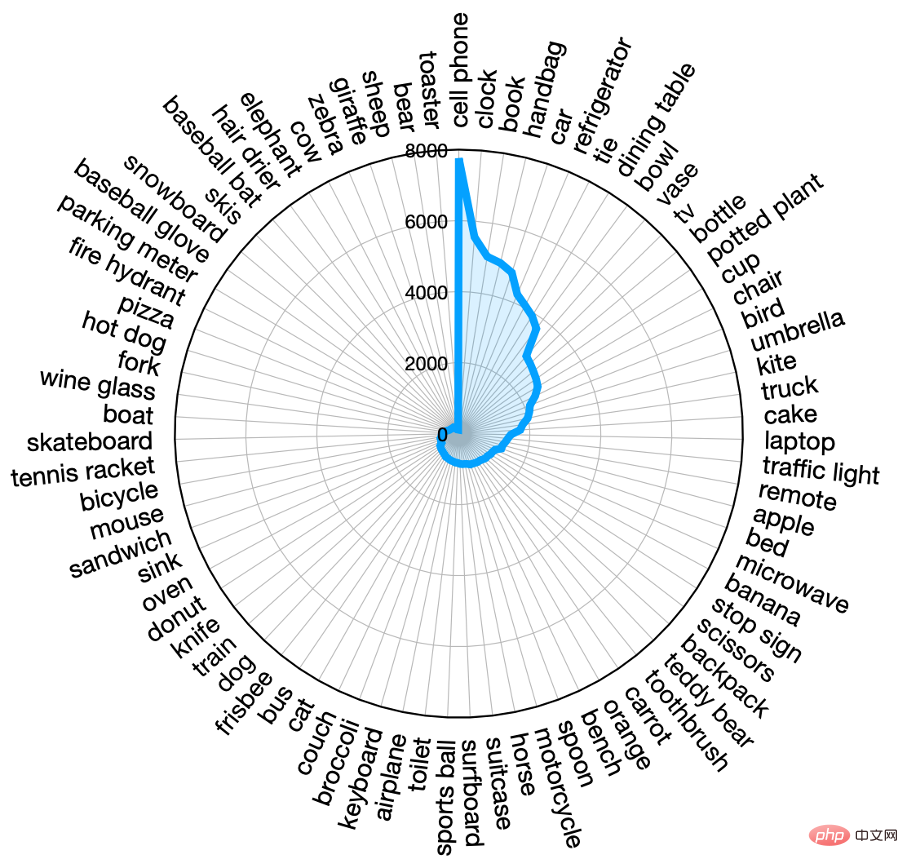
You can see in ChiQA More than 30 entities appear at least 1000 times in , which shows that ChiQA is an image data that is very evenly distributed and covers most fields. The entities that appear most often are "person", "mobile phone", "car", etc. . This is similar to the distribution of questions.
4) Reasoning skills
In order to better analyze the data, we also analyze the ChiQA data required reasoning skills were analyzed. Focused on analyzing 5 skills that require reasoning:
- Grouding: Models and systems are required to understand and locate the entities mentioned in the question
- Reading: The model is required to understand the text that appears in the picture
- Comparison: The model is required to compare some different attributes and content, such as height, size, etc.
- Causal reasoning: The model requires a deep understanding of the problem and the causal part that exists in the picture (i.e., the reason why something happened or the result)
- Logical reasoning: required The model understands the problem or some logical comparison factors in the picture, such as negation, conditions, etc.
We randomly sampled 200 pieces of ChiQA data and labeled them according to the above 5 standards. , some of which data may require more than one reasoning skill. The result is shown below.
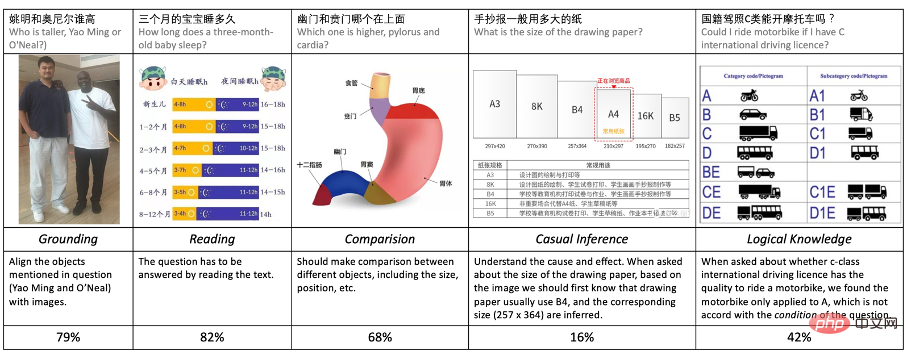
It can be seen that in addition to Grouding, more than 80% of ChiQA data requires in-depth understanding of text and contrast relationships in images. This is very different from most previous VQA data. Secondly, there are quite a few questions that require logic and comparison, indicating that the data in ChiQA is quite difficult. We believe that the analysis of reasoning skills in ChiQA can help us better understand this data and provide some a priori guidance for subsequent model design.
Experimental evaluation indicators
In the ChiQA data set, there are three levels of annotation scoring: 0, 1, 2, so in the experiment we test the model ranking indicators and ordinary classification index of. Divided into three categories:
- NDCG@N: Normalized Discounted Cumulative Gain
- Mean Average Precision (MAP@N): Average Accuracy (MAP@N)
- Accuray / Precision / Recall / F1
Baseline Model
We experimented with multiple commonly used models on the ChiQA data set. Following the previous image-text matching work, we first encode the image and text with encoders respectively, then perform cross-modal fusion of their representations, and finally use a prediction layer to obtain the matching score. In the models listed below, adding ♣ means that the model has been pre-trained, and adding ♦ means that it has not been pre-trained.
- Random♦: For each piece of data in the test set, randomly select a prediction score among 0, 1, and 2. The random model is used as a baseline model on ChiQA.
- Majority♦: Select the label that appears most in the training set as the prediction score for all data on the test set.
- LSTM ResNet♦: Before the emergence of large-scale pre-trained models for text and vision, LSTM and ResNet were one of the most commonly used models in the fields of text and vision respectively.
- Bert ViT♣: We use the Bert model to encode query text and the ViT model to encode images, where both Bert and ViT models are pre-trained on large-scale unsupervised data. Finally, use the representation vector of to predict the matching score.
- ALBEF♣: ALBEF is a large-scale visual and language representation learning that has demonstrated large improvements on a variety of visual language tasks.
- Pretrain♣: For Chinese cross-modal pre-training, we perform trans-membrane state pre-training on Bert-ViT and ALBEF on the Wukong data set. The pre-training method is similar to ALBEF. The Wukong dataset is an open source cross-modal data containing 100 million image-text pairs.
- Wenlan♣: Wenlan is a large-scale multi-modal pre-trained model trained on 30 million text-image pairs with nearly a billion parameters. We use their public API service to obtain the representation vectors of text and images, and use the CoS similarity of the two vectors as the predicted matching score.
- Human: In addition to the above models, we also evaluated the prediction level of humans on the test set. Due to the large amount of data in the test set, we randomly sampled 100 pieces of data manually for prediction and evaluation of prediction indicators.
The following is the result display:
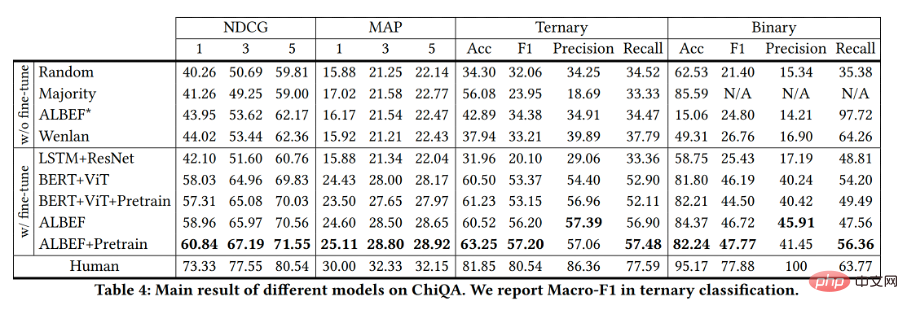
The above model The indicators on the test set are shown in the figure. We can see that direct application of previous state-of-the-art cross-modal methods performs poorly, with metrics only slightly better than random scoring models. This means that ChiQA data is difficult and models that only use large-scale weakly supervised contrastive learning, such as ALBEF*, Wenlan, may not be able to distinguish the fine-grained information required for visual question answering. Furthermore, the poor performance of these models illustrates that the ChiQA dataset is different from previous weakly supervised image-text matching data because weakly supervised image-text matching focuses on correlation, while the ChiQA data also requires answerability of images.
Finally, the model fine-tuned on ChiQA has made great progress over the baseline, but is still far from human performance, so the model still has a lot to do on the ChiQA dataset. room for improvement.
Application of ChiQA in products
With the development of the Internet, users have higher demands for questions and answers, and the system needs to provide more intuitive and convenient answers. Especially in recent years, multimedia content has become increasingly abundant, and more and more Q&A content based on pictures and videos has appeared in front of the public. The QQ Browser Lab Lizhi team was the first in the industry to launch a picture question and answer project in April this year. For example, if a user searches for the difference between kiwi fruit and kiwi fruit, the results will be intuitively displayed in front of the user in the form of pictures. As shown in the figure below:
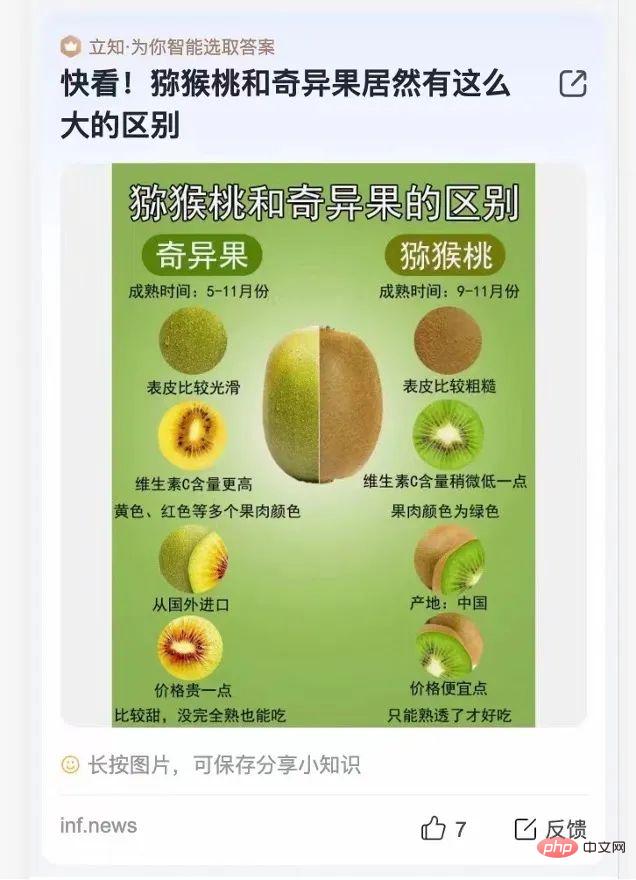
Currently, this kind of problem that can be directly satisfied by pictures has achieved good results after it went online. We have observed that its user behavior (such as CTR, word exchange rate, etc.) has been significantly improved compared to traditional results, indicating that the current "new Q&A" based on pictures, etc., is a product business that can better meet user needs.
Introduction to the author team
The QQ Browser Search Technology Center team is the team responsible for search technology research and development of Tencent PCG information platform and service line. Relying on Tencent's content ecology, it drives product innovation through user research, providing users with graphics, information, novels, Long and short videos, services and other multi-faceted information needs are met. In terms of algorithms, based on natural language processing, deep learning, multi-modal understanding and generation, knowledge calculation and application and other technologies, we build content understanding, correlation and sorting, multi-modal search, intelligent question and answer, multi-language translation, search Recommended and other technical directions, explore and apply the industry's advanced technologies to create a better user search experience; in terms of engineering, build a mid-stage industrialized system for search technology and polish a high-performance, high-availability, low-cost tens of billions-level retrieval system to provide Tencent with PCG provides basic search engine services for the search scenarios of various content businesses. It currently supports multiple PCG product lines such as QQ Browser, Tencent Video, Tencent News, and Tencent Weishi.
The above is the detailed content of ChiQA - a picture question and answer dataset based on 200,000 real user questions. For more information, please follow other related articles on the PHP Chinese website!

Hot AI Tools

Undresser.AI Undress
AI-powered app for creating realistic nude photos

AI Clothes Remover
Online AI tool for removing clothes from photos.

Undress AI Tool
Undress images for free

Clothoff.io
AI clothes remover

AI Hentai Generator
Generate AI Hentai for free.

Hot Article

Hot Tools

Notepad++7.3.1
Easy-to-use and free code editor

SublimeText3 Chinese version
Chinese version, very easy to use

Zend Studio 13.0.1
Powerful PHP integrated development environment

Dreamweaver CS6
Visual web development tools

SublimeText3 Mac version
God-level code editing software (SublimeText3)

Hot Topics
 1378
1378
 52
52
 Have you really mastered coordinate system conversion? Multi-sensor issues that are inseparable from autonomous driving
Oct 12, 2023 am 11:21 AM
The first pilot and key article mainly introduces several commonly used coordinate systems in autonomous driving technology, and how to complete the correlation and conversion between them, and finally build a unified environment model. The focus here is to understand the conversion from vehicle to camera rigid body (external parameters), camera to image conversion (internal parameters), and image to pixel unit conversion. The conversion from 3D to 2D will have corresponding distortion, translation, etc. Key points: The vehicle coordinate system and the camera body coordinate system need to be rewritten: the plane coordinate system and the pixel coordinate system. Difficulty: image distortion must be considered. Both de-distortion and distortion addition are compensated on the image plane. 2. Introduction There are four vision systems in total. Coordinate system: pixel plane coordinate system (u, v), image coordinate system (x, y), camera coordinate system () and world coordinate system (). There is a relationship between each coordinate system,
 The Stable Diffusion 3 paper is finally released, and the architectural details are revealed. Will it help to reproduce Sora?
Mar 06, 2024 pm 05:34 PM
StableDiffusion3’s paper is finally here! This model was released two weeks ago and uses the same DiT (DiffusionTransformer) architecture as Sora. It caused quite a stir once it was released. Compared with the previous version, the quality of the images generated by StableDiffusion3 has been significantly improved. It now supports multi-theme prompts, and the text writing effect has also been improved, and garbled characters no longer appear. StabilityAI pointed out that StableDiffusion3 is a series of models with parameter sizes ranging from 800M to 8B. This parameter range means that the model can be run directly on many portable devices, significantly reducing the use of AI
 This article is enough for you to read about autonomous driving and trajectory prediction!
Feb 28, 2024 pm 07:20 PM
Trajectory prediction plays an important role in autonomous driving. Autonomous driving trajectory prediction refers to predicting the future driving trajectory of the vehicle by analyzing various data during the vehicle's driving process. As the core module of autonomous driving, the quality of trajectory prediction is crucial to downstream planning control. The trajectory prediction task has a rich technology stack and requires familiarity with autonomous driving dynamic/static perception, high-precision maps, lane lines, neural network architecture (CNN&GNN&Transformer) skills, etc. It is very difficult to get started! Many fans hope to get started with trajectory prediction as soon as possible and avoid pitfalls. Today I will take stock of some common problems and introductory learning methods for trajectory prediction! Introductory related knowledge 1. Are the preview papers in order? A: Look at the survey first, p
 DualBEV: significantly surpassing BEVFormer and BEVDet4D, open the book!
Mar 21, 2024 pm 05:21 PM
This paper explores the problem of accurately detecting objects from different viewing angles (such as perspective and bird's-eye view) in autonomous driving, especially how to effectively transform features from perspective (PV) to bird's-eye view (BEV) space. Transformation is implemented via the Visual Transformation (VT) module. Existing methods are broadly divided into two strategies: 2D to 3D and 3D to 2D conversion. 2D-to-3D methods improve dense 2D features by predicting depth probabilities, but the inherent uncertainty of depth predictions, especially in distant regions, may introduce inaccuracies. While 3D to 2D methods usually use 3D queries to sample 2D features and learn the attention weights of the correspondence between 3D and 2D features through a Transformer, which increases the computational and deployment time.
 The first multi-view autonomous driving scene video generation world model | DrivingDiffusion: New ideas for BEV data and simulation
Oct 23, 2023 am 11:13 AM
Some of the author’s personal thoughts In the field of autonomous driving, with the development of BEV-based sub-tasks/end-to-end solutions, high-quality multi-view training data and corresponding simulation scene construction have become increasingly important. In response to the pain points of current tasks, "high quality" can be decoupled into three aspects: long-tail scenarios in different dimensions: such as close-range vehicles in obstacle data and precise heading angles during car cutting, as well as lane line data. Scenes such as curves with different curvatures or ramps/mergings/mergings that are difficult to capture. These often rely on large amounts of data collection and complex data mining strategies, which are costly. 3D true value - highly consistent image: Current BEV data acquisition is often affected by errors in sensor installation/calibration, high-precision maps and the reconstruction algorithm itself. this led me to
 To provide a new scientific and complex question answering benchmark and evaluation system for large models, UNSW, Argonne, University of Chicago and other institutions jointly launched the SciQAG framework
Jul 25, 2024 am 06:42 AM
Editor |ScienceAI Question Answering (QA) data set plays a vital role in promoting natural language processing (NLP) research. High-quality QA data sets can not only be used to fine-tune models, but also effectively evaluate the capabilities of large language models (LLM), especially the ability to understand and reason about scientific knowledge. Although there are currently many scientific QA data sets covering medicine, chemistry, biology and other fields, these data sets still have some shortcomings. First, the data form is relatively simple, most of which are multiple-choice questions. They are easy to evaluate, but limit the model's answer selection range and cannot fully test the model's ability to answer scientific questions. In contrast, open-ended Q&A
 GSLAM | A general SLAM architecture and benchmark
Oct 20, 2023 am 11:37 AM
Suddenly discovered a 19-year-old paper GSLAM: A General SLAM Framework and Benchmark open source code: https://github.com/zdzhaoyong/GSLAM Go directly to the full text and feel the quality of this work ~ 1 Abstract SLAM technology has achieved many successes recently and attracted many attracted the attention of high-tech companies. However, how to effectively perform benchmarks on speed, robustness, and portability with interfaces to existing or emerging algorithms remains a problem. In this paper, a new SLAM platform called GSLAM is proposed, which not only provides evaluation capabilities but also provides researchers with a useful way to quickly develop their own SLAM systems.
 'Minecraft' turns into an AI town, and NPC residents role-play like real people
Jan 02, 2024 pm 06:25 PM
Please note that this square man is frowning, thinking about the identities of the "uninvited guests" in front of him. It turned out that she was in a dangerous situation, and once she realized this, she quickly began a mental search to find a strategy to solve the problem. Ultimately, she decided to flee the scene and then seek help as quickly as possible and take immediate action. At the same time, the person on the opposite side was thinking the same thing as her... There was such a scene in "Minecraft" where all the characters were controlled by artificial intelligence. Each of them has a unique identity setting. For example, the girl mentioned before is a 17-year-old but smart and brave courier. They have the ability to remember and think, and live like humans in this small town set in Minecraft. What drives them is a brand new,


