

CRPS: Scoring function for Bayesian machine learning models

Continuous Ranked Probability Score (CRPS) or "Continuous Ranked Probability Score" is a function or statistic that compares distribution predictions to true values.

#An important part of the machine learning workflow is model evaluation. The process itself can be considered common sense: split the data into training and test sets, train the model on the training set, and use a scoring function to evaluate its performance on the test set.
A scoring function (or metric) maps true values and their predictions to a single and comparable value [1]. For example, for continuous forecasting you can use scoring functions such as RMSE, MAE, MAPE, or R-squared. What if the forecast is not a point-by-point estimate, but a distribution?
In Bayesian machine learning, the prediction is usually not a point-by-point estimate, but a distribution of values. For example the predictions can be estimated parameters of a distribution, or in the non-parametric case, an array of samples from a MCMC method.
In this case, traditional scoring functions are not suitable for statistical designs; aggregation of predicted distributions into their mean or median values results in the loss of considerable information about the dispersion and shape of the predicted distributions.
CRPS
The Continuous Graded Probability Score (CRPS) is a fractional function that compares a single true value to a cumulative distribution function (CDF):

It was first introduced in the 1970s [4], mainly for weather forecasting, and is now receiving renewed attention in the literature and industry [1] [6]. It can be used as a metric to evaluate model performance when the target variable is continuous and the model predicts the distribution of the target; examples include Bayesian regression or Bayesian time series models [5].
CRPS is useful for both parametric and non-parametric predictions by using CDF: for many distributions, CRPS [3] has an analytical expression, and for non-parametric predictions, CRPS uses the empirical cumulative distribution function (eCDF) .
After calculating the CRPS for each observation in the test set, you also need to aggregate the results into a single value. Similar to RMSE and MAE, they are summarized using a (possibly weighted) mean:
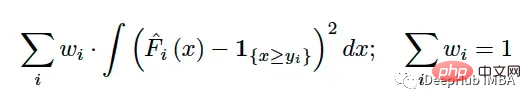
The main challenge in comparing a single value to a distribution is how the individual value Convert to a representation of distribution. CRPS solves this problem by converting the ground truth into a degenerate distribution with an indicator function. For example, if the true value is 7, we can use:
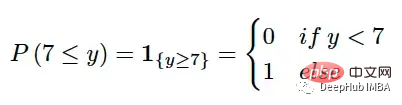
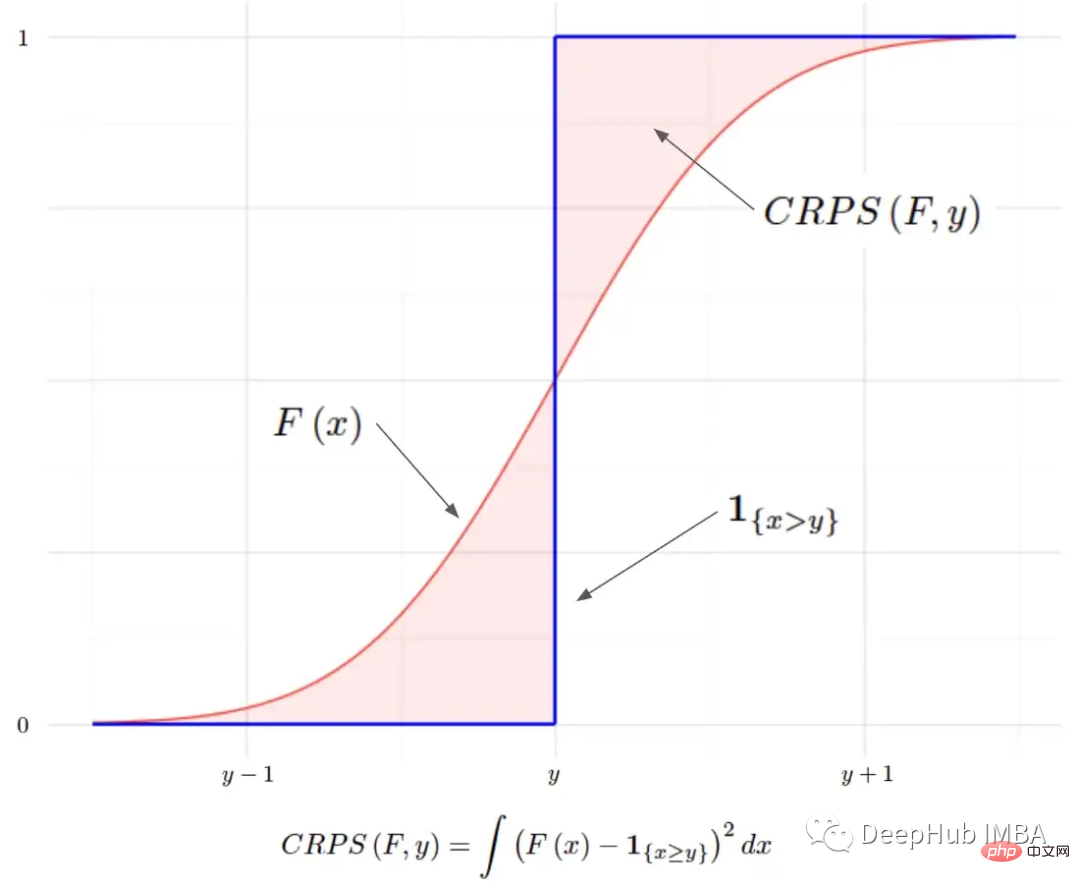
The indicator function is a valid CDF and can meet all the requirements of a CDF. The predicted distribution can then be compared with the degenerate distribution of the true values. We definitely want the predicted distribution to be as close to reality as possible; so this can be expressed mathematically by measuring the (squared) area between these two CDFs:
MAE to MAE relationship
CRPS is closely related to the famous MAE (Mean Absolute Error). If we use point-by-point prediction and treat it as a degenerate CDF and inject it into the CRPS equation, we can get:
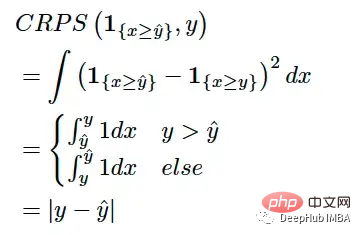
So if the prediction distribution is a degenerate distribution (such as point-by-point estimation), then CRPS will be reduced to MAE. This helps us understand CRPS from another perspective: it can be seen as generalizing MAE to the prediction of distributions, or that MAE is a special case of CRPS when the prediction distribution degenerates.
When the prediction of the model is a parametric distribution (for example, distribution parameters need to be predicted), CRPS has an analytical expression for some common distributions [3]. If the model predicts the parameters μ and σ of the normal distribution, the CRPS can be calculated using the following formula:

This solution can solve for known distributions such as Beta, Gamma, Logistic , lognormal distribution and others [3].
Computing the eCDF is a tedious task when the forecast is non-parametric, or more specifically - the forecast is a series of simulations. But CRPS can also be expressed as:

Where X, X' are F independent and identically distributed. These expressions are easier to compute, although they still require some computation.
Python implementation
import numpy as np


 # Adapted to numpy from pyro.ops.stats.crps_empirical
 # Copyright (c) 2017-2019 Uber Technologies, Inc.
 # SPDX-License-Identifier: Apache-2.0
 def crps(y_true, y_pred, sample_weight=None):
 num_samples = y_pred.shape[0]
 absolute_error = np.mean(np.abs(y_pred - y_true), axis=0)

 if num_samples == 1:
 return np.average(absolute_error, weights=sample_weight)

 y_pred = np.sort(y_pred, axis=0)
 diff = y_pred[1:] - y_pred[:-1]
 weight = np.arange(1, num_samples) * np.arange(num_samples - 1, 0, -1)
 weight = np.expand_dims(weight, -1)

 per_obs_crps = absolute_error - np.sum(diff * weight, axis=0) / num_samples**2
 return np.average(per_obs_crps, weights=sample_weight)
CRPS function implemented according to NRG form [2]. Adapted from pyroppl[6]
import numpy as np


 def crps(y_true, y_pred, sample_weight=None):
 num_samples = y_pred.shape[0]
 absolute_error = np.mean(np.abs(y_pred - y_true), axis=0)

 if num_samples == 1:
 return np.average(absolute_error, weights=sample_weight)

 y_pred = np.sort(y_pred, axis=0)
 b0 = y_pred.mean(axis=0)
 b1_values = y_pred * np.arange(num_samples).reshape((num_samples, 1))
 b1 = b1_values.mean(axis=0) / num_samples

 per_obs_crps = absolute_error + b0 - 2 * b1
 return np.average(per_obs_crps, weights=sample_weight)
The above code implements CRPS based on the PWM form[2].
Summary
Continuous Ranked Probability Score (CRPS) is a scoring function that compares a single true value to its predicted distribution. This property makes it relevant to Bayesian machine learning, where models typically output distribution predictions rather than point-wise estimates. It can be seen as a generalization of the well-known MAE for distribution prediction.
It has analytical expressions for parametric predictions and can perform simple calculations for non-parametric predictions. CRPS may become the new standard method for evaluating the performance of Bayesian machine learning models with continuous objectives.
The above is the detailed content of CRPS: Scoring function for Bayesian machine learning models. For more information, please follow other related articles on the PHP Chinese website!

Hot AI Tools

Undresser.AI Undress
AI-powered app for creating realistic nude photos

AI Clothes Remover
Online AI tool for removing clothes from photos.

Undress AI Tool
Undress images for free

Clothoff.io
AI clothes remover

AI Hentai Generator
Generate AI Hentai for free.

Hot Article
Hot Tools

Notepad++7.3.1
Easy-to-use and free code editor

SublimeText3 Chinese version
Chinese version, very easy to use

Zend Studio 13.0.1
Powerful PHP integrated development environment

Dreamweaver CS6
Visual web development tools

SublimeText3 Mac version
God-level code editing software (SublimeText3)
Hot Topics
 1377
1377
 52
52

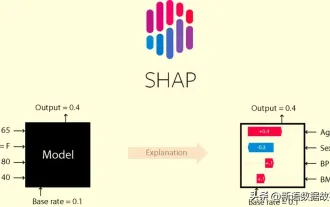 This article will take you to understand SHAP: model explanation for machine learning
Jun 01, 2024 am 10:58 AM
This article will take you to understand SHAP: model explanation for machine learning
Jun 01, 2024 am 10:58 AM
In the fields of machine learning and data science, model interpretability has always been a focus of researchers and practitioners. With the widespread application of complex models such as deep learning and ensemble methods, understanding the model's decision-making process has become particularly important. Explainable AI|XAI helps build trust and confidence in machine learning models by increasing the transparency of the model. Improving model transparency can be achieved through methods such as the widespread use of multiple complex models, as well as the decision-making processes used to explain the models. These methods include feature importance analysis, model prediction interval estimation, local interpretability algorithms, etc. Feature importance analysis can explain the decision-making process of a model by evaluating the degree of influence of the model on the input features. Model prediction interval estimate
 Implementing Machine Learning Algorithms in C++: Common Challenges and Solutions
Jun 03, 2024 pm 01:25 PM
Implementing Machine Learning Algorithms in C++: Common Challenges and Solutions
Jun 03, 2024 pm 01:25 PM
Common challenges faced by machine learning algorithms in C++ include memory management, multi-threading, performance optimization, and maintainability. Solutions include using smart pointers, modern threading libraries, SIMD instructions and third-party libraries, as well as following coding style guidelines and using automation tools. Practical cases show how to use the Eigen library to implement linear regression algorithms, effectively manage memory and use high-performance matrix operations.
 Explainable AI: Explaining complex AI/ML models
Jun 03, 2024 pm 10:08 PM
Explainable AI: Explaining complex AI/ML models
Jun 03, 2024 pm 10:08 PM
Translator | Reviewed by Li Rui | Chonglou Artificial intelligence (AI) and machine learning (ML) models are becoming increasingly complex today, and the output produced by these models is a black box – unable to be explained to stakeholders. Explainable AI (XAI) aims to solve this problem by enabling stakeholders to understand how these models work, ensuring they understand how these models actually make decisions, and ensuring transparency in AI systems, Trust and accountability to address this issue. This article explores various explainable artificial intelligence (XAI) techniques to illustrate their underlying principles. Several reasons why explainable AI is crucial Trust and transparency: For AI systems to be widely accepted and trusted, users need to understand how decisions are made
 Five schools of machine learning you don't know about
Jun 05, 2024 pm 08:51 PM
Five schools of machine learning you don't know about
Jun 05, 2024 pm 08:51 PM
Machine learning is an important branch of artificial intelligence that gives computers the ability to learn from data and improve their capabilities without being explicitly programmed. Machine learning has a wide range of applications in various fields, from image recognition and natural language processing to recommendation systems and fraud detection, and it is changing the way we live. There are many different methods and theories in the field of machine learning, among which the five most influential methods are called the "Five Schools of Machine Learning". The five major schools are the symbolic school, the connectionist school, the evolutionary school, the Bayesian school and the analogy school. 1. Symbolism, also known as symbolism, emphasizes the use of symbols for logical reasoning and expression of knowledge. This school of thought believes that learning is a process of reverse deduction, through existing
 Is Flash Attention stable? Meta and Harvard found that their model weight deviations fluctuated by orders of magnitude
May 30, 2024 pm 01:24 PM
Is Flash Attention stable? Meta and Harvard found that their model weight deviations fluctuated by orders of magnitude
May 30, 2024 pm 01:24 PM
MetaFAIR teamed up with Harvard to provide a new research framework for optimizing the data bias generated when large-scale machine learning is performed. It is known that the training of large language models often takes months and uses hundreds or even thousands of GPUs. Taking the LLaMA270B model as an example, its training requires a total of 1,720,320 GPU hours. Training large models presents unique systemic challenges due to the scale and complexity of these workloads. Recently, many institutions have reported instability in the training process when training SOTA generative AI models. They usually appear in the form of loss spikes. For example, Google's PaLM model experienced up to 20 loss spikes during the training process. Numerical bias is the root cause of this training inaccuracy,
 Machine Learning in C++: A Guide to Implementing Common Machine Learning Algorithms in C++
Jun 03, 2024 pm 07:33 PM
Machine Learning in C++: A Guide to Implementing Common Machine Learning Algorithms in C++
Jun 03, 2024 pm 07:33 PM
In C++, the implementation of machine learning algorithms includes: Linear regression: used to predict continuous variables. The steps include loading data, calculating weights and biases, updating parameters and prediction. Logistic regression: used to predict discrete variables. The process is similar to linear regression, but uses the sigmoid function for prediction. Support Vector Machine: A powerful classification and regression algorithm that involves computing support vectors and predicting labels.
 Complete collection of excel function formulas
May 07, 2024 pm 12:04 PM
Complete collection of excel function formulas
May 07, 2024 pm 12:04 PM
1. The SUM function is used to sum the numbers in a column or a group of cells, for example: =SUM(A1:J10). 2. The AVERAGE function is used to calculate the average of the numbers in a column or a group of cells, for example: =AVERAGE(A1:A10). 3. COUNT function, used to count the number of numbers or text in a column or a group of cells, for example: =COUNT(A1:A10) 4. IF function, used to make logical judgments based on specified conditions and return the corresponding result.
 Outlook on future trends of Golang technology in machine learning
May 08, 2024 am 10:15 AM
Outlook on future trends of Golang technology in machine learning
May 08, 2024 am 10:15 AM
The application potential of Go language in the field of machine learning is huge. Its advantages are: Concurrency: It supports parallel programming and is suitable for computationally intensive operations in machine learning tasks. Efficiency: The garbage collector and language features ensure that the code is efficient, even when processing large data sets. Ease of use: The syntax is concise, making it easy to learn and write machine learning applications.
