
 Backend Development
Python Tutorial
Share a popular Python visualization module, easy and quick to get started! !
Backend Development
Python Tutorial
Share a popular Python visualization module, easy and quick to get started! !
Share a popular Python visualization module, easy and quick to get started! !


What is Altair?
Altair is called a statistical visualization library because it can comprehensively understand, understand and analyze data through classification and aggregation, data transformation, data interaction, graphic composite, etc., and its installation process is also very simple. Simple, execute it directly through the pip command, as follows:
pip install altair
pip install vega_datasets
pip install altair_viewer
If you are using the conda package manager to install the Altair module, the code is as follows:
conda install -c conda-forge altair vega_datasets
First experience with Altair
Let's simply try to draw a histogram. First, create a DataFrame data set. The code is as follows:
df = pd.DataFrame({"brand":["iPhone","Xiaomi","HuaWei","Vivo"],
"profit(B)":[200,55,88,60]})The next step is the code for drawing the histogram:
import altair as alt
import pandas as pd
import altair_viewer
chart = alt.Chart(df).mark_bar().encode(x="brand:N",y="profit(B):Q")
# 展示数据,调用display()方法
altair_viewer.display(chart,inline=True)
output
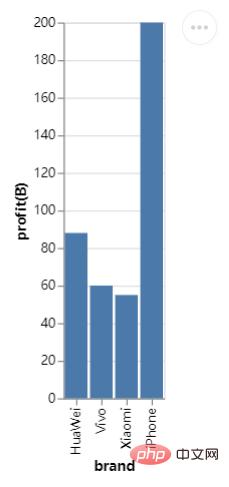
From the perspective of the entire syntax structure, first use alt.Chart() to specify the data set to be used, then use the instance method mark_*() to draw the chart style, and finally specify the X-axis and the data represented by the Y-axis. You may be curious about what N and Q represent respectively. This is the abbreviation of the variable type. In other words, the Altair module needs to understand the variable types involved in drawing graphics. Only In this way, the drawn graphics will be the effect we expect.
N represents a nominal variable (Nominal). For example, the brands of mobile phones are all proper nouns, while Q represents a numerical variable (Quantitative), which can be divided into discrete data. (discrete) and continuous data (continuous), in addition to time series data, the abbreviation is T and ordinal variables (O), for example, the rating of a merchant during the online shopping process has 1-5 stars. .
Saving the chart
To save the final chart, we can directly call the save() method to save the object as an HTML file. The code is as follows:
chart.save("chart.html")Also It can be saved as a JSON file, which is very similar from the code point of view.
chart.save("chart.json")Of course we can also save files in image format, as shown below:
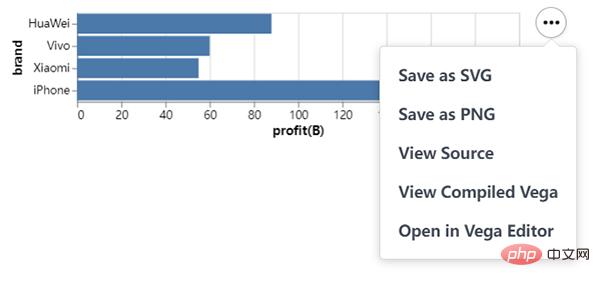
Advanced Operations of Altair
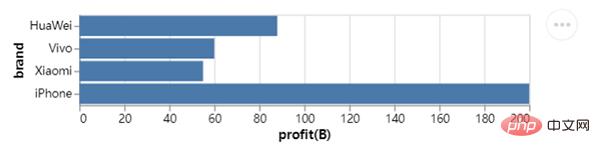
We On the basis of the above, further derivation and expansion, for example, we want to draw a horizontal bar chart and exchange data on the X-axis and Y-axis. The code is as follows:
chart = alt.Chart(df).mark_bar().encode(x="profit(B):Q", y="brand:N")
chart.save("chart1.html")output
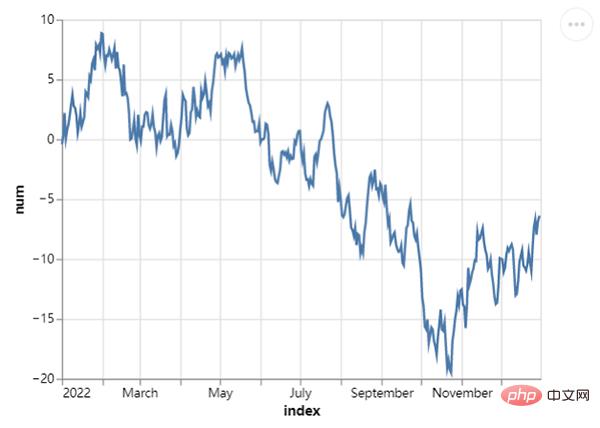
At the same time, we also try to draw a line chart. The mark_line() method is called and the code is as follows:
## 创建一组新的数据,以日期为行索引值
np.random.seed(29)
value = np.random.randn(365)
data = np.cumsum(value)
date = pd.date_range(start="20220101", end="20221231")
df = pd.DataFrame({"num": data}, index=date)
line_chart = alt.Chart(df.reset_index()).mark_line().encode(x="index:T", y="num:Q")
line_chart.save("chart2.html")output
We can also draw a Gantt chart, which is usually used more in project management. The X-axis adds time and date, while the Y-axis represents the progress of the project. Code As follows:
project = [{"project": "Proj1", "start_time": "2022-01-16", "end_time": "2022-03-20"},
{"project": "Proj2", "start_time": "2022-04-12", "end_time": "2022-11-20"},
......
]
df = alt.Data(values=project)
chart = alt.Chart(df).mark_bar().encode(
 alt.X("start_time:T",
 axis=alt.Axis(format="%x",
 formatType="time",
 tickCount=3),
 scale=alt.Scale(domain=[alt.DateTime(year=2022, month=1, date=1),
 alt.DateTime(year=2022, month=12, date=1)])),
 alt.X2("end_time:T"),
 alt.Y("project:N", axis=alt.Axis(labelAlign="left",
labelFontSize=15,
labelOffset=0,
labelPadding=50)),
 color=alt.Color("project:N", legend=alt.Legend(labelFontSize=12,
symbolOpacity=0.7,
titleFontSize=15)))
chart.save("chart_gantt.html")output
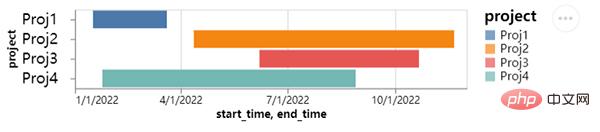
From the picture above, we can see several projects being worked on by the team. The progress of each project is different, of course. Well, the time span of different projects is also different, which is very intuitive when displayed on the chart.
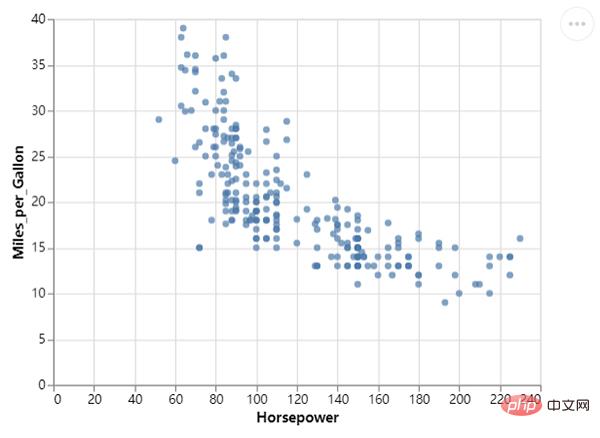
Next, we draw the scatter plot again, calling the mark_circle() method, the code is as follows:
df = data.cars()
## 筛选出地区是“USA”也就是美国的乘用车数据
df_1 = alt.Chart(df).transform_filter(
 alt.datum.Origin == "USA"
)
df = data.cars()
df_1 = alt.Chart(df).transform_filter(
 alt.datum.Origin == "USA"
)
chart = df_1.mark_circle().encode(
 alt.X("Horsepower:Q"),
 alt.Y("Miles_per_Gallon:Q")
)
chart.save("chart_dots.html")output
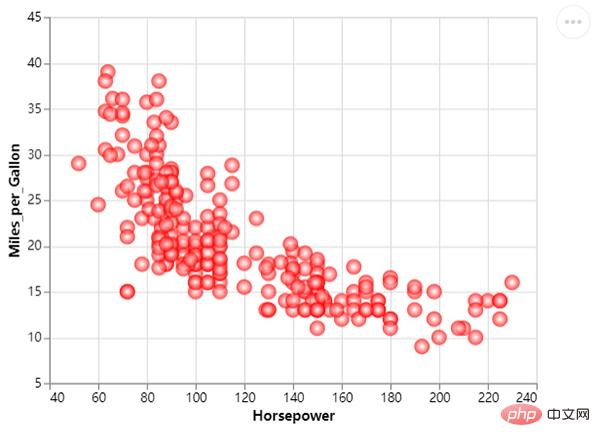
Of course, we can further optimize it to make the chart more beautiful and add some colors. The code is as follows:
chart = df_1.mark_circle(color=alt.RadialGradient("radial",[alt.GradientStop("white", 0.0),
alt.GradientStop("red", 1.0)]),
 size=160).encode(
 alt.X("Horsepower:Q", scale=alt.Scale(zero=False,padding=20)),
 alt.Y("Miles_per_Gallon:Q", scale=alt.Scale(zero=False,padding=20))
)output
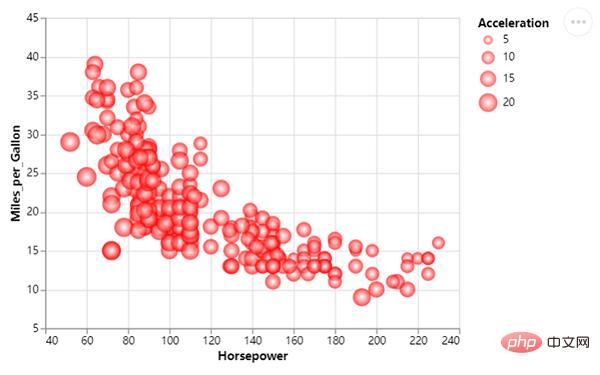
We change the scatter The size of the points. The sizes of different scatter points represent different values. The code is as follows:
chart = df_1.mark_circle(color=alt.RadialGradient("radial",[alt.GradientStop("white", 0.0),
alt.GradientStop("red", 1.0)]),
 size=160).encode(
 alt.X("Horsepower:Q", scale=alt.Scale(zero=False, padding=20)),
 alt.Y("Miles_per_Gallon:Q", scale=alt.Scale(zero=False, padding=20)),
 size="Acceleration:Q"
)output
The above is the detailed content of Share a popular Python visualization module, easy and quick to get started! !. For more information, please follow other related articles on the PHP Chinese website!

Hot AI Tools

Undresser.AI Undress
AI-powered app for creating realistic nude photos

AI Clothes Remover
Online AI tool for removing clothes from photos.

Undress AI Tool
Undress images for free

Clothoff.io
AI clothes remover

AI Hentai Generator
Generate AI Hentai for free.

Hot Article
Hot Tools

Notepad++7.3.1
Easy-to-use and free code editor

SublimeText3 Chinese version
Chinese version, very easy to use

Zend Studio 13.0.1
Powerful PHP integrated development environment

Dreamweaver CS6
Visual web development tools

SublimeText3 Mac version
God-level code editing software (SublimeText3)
Hot Topics
 1370
1370
 52
52

 What is the function of C language sum?
Apr 03, 2025 pm 02:21 PM
What is the function of C language sum?
Apr 03, 2025 pm 02:21 PM
There is no built-in sum function in C language, so it needs to be written by yourself. Sum can be achieved by traversing the array and accumulating elements: Loop version: Sum is calculated using for loop and array length. Pointer version: Use pointers to point to array elements, and efficient summing is achieved through self-increment pointers. Dynamically allocate array version: Dynamically allocate arrays and manage memory yourself, ensuring that allocated memory is freed to prevent memory leaks.
 Who gets paid more Python or JavaScript?
Apr 04, 2025 am 12:09 AM
Who gets paid more Python or JavaScript?
Apr 04, 2025 am 12:09 AM
There is no absolute salary for Python and JavaScript developers, depending on skills and industry needs. 1. Python may be paid more in data science and machine learning. 2. JavaScript has great demand in front-end and full-stack development, and its salary is also considerable. 3. Influencing factors include experience, geographical location, company size and specific skills.
 Is distinctIdistinguish related?
Apr 03, 2025 pm 10:30 PM
Is distinctIdistinguish related?
Apr 03, 2025 pm 10:30 PM
Although distinct and distinct are related to distinction, they are used differently: distinct (adjective) describes the uniqueness of things themselves and is used to emphasize differences between things; distinct (verb) represents the distinction behavior or ability, and is used to describe the discrimination process. In programming, distinct is often used to represent the uniqueness of elements in a collection, such as deduplication operations; distinct is reflected in the design of algorithms or functions, such as distinguishing odd and even numbers. When optimizing, the distinct operation should select the appropriate algorithm and data structure, while the distinct operation should optimize the distinction between logical efficiency and pay attention to writing clear and readable code.
 How to understand !x in C?
Apr 03, 2025 pm 02:33 PM
How to understand !x in C?
Apr 03, 2025 pm 02:33 PM
!x Understanding !x is a logical non-operator in C language. It booleans the value of x, that is, true changes to false, false changes to true. But be aware that truth and falsehood in C are represented by numerical values rather than boolean types, non-zero is regarded as true, and only 0 is regarded as false. Therefore, !x deals with negative numbers the same as positive numbers and is considered true.
 What does sum mean in C language?
Apr 03, 2025 pm 02:36 PM
What does sum mean in C language?
Apr 03, 2025 pm 02:36 PM
There is no built-in sum function in C for sum, but it can be implemented by: using a loop to accumulate elements one by one; using a pointer to access and accumulate elements one by one; for large data volumes, consider parallel calculations.
 Does H5 page production require continuous maintenance?
Apr 05, 2025 pm 11:27 PM
Does H5 page production require continuous maintenance?
Apr 05, 2025 pm 11:27 PM
The H5 page needs to be maintained continuously, because of factors such as code vulnerabilities, browser compatibility, performance optimization, security updates and user experience improvements. Effective maintenance methods include establishing a complete testing system, using version control tools, regularly monitoring page performance, collecting user feedback and formulating maintenance plans.
 How to obtain real-time application and viewer data on the 58.com work page?
Apr 05, 2025 am 08:06 AM
How to obtain real-time application and viewer data on the 58.com work page?
Apr 05, 2025 am 08:06 AM
How to obtain dynamic data of 58.com work page while crawling? When crawling a work page of 58.com using crawler tools, you may encounter this...
 Copy and paste Love code Copy and paste Love code for free
Apr 04, 2025 am 06:48 AM
Copy and paste Love code Copy and paste Love code for free
Apr 04, 2025 am 06:48 AM
Copying and pasting the code is not impossible, but it should be treated with caution. Dependencies such as environment, libraries, versions, etc. in the code may not match the current project, resulting in errors or unpredictable results. Be sure to ensure the context is consistent, including file paths, dependent libraries, and Python versions. Additionally, when copying and pasting the code for a specific library, you may need to install the library and its dependencies. Common errors include path errors, version conflicts, and inconsistent code styles. Performance optimization needs to be redesigned or refactored according to the original purpose and constraints of the code. It is crucial to understand and debug copied code, and do not copy and paste blindly.
