
 Technology peripherals
AI
Illustration of the top ten most commonly used machine learning algorithms!
Technology peripherals
AI
Illustration of the top ten most commonly used machine learning algorithms!
Illustration of the top ten most commonly used machine learning algorithms!

In the field of machine learning, there is a saying called "There is no free lunch in the world." In short, it means that no algorithm can have the best effect on every problem. This theory is Supervised learning is particularly important.
For example, you cannot say that neural networks are always better than decision trees, or vice versa. Model execution is influenced by many factors, such as the size and structure of the data set.
Therefore, you should try many different algorithms based on your problem, while using a test set of data to evaluate performance and pick the best one.
Of course, the algorithm you try must be relevant to your problem, and the key is the main task of machine learning. For example, if you wanted to clean your house, you might use a vacuum cleaner, a broom, or a mop, but you wouldn't grab a shovel and start digging a hole.
For newcomers to machine learning who are eager to understand the basics of machine learning, here are the top ten machine learning algorithms used by data scientists to introduce to you the characteristics of these top ten algorithms so that everyone can better understand and Application, come and take a look.
01 Linear Regression
Linear regression is probably one of the best-known and easiest-to-understand algorithms in statistics and machine learning.
Since predictive modeling is mainly concerned with minimizing the error of the model, or making the most accurate predictions at the expense of interpretability. We borrow, reuse, and steal algorithms from many different fields, and some statistical knowledge is involved.
Linear regression is represented by an equation that describes the linear relationship between the input variable (x) and the output variable (y) by finding the specific weight (B) of the input variable.
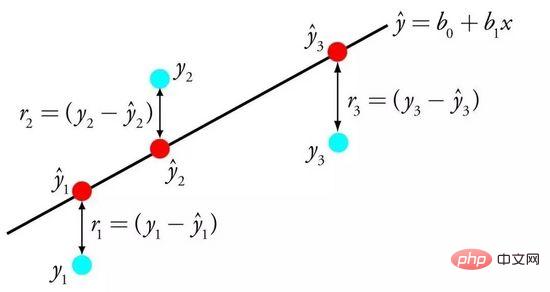
Linear Regression
Example: y = B0 B1 * x
Given input x, we will predict y, linear regression learning algorithm The goal is to find the values of coefficients B0 and B1.
Linear regression models can be learned from data using different techniques, such as linear algebra solutions for ordinary least squares and gradient descent optimization.
Linear regression has been around for over 200 years and has been extensively researched. Some rules of thumb when using this technique are to remove very similar (correlated) variables and remove noise from the data if possible. This is a quick and simple technique and a good first algorithm.
02 Logistic Regression
Logistic regression is another technique that machine learning borrows from the field of statistics. This is a special method for binary classification problems (problems with two class values).
Logistic regression is similar to linear regression in that the goal of both is to find the weight value of each input variable. Unlike linear regression, the predicted value of the output is transformed using a nonlinear function called the logistic function.
Logical functions look like a big S and can convert any value into the range of 0 to 1. This is useful because we can apply the corresponding rules to the output of the logistic function, classify the values into 0 and 1 (for example, if IF is less than 0.5, then output 1) and predict the class value.
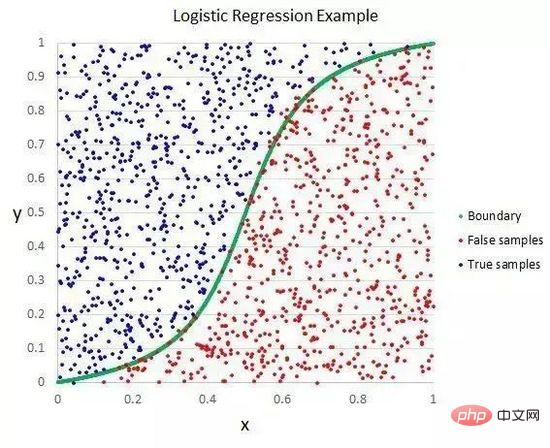
Logistic Regression
Due to the unique learning method of the model, predictions made through logistic regression can also be used to calculate the probability of belonging to class 0 or class 1 . This is useful for problems that require a lot of rationale.
Like linear regression, logistic regression does work better when you remove attributes that are not related to the output variable and attributes that are very similar (correlated) to each other. This is a model that quickly learns and effectively handles binary classification problems.
03 Linear discriminant analysis
Traditional logistic regression is limited to binary classification problems. If you have more than two classes, Linear Discriminant Analysis (LDA) is the preferred linear classification technique.
The representation of LDA is very simple. It consists of statistical properties of your data, calculated based on each category. For a single input variable, this includes:
The average value for each category.
The variance calculated across all categories.
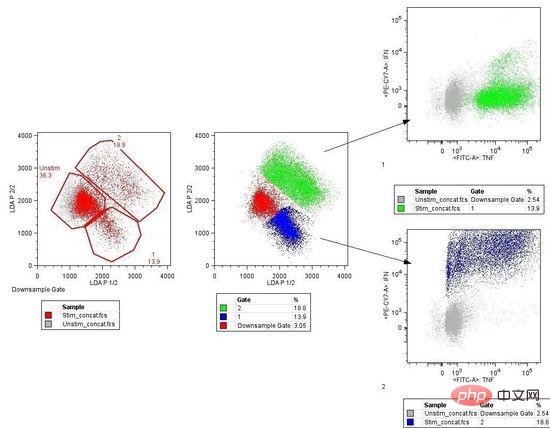
Linear Discriminant Analysis
LDA is performed by calculating the discriminant value of each class and making a prediction for the class with the maximum value. This technique assumes that the data has a Gaussian distribution (bell curve), so it is best to manually remove outliers from the data first. This is a simple yet powerful approach in classification predictive modeling problems.
04 Classification and Regression Tree
Decision tree is an important algorithm for machine learning.
The decision tree model can be represented by a binary tree. Yes, it is a binary tree from algorithms and data structures, nothing special. Each node represents a single input variable (x) and the left and right children of that variable (assuming the variables are numbers).
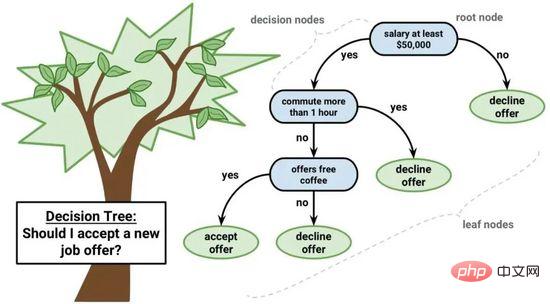
Decision Tree
The leaf nodes of the tree contain the output variables (y) used to make predictions. Prediction is performed by traversing the tree, stopping when a certain leaf node is reached, and outputting the class value of the leaf node.
Decision trees have fast learning speed and fast prediction speed. Predictions are often accurate for many problems, and you don't need to do any special preparation for the data.
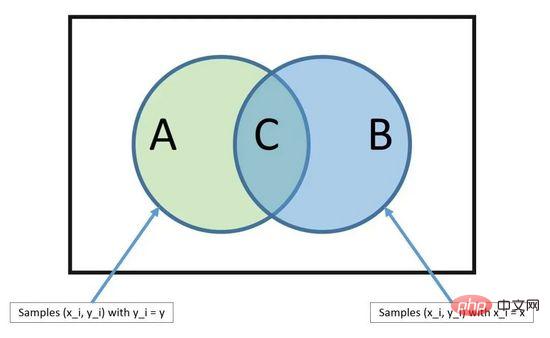
05 Naive Bayes
Naive Bayes is a simple but extremely powerful predictive modeling algorithm.
The model consists of two types of probabilities that can be calculated directly from your training data: 1) the probability of each class; 2) the conditional probability of the class given each x value. Once calculated, the probabilistic model can be used to make predictions on new data using Bayes' theorem. When your data is numerical, it is common to assume a Gaussian distribution (bell curve) so that these probabilities can be easily estimated.
Bayes Theorem
The reason why Naive Bayes is called naive is that it assumes that each input variable is independent. This is a strong assumption that is unrealistic for real data, but the technique is still very effective for complex problems on a large scale.
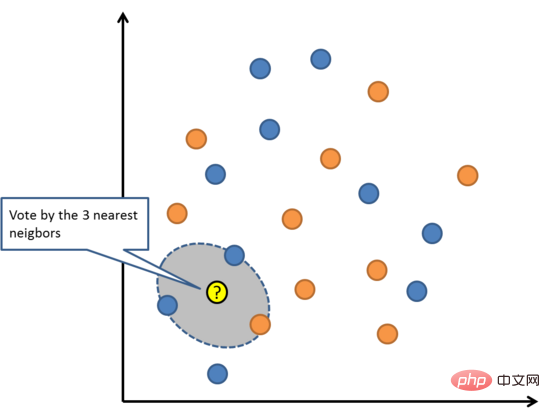
06 K Nearest Neighbor
The KNN algorithm is very simple and very effective. The model of KNN is represented by the entire training data set. Isn’t it very simple?
Predict new data points by searching for the K most similar instances (neighbors) in the entire training set and summarizing the output variables of these K instances. For regression problems, the new points may be the mean output variable, and for classification problems, the new points may be the mode category value.
The secret to success lies in how to determine the similarities between data instances. If your attributes are all on the same scale, the easiest way is to use Euclidean distance, which can be calculated directly from the difference between each input variable.
K-Nearest Neighbors
KNN may require a lot of memory or space to store all the data, but calculations are only performed when predictions are needed ( or study). You can also update and manage your training set at any time to maintain prediction accuracy.
The concept of distance or closeness may break down in a high-dimensional environment (large number of input variables), which can negatively impact the algorithm. Such events are known as dimensional curses. It also implies that you should only use those input variables that are most relevant to predicting the output variable.
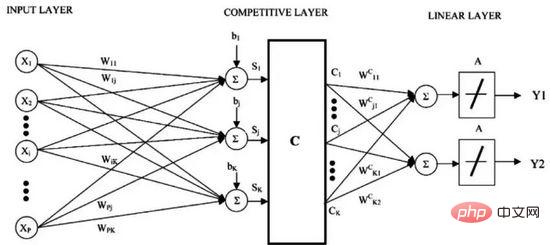
07 Learning Vector Quantization
The disadvantage of K-nearest neighbors is that you need to maintain the entire training data set. Learning Vector Quantization (or LVQ for short) is an artificial neural network algorithm that allows you to suspend any number of training instances and learn them accurately.
Learning Vector Quantization
LVQ is represented by a collection of codebook vectors. Start by randomly selecting vectors and then iterate multiple times to adapt to the training data set. After learning, the codebook vector can be used for prediction like K-nearest neighbors. Find the most similar neighbor (best match) by calculating the distance between each codebook vector and the new data instance, then return the class value of the best matching unit or the actual value in the case of regression as the prediction. Best results are obtained if you restrict the data to the same range (e.g. between 0 and 1).
If you find that KNN gives good results on your dataset, try using LVQ to reduce the memory requirements of storing the entire training dataset.
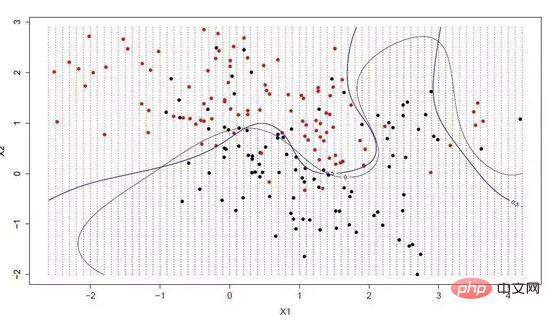
08 Support Vector Machine
Support vector machine is perhaps one of the most popular and discussed machine learning algorithms.
Hyperplane is the line that divides the input variable space. In SVM, a hyperplane is selected to separate points in the input variable space according to their categories (category 0 or category 1). It can be regarded as a line in two-dimensional space, and all input points can be completely separated by this line. The SVM learning algorithm is to find the coefficients that allow the hyperplane to best separate the categories.
Support Vector Machine
The distance between the hyperplane and the nearest data point is called the boundary. The hyperplane with the largest boundary is the best choice. At the same time, only these close data points are related to the definition of the hyperplane and the construction of the classifier. These points are called support vectors, and they support or define the hyperplane. In specific practice, we will use optimization algorithms to find coefficient values that maximize the boundary.
SVM is probably one of the most powerful out-of-the-box classifiers and is worth trying on your dataset.
09 bagging and random forest
Random forest is one of the most popular and powerful machine learning algorithms. It is an integrated machine learning algorithm called Bootstrap Aggregation or Bagging.
Bootstrap is a powerful statistical method for estimating a quantity, such as the mean, from a sample of data. It takes a large number of sample data, calculates the average, and then averages all the averages to get a more accurate estimate of the true average.
The same method is used in bagging, but the decision tree is most commonly used instead of estimating the entire statistical model. It multisamples the training data and then builds a model for each data sample. When you need to make a prediction on new data, each model makes a prediction and averages the predictions to get a better estimate of the true output value.
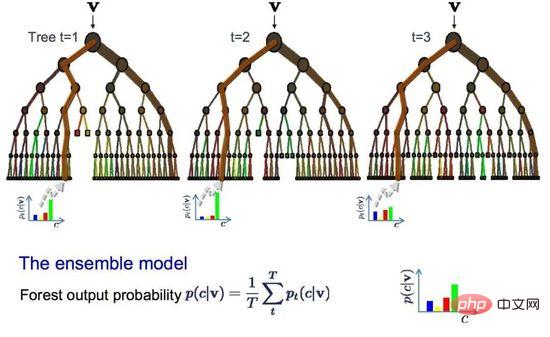
Random Forest
Random forest is an adjustment to the decision tree. Compared with selecting the best split point, random forest is achieved by introducing randomness Suboptimal segmentation.
As a result, the models created for each data sample will be more different from each other, but still accurate in their own sense. Combining prediction results provides a better estimate of the correct potential output value.
If you get good results using high-variance algorithms (such as decision trees), then adding this algorithm will give even better results.
10 Boosting and AdaBoost
Boosting is an ensemble technique that creates a strong classifier from some weak classifiers. It first builds a model from the training data and then creates a second model to try to correct the errors of the first model. Continuously add models until the training set predicts perfectly or has been added to the upper limit.
AdaBoost is the first truly successful Boosting algorithm developed for binary classification, and it is also the best starting point for understanding Boosting. The most famous algorithm currently built based on AdaBoost is stochastic gradient boosting.
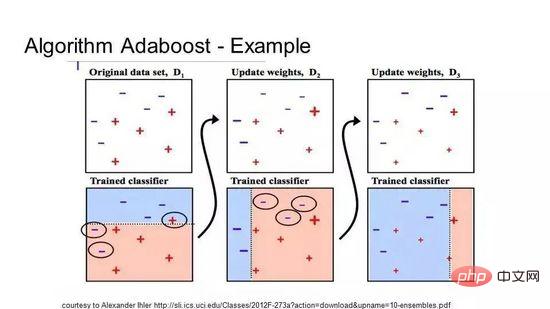
AdaBoost
AdaBoost is often used with short decision trees. After the first tree is created, the performance of each training instance on the tree determines how much attention the next tree needs to devote to that training instance. Training data that is difficult to predict is given more weight, while instances that are easy to predict are given less weight. Models are created sequentially, and each model update affects the learning effect of the next tree in the sequence. After all the trees are built, the algorithm makes predictions on new data and weights the performance of each tree by how accurate it was on the training data.
Because the algorithm attaches great importance to error correction, a clean data without outliers is very important.
A typical question asked by beginners when faced with the various machine learning algorithms is "Which algorithm should I use?" The answer to this question depends on many factors, including:
- The size, quality, and nature of the data;
- Available computing time;
- The urgency of the task;
- What you want to do with the data.
Even an experienced data scientist has no way of knowing which algorithm will perform best until he tries different algorithms. Although there are many other machine learning algorithms, these algorithms are the most popular. If you are new to machine learning, this is a great place to start.
The above is the detailed content of Illustration of the top ten most commonly used machine learning algorithms!. For more information, please follow other related articles on the PHP Chinese website!

Hot AI Tools

Undresser.AI Undress
AI-powered app for creating realistic nude photos

AI Clothes Remover
Online AI tool for removing clothes from photos.

Undress AI Tool
Undress images for free

Clothoff.io
AI clothes remover

Video Face Swap
Swap faces in any video effortlessly with our completely free AI face swap tool!

Hot Article
Hot Tools

Notepad++7.3.1
Easy-to-use and free code editor

SublimeText3 Chinese version
Chinese version, very easy to use

Zend Studio 13.0.1
Powerful PHP integrated development environment

Dreamweaver CS6
Visual web development tools

SublimeText3 Mac version
God-level code editing software (SublimeText3)
Hot Topics
 1387
1387
 52
52

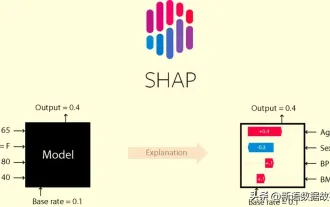 This article will take you to understand SHAP: model explanation for machine learning
Jun 01, 2024 am 10:58 AM
This article will take you to understand SHAP: model explanation for machine learning
Jun 01, 2024 am 10:58 AM
In the fields of machine learning and data science, model interpretability has always been a focus of researchers and practitioners. With the widespread application of complex models such as deep learning and ensemble methods, understanding the model's decision-making process has become particularly important. Explainable AI|XAI helps build trust and confidence in machine learning models by increasing the transparency of the model. Improving model transparency can be achieved through methods such as the widespread use of multiple complex models, as well as the decision-making processes used to explain the models. These methods include feature importance analysis, model prediction interval estimation, local interpretability algorithms, etc. Feature importance analysis can explain the decision-making process of a model by evaluating the degree of influence of the model on the input features. Model prediction interval estimate
 Implementing Machine Learning Algorithms in C++: Common Challenges and Solutions
Jun 03, 2024 pm 01:25 PM
Implementing Machine Learning Algorithms in C++: Common Challenges and Solutions
Jun 03, 2024 pm 01:25 PM
Common challenges faced by machine learning algorithms in C++ include memory management, multi-threading, performance optimization, and maintainability. Solutions include using smart pointers, modern threading libraries, SIMD instructions and third-party libraries, as well as following coding style guidelines and using automation tools. Practical cases show how to use the Eigen library to implement linear regression algorithms, effectively manage memory and use high-performance matrix operations.
 Five schools of machine learning you don't know about
Jun 05, 2024 pm 08:51 PM
Five schools of machine learning you don't know about
Jun 05, 2024 pm 08:51 PM
Machine learning is an important branch of artificial intelligence that gives computers the ability to learn from data and improve their capabilities without being explicitly programmed. Machine learning has a wide range of applications in various fields, from image recognition and natural language processing to recommendation systems and fraud detection, and it is changing the way we live. There are many different methods and theories in the field of machine learning, among which the five most influential methods are called the "Five Schools of Machine Learning". The five major schools are the symbolic school, the connectionist school, the evolutionary school, the Bayesian school and the analogy school. 1. Symbolism, also known as symbolism, emphasizes the use of symbols for logical reasoning and expression of knowledge. This school of thought believes that learning is a process of reverse deduction, through existing
 Explainable AI: Explaining complex AI/ML models
Jun 03, 2024 pm 10:08 PM
Explainable AI: Explaining complex AI/ML models
Jun 03, 2024 pm 10:08 PM
Translator | Reviewed by Li Rui | Chonglou Artificial intelligence (AI) and machine learning (ML) models are becoming increasingly complex today, and the output produced by these models is a black box – unable to be explained to stakeholders. Explainable AI (XAI) aims to solve this problem by enabling stakeholders to understand how these models work, ensuring they understand how these models actually make decisions, and ensuring transparency in AI systems, Trust and accountability to address this issue. This article explores various explainable artificial intelligence (XAI) techniques to illustrate their underlying principles. Several reasons why explainable AI is crucial Trust and transparency: For AI systems to be widely accepted and trusted, users need to understand how decisions are made
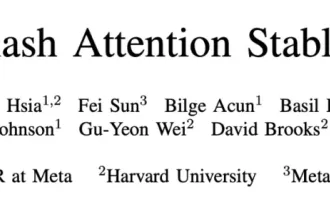 Is Flash Attention stable? Meta and Harvard found that their model weight deviations fluctuated by orders of magnitude
May 30, 2024 pm 01:24 PM
Is Flash Attention stable? Meta and Harvard found that their model weight deviations fluctuated by orders of magnitude
May 30, 2024 pm 01:24 PM
MetaFAIR teamed up with Harvard to provide a new research framework for optimizing the data bias generated when large-scale machine learning is performed. It is known that the training of large language models often takes months and uses hundreds or even thousands of GPUs. Taking the LLaMA270B model as an example, its training requires a total of 1,720,320 GPU hours. Training large models presents unique systemic challenges due to the scale and complexity of these workloads. Recently, many institutions have reported instability in the training process when training SOTA generative AI models. They usually appear in the form of loss spikes. For example, Google's PaLM model experienced up to 20 loss spikes during the training process. Numerical bias is the root cause of this training inaccuracy,
 Improved detection algorithm: for target detection in high-resolution optical remote sensing images
Jun 06, 2024 pm 12:33 PM
Improved detection algorithm: for target detection in high-resolution optical remote sensing images
Jun 06, 2024 pm 12:33 PM
01 Outlook Summary Currently, it is difficult to achieve an appropriate balance between detection efficiency and detection results. We have developed an enhanced YOLOv5 algorithm for target detection in high-resolution optical remote sensing images, using multi-layer feature pyramids, multi-detection head strategies and hybrid attention modules to improve the effect of the target detection network in optical remote sensing images. According to the SIMD data set, the mAP of the new algorithm is 2.2% better than YOLOv5 and 8.48% better than YOLOX, achieving a better balance between detection results and speed. 02 Background & Motivation With the rapid development of remote sensing technology, high-resolution optical remote sensing images have been used to describe many objects on the earth’s surface, including aircraft, cars, buildings, etc. Object detection in the interpretation of remote sensing images
 Machine Learning in C++: A Guide to Implementing Common Machine Learning Algorithms in C++
Jun 03, 2024 pm 07:33 PM
Machine Learning in C++: A Guide to Implementing Common Machine Learning Algorithms in C++
Jun 03, 2024 pm 07:33 PM
In C++, the implementation of machine learning algorithms includes: Linear regression: used to predict continuous variables. The steps include loading data, calculating weights and biases, updating parameters and prediction. Logistic regression: used to predict discrete variables. The process is similar to linear regression, but uses the sigmoid function for prediction. Support Vector Machine: A powerful classification and regression algorithm that involves computing support vectors and predicting labels.
 Application of algorithms in the construction of 58 portrait platform
May 09, 2024 am 09:01 AM
Application of algorithms in the construction of 58 portrait platform
May 09, 2024 am 09:01 AM
1. Background of the Construction of 58 Portraits Platform First of all, I would like to share with you the background of the construction of the 58 Portrait Platform. 1. The traditional thinking of the traditional profiling platform is no longer enough. Building a user profiling platform relies on data warehouse modeling capabilities to integrate data from multiple business lines to build accurate user portraits; it also requires data mining to understand user behavior, interests and needs, and provide algorithms. side capabilities; finally, it also needs to have data platform capabilities to efficiently store, query and share user profile data and provide profile services. The main difference between a self-built business profiling platform and a middle-office profiling platform is that the self-built profiling platform serves a single business line and can be customized on demand; the mid-office platform serves multiple business lines, has complex modeling, and provides more general capabilities. 2.58 User portraits of the background of Zhongtai portrait construction
