
 Backend Development
Python Tutorial
Don't know how to make charts? Ten Python data visualization libraries to help you!
Backend Development
Python Tutorial
Don't know how to make charts? Ten Python data visualization libraries to help you!
Don't know how to make charts? Ten Python data visualization libraries to help you!


1. matplotlib
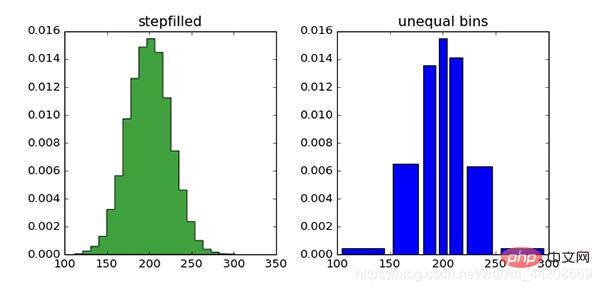
Two histograms
matplotlib is the leader of Python visualization libraries. After more than ten years, it is still the most commonly used drawing library for Python users. Its design is very close to MATLAB, a commercial programming language designed in the 1980s.
Since matplotlib is the first Python visualization library, there are many other libraries built on it or calling it directly.
For example, pandas and Seaborn are outsourcing of matplotlib. They allow you to call matplotlib methods with less code.
Although matplotlib can be used to easily obtain general information about the data, it is not so easy to quickly and easily create charts for publication.
As Chris Moffitt mentioned in "Introduction to Python Visualization Tools": "It is very powerful and very complex."
matplotlib has a strong default function of the 1990s. The style of the pictures has also been complained about for many years. The upcoming release of matplotlib 2.0 is said to include many more fashionable styles.
Developer: John D. Hunter
More information:https://www.php.cn/link/a563b6d5abbf137175059d6bb14672cc
2. Seaborn
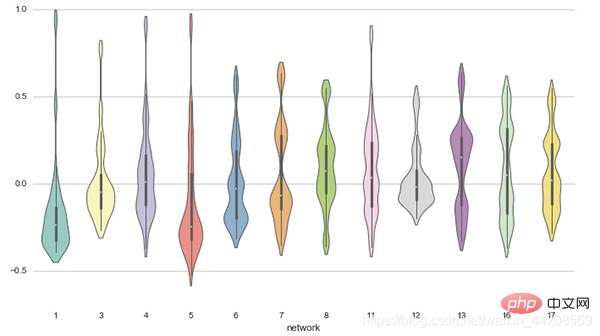
Violinplot (Michael Waskom)
Seaborn uses matplotlib to create beautiful charts with simple code.
The biggest difference between Seaborn and matplotlib is that its default drawing style and color matching have a modern aesthetic.
Since Seaborn is built on matplotlib, you need to understand matplotlib to adjust Seaborn's default parameters.
Developer: Michael Waskom
More information:https://www.php.cn/link/b93f11867481fc6d77908aea58ba6198
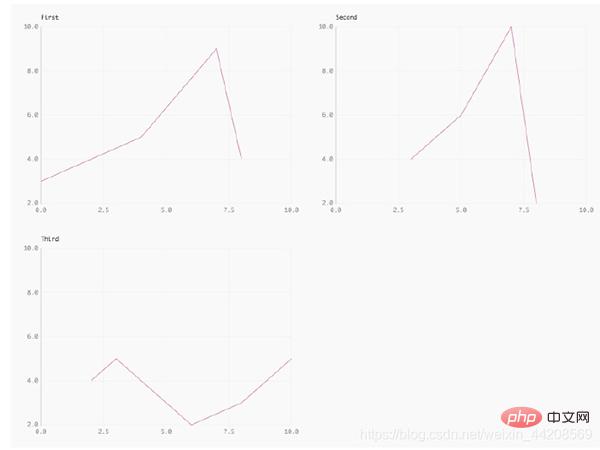
3. ggplot
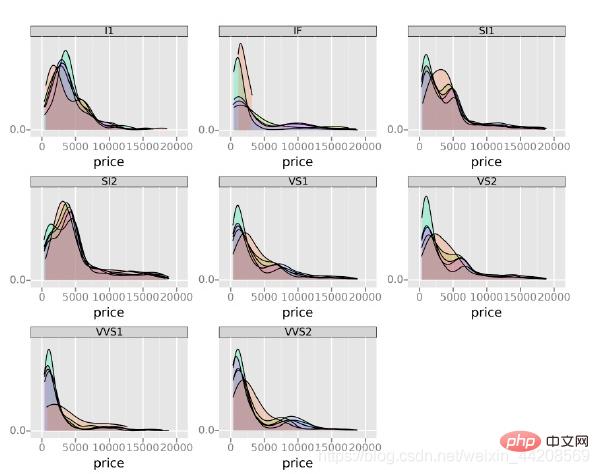
Small multiples (ŷhat)
ggplot is a plotting package based on R, ggplot2, and also uses the source of "Image Grammar" ( Concepts in The Grammar of Graphics.
The difference between ggplot and matplotlib is that it allows you to overlay different layers to complete a picture. For example you can start with the axis, then add points, add lines, trend lines, etc.
Although "Image Grammar" has been praised as a drawing method that is "close to the thinking process", users who are accustomed to matplotlib may need some time to adapt to this new way of thinking.
The author of ggplot mentioned that ggplot is not suitable for making very personalized images. It sacrifices image complexity for operational simplicity.
ggplot is tightly integrated with pandas, so it's best to store your data in a DataFrame when using ggplot.
ggplot is tightly integrated with pandas, so when you use it, It's better to read your data into a DataFrame.
Developer: ŷhat
More information:https://www.php.cn/link/be23c41621390a448779ee72409e5f49
4. Bokeh
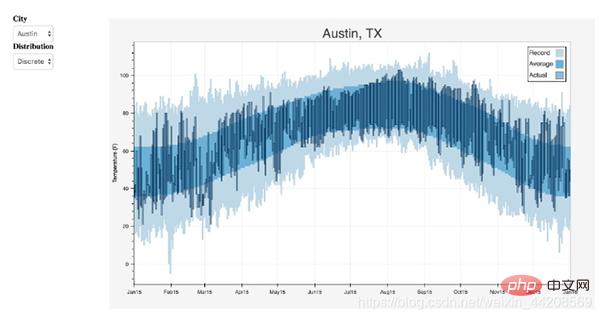
Interactive weather statistics for three cities (Continuum Analytics)
Like ggplot, Bokeh is also based on the concept of "Graphic Grammar".
But unlike ggplot, it is completely based on Python and not referenced from R.
Its advantage is that it can be used to create interactive charts that can be used directly on the network. Charts can be output as JSON objects, HTML documents or interactive web applications.
Boken also supports data streaming and real-time data. Bokeh offers three levels of control for different users.
The highest level of control is used for quick graphing, mainly for making common images, such as histograms, box plots, and histograms.
The medium level of control allows you to control basic elements of the image (such as points in a distribution plot) just like matplotlib.
The lowest level of control is primarily intended for developers and software engineers.
It has no default value, you have to define each element of the chart.
Developer: Continuum Analytics
More information:https://www.php.cn/link/fdad3b5b2200b598dfde9517e5b426a8
5, pygal
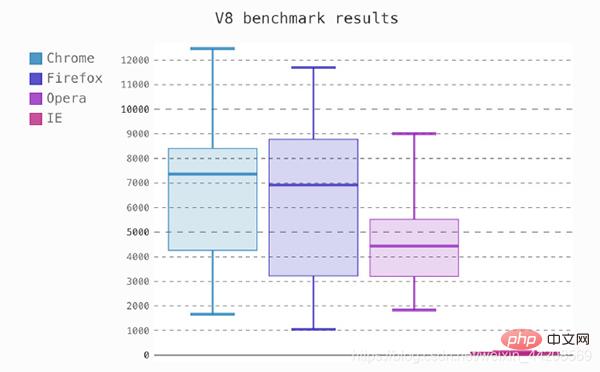
Box plot (Florian Mounier)
pygal, like Bokeh and Plotly, provides interactive graphics that can be embedded directly into the web browser.
The main difference from the other two is that it can output charts into SVG format.
If your data size is relatively small, SVG is enough. But if you have hundreds or thousands of data points, the SVG rendering process will become very slow.
Since all charts are encapsulated into methods, and the default style is also very beautiful, you can easily create beautiful charts with a few lines of code.
Developer: Florian Mounier
More information:https://www.php.cn/link/bf5d232e6c54a84b97769a91adb1642f
6. Plotly
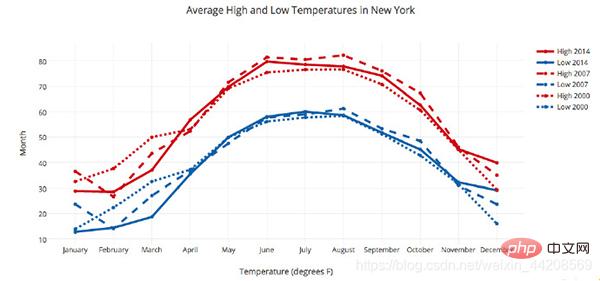
Line plot (Plotly)
You may have heard of the online graphing tool Plotly, but did you know you can use it through Python? ?
Plotly is dedicated to the production of interactive charts like Bokeh, but it provides several chart types that are difficult to find in other libraries, such as contour plots, tree plots, and three-dimensional charts.
Developer: Plotly
More information:https://www.php.cn/link/d01c25576ff1c53de58e0e6970a2d510
7. geoplotlib
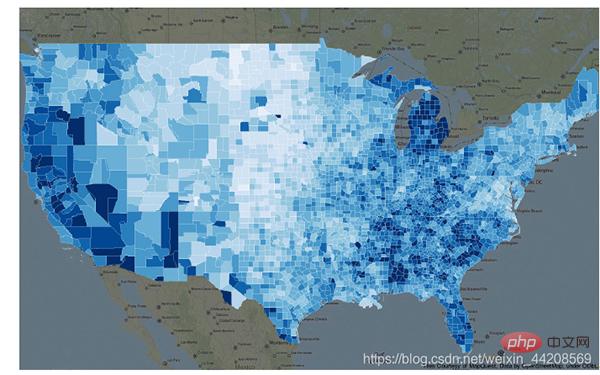
Choropleth (Andrea Cuttone)
geoplotlib is a toolbox for producing maps and geographically related data.
You can use it to create a variety of maps, such as contour maps, heat maps, and point density maps.
You must install Pyglet (an object-oriented programming interface) to use geoplotlib. However, since most Python visualization tools do not provide maps, it is quite convenient to have a tool dedicated to drawing maps.
Developer: Andrea Cuttone
More information:https://www.php.cn/link/a9cf46a38a9b05e959f33215e5cdc38a
8, Gleam
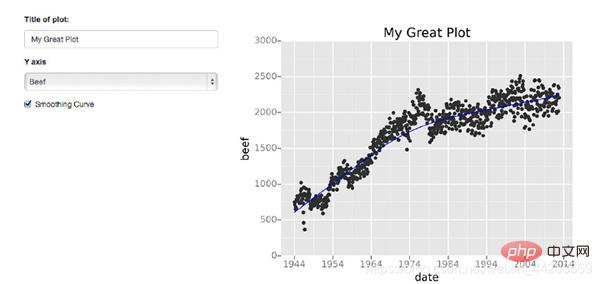
Scatter plot with trend line (David Robinson)
Gleam borrows the inspiration of Shiny in R. It allows you to turn your analysis into an interactive web application using only Python programs. You don't need to know HTML CSS or JavaScript.
Gleam can use any Python visualization library.
When you create a chart, you can add a field to it so users can use it to sort and filter the data.
Developer: David Robinson
More information:https://www.php.cn/link/c0ad6deb373037e7f63f219c850e3396
9. missingno
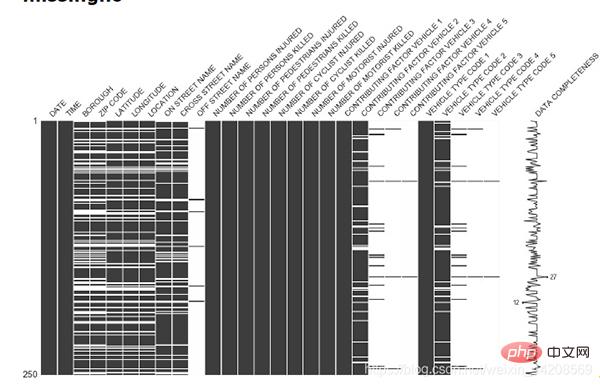
Nullity matrix (Aleksey Bilogur)
Missing data is forever painful.
missingno uses images to quickly assess the situation of missing data, instead of wading through the data table.
You can sort or filter the data based on its completeness, or consider correcting the data based on the heat map or tree map.
Developer: Aleksey Bilogur
More information:https://www.php.cn/link/bc05ca60f2f0d67d0525f41d1d8f8717
10、Leather

The best definition of Leather comes from its author Christopher Groskopf.
"Leather is for people who need a chart now and don't care if the chart is perfect."
It can be used with all data types and generates SVG images, so that when you adjust Image size is increased without losing image quality.
The above is the detailed content of Don't know how to make charts? Ten Python data visualization libraries to help you!. For more information, please follow other related articles on the PHP Chinese website!

Hot AI Tools

Undresser.AI Undress
AI-powered app for creating realistic nude photos

AI Clothes Remover
Online AI tool for removing clothes from photos.

Undress AI Tool
Undress images for free

Clothoff.io
AI clothes remover

Video Face Swap
Swap faces in any video effortlessly with our completely free AI face swap tool!

Hot Article
Hot Tools

Notepad++7.3.1
Easy-to-use and free code editor

SublimeText3 Chinese version
Chinese version, very easy to use

Zend Studio 13.0.1
Powerful PHP integrated development environment

Dreamweaver CS6
Visual web development tools

SublimeText3 Mac version
God-level code editing software (SublimeText3)
Hot Topics
 1386
1386
 52
52

 Can vs code run in Windows 8
Apr 15, 2025 pm 07:24 PM
Can vs code run in Windows 8
Apr 15, 2025 pm 07:24 PM
VS Code can run on Windows 8, but the experience may not be great. First make sure the system has been updated to the latest patch, then download the VS Code installation package that matches the system architecture and install it as prompted. After installation, be aware that some extensions may be incompatible with Windows 8 and need to look for alternative extensions or use newer Windows systems in a virtual machine. Install the necessary extensions to check whether they work properly. Although VS Code is feasible on Windows 8, it is recommended to upgrade to a newer Windows system for a better development experience and security.
 How to run programs in terminal vscode
Apr 15, 2025 pm 06:42 PM
How to run programs in terminal vscode
Apr 15, 2025 pm 06:42 PM
In VS Code, you can run the program in the terminal through the following steps: Prepare the code and open the integrated terminal to ensure that the code directory is consistent with the terminal working directory. Select the run command according to the programming language (such as Python's python your_file_name.py) to check whether it runs successfully and resolve errors. Use the debugger to improve debugging efficiency.
 Can visual studio code be used in python
Apr 15, 2025 pm 08:18 PM
Can visual studio code be used in python
Apr 15, 2025 pm 08:18 PM
VS Code can be used to write Python and provides many features that make it an ideal tool for developing Python applications. It allows users to: install Python extensions to get functions such as code completion, syntax highlighting, and debugging. Use the debugger to track code step by step, find and fix errors. Integrate Git for version control. Use code formatting tools to maintain code consistency. Use the Linting tool to spot potential problems ahead of time.
 Is the vscode extension malicious?
Apr 15, 2025 pm 07:57 PM
Is the vscode extension malicious?
Apr 15, 2025 pm 07:57 PM
VS Code extensions pose malicious risks, such as hiding malicious code, exploiting vulnerabilities, and masturbating as legitimate extensions. Methods to identify malicious extensions include: checking publishers, reading comments, checking code, and installing with caution. Security measures also include: security awareness, good habits, regular updates and antivirus software.
 Python: Automation, Scripting, and Task Management
Apr 16, 2025 am 12:14 AM
Python: Automation, Scripting, and Task Management
Apr 16, 2025 am 12:14 AM
Python excels in automation, scripting, and task management. 1) Automation: File backup is realized through standard libraries such as os and shutil. 2) Script writing: Use the psutil library to monitor system resources. 3) Task management: Use the schedule library to schedule tasks. Python's ease of use and rich library support makes it the preferred tool in these areas.
 What is vscode What is vscode for?
Apr 15, 2025 pm 06:45 PM
What is vscode What is vscode for?
Apr 15, 2025 pm 06:45 PM
VS Code is the full name Visual Studio Code, which is a free and open source cross-platform code editor and development environment developed by Microsoft. It supports a wide range of programming languages and provides syntax highlighting, code automatic completion, code snippets and smart prompts to improve development efficiency. Through a rich extension ecosystem, users can add extensions to specific needs and languages, such as debuggers, code formatting tools, and Git integrations. VS Code also includes an intuitive debugger that helps quickly find and resolve bugs in your code.
 Golang vs. Python: Concurrency and Multithreading
Apr 17, 2025 am 12:20 AM
Golang vs. Python: Concurrency and Multithreading
Apr 17, 2025 am 12:20 AM
Golang is more suitable for high concurrency tasks, while Python has more advantages in flexibility. 1.Golang efficiently handles concurrency through goroutine and channel. 2. Python relies on threading and asyncio, which is affected by GIL, but provides multiple concurrency methods. The choice should be based on specific needs.
 Python vs. JavaScript: The Learning Curve and Ease of Use
Apr 16, 2025 am 12:12 AM
Python vs. JavaScript: The Learning Curve and Ease of Use
Apr 16, 2025 am 12:12 AM
Python is more suitable for beginners, with a smooth learning curve and concise syntax; JavaScript is suitable for front-end development, with a steep learning curve and flexible syntax. 1. Python syntax is intuitive and suitable for data science and back-end development. 2. JavaScript is flexible and widely used in front-end and server-side programming.
