 Backend Development
 Python Tutorial
 I used Python to crawl my WeChat friends, they are like this...
I used Python to crawl my WeChat friends, they are like this...

With the popularity of WeChat, more and more people are starting to use WeChat. WeChat has gradually transformed from a simple social software to a way of life. People need WeChat for daily communication, and WeChat is also needed for work communication. Every friend in WeChat represents a different role that people play in society.

Today’s article will conduct data analysis on WeChat friends based on Python. The main dimensions selected here are: gender, avatar, signature, location, mainly using charts and word clouds The results are presented in two forms. Among them, word frequency analysis and sentiment analysis are used for text information. As the saying goes: If a worker wants to do his job well, he must first sharpen his tools. Before officially starting this article, let me briefly introduce the third-party modules used in this article:
itchat: WeChat web version interface encapsulates the Python version, which is used in this article to obtain WeChat friend information.
jieba: The Python version of stuttering word segmentation, used in this article to segment text information.
matplotlib: a chart drawing module in Python, used in this article to draw column charts and pie charts
snownlp: a Chinese word segmentation module in Python, used in this article to analyze text information Make emotional judgments.
PIL: The image processing module in Python is used in this article to process images.
numpy: Numerical calculation module in Python, used in conjunction with the wordcloud module in this article.
wordcloud: The word cloud module in Python is used in this article to draw word cloud pictures.
TencentYoutuyun: The Python version SDK provided by Tencent Youtuyun is used in this article to recognize faces and extract image tag information.
The above modules can be installed through pip. For detailed instructions on the use of each module, please consult the respective documentation.
1. Data analysis
The prerequisite for analyzing WeChat friend data is to obtain friend information. By using the itchat module, all this will become very simple. We can achieve it through the following two lines of code. :
itchat.auto_login(hotReload = True)
friends = itchat.get_friends(update = True)
Just like logging in to the web version of WeChat, we can log in by scanning the QR code with our mobile phone. The friends object returned here is a collection, and the first element is the current user. Therefore, in the following data analysis process, we always take friends[1:] as the original input data. Each element in the collection is a dictionary structure. Taking myself as an example, you can notice that there are Sex, City, Province, HeadImgUrl, and Signature are four fields. Our following analysis will start from these four fields:

2. Friend’s Gender
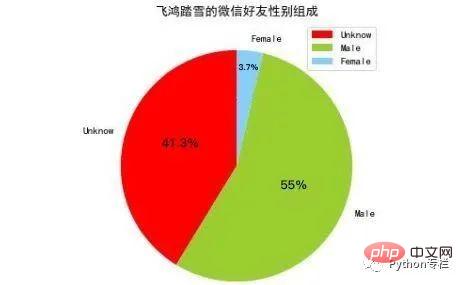
Analyze Friend’s Gender , we first need to obtain the gender information of all friends. Here we extract the Sex field of each friend's information, and then count the numbers of Male, Female and Unkonw respectively. We assemble these three values into a list. Use the matplotlib module to draw a pie chart. The code is implemented as follows:
def analyseSex(firends):
sexs = list(map(lambda x:x['Sex'],friends[1:]))
 counts = list(map(lambda x:x[1],Counter(sexs).items()))
 labels = ['Unknow','Male','Female']
 colors = ['red','yellowgreen','lightskyblue']
 plt.figure(figsize=(8,5), dpi=80)
 plt.axes(aspect=1)
 plt.pie(counts, #性别统计结果
 labels=labels, #性别展示标签
 colors=colors, #饼图区域配色
 labeldistance = 1.1, #标签距离圆点距离
 autopct = '%3.1f%%', #饼图区域文本格式
 shadow = False, #饼图是否显示阴影
 startangle = 90, #饼图起始角度
 pctdistance = 0.6 #饼图区域文本距离圆点距离
 )
 plt.legend(loc='upper right',)
 plt.title(u'%s的微信好友性别组成' % friends[0]['NickName'])
plt.show()
Here is a brief explanation of this code. The values of the gender field in WeChat include Unkonw, Male and Female, and their corresponding values are respectively is 0, 1, 2. These three different values are counted through Counter() in the Collection module, and its items() method returns a collection of tuples.
The first dimensional element of this tuple represents the key, that is, 0, 1, 2, and the second dimensional element of this tuple represents the number, and the set of tuples is sorted, that is, its keys are according to 0, 1, 2 are arranged in order, so the number of these three different values can be obtained through the map() method. We can pass it to matplotlib for drawing. The percentages of these three different values are determined by matplotlib. Calculated. The following picture is the gender distribution of friends drawn by matplotlib:

3. Friend avatar
Analyze the friend avatar from two aspects, first, Among these friend avatars, what is the proportion of friends who use human face avatars? Secondly, what valuable keywords can be extracted from these friend avatars.
Here you need to download the avatar locally based on the HeadImgUrl field, and then use the face recognition related API interface provided by Tencent Youtu to detect whether there is a face in the avatar image and extract the tags in the image. Among them, the former is classification and summary, and we use pie charts to present the results; the latter is text analysis, and we use word clouds to present the results. The key code is as follows:
def analyseHeadImage(frineds):
 # Init Path
 basePath = os.path.abspath('.')
baseFolder = basePath + '\HeadImages\'
 if(os.path.exists(baseFolder) == False):
 os.makedirs(baseFolder)
 # Analyse Images
 faceApi = FaceAPI()
use_face = 0
not_use_face = 0
 image_tags = ''
 for index in range(1,len(friends)):
friend = friends[index]
# Save HeadImages
imgFile = baseFolder + '\Image%s.jpg' % str(index)
imgData = itchat.get_head_img(userName = friend['UserName'])
if(os.path.exists(imgFile) == False):
 with open(imgFile,'wb') as file:
file.write(imgData)
# Detect Faces
time.sleep(1)
result = faceApi.detectFace(imgFile)
if result == True:
use_face += 1
else:
not_use_face += 1
# Extract Tags
result = faceApi.extractTags(imgFile)
 image_tags += ','.join(list(map(lambda x:x['tag_name'],result)))
 labels = [u'使用人脸头像',u'不使用人脸头像']
 counts = [use_face,not_use_face]
 colors = ['red','yellowgreen','lightskyblue']
 plt.figure(figsize=(8,5), dpi=80)
 plt.axes(aspect=1)
 plt.pie(counts, #性别统计结果
 labels=labels, #性别展示标签
 colors=colors, #饼图区域配色
 labeldistance = 1.1, #标签距离圆点距离
 autopct = '%3.1f%%', #饼图区域文本格式
 shadow = False, #饼图是否显示阴影
 startangle = 90, #饼图起始角度
 pctdistance = 0.6 #饼图区域文本距离圆点距离
 )
 plt.legend(loc='upper right',)
 plt.title(u'%s的微信好友使用人脸头像情况' % friends[0]['NickName'])
plt.show()
 image_tags = image_tags.encode('iso8859-1').decode('utf-8')
 back_coloring = np.array(Image.open('face.jpg'))
 wordcloud = WordCloud(
font_path='simfang.ttf',
background_color="white",
max_words=1200,
mask=back_coloring,
max_font_size=75,
random_state=45,
width=800,
height=480,
 margin=15
)
 wordcloud.generate(image_tags)
 plt.imshow(wordcloud)
 plt.axis("off")
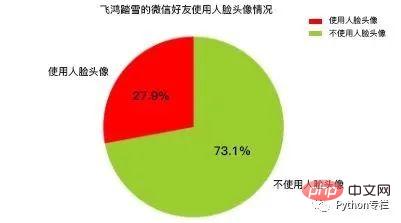
plt.show()这里我们会在当前目录新建一个HeadImages目录,用于存储所有好友的头像,然后我们这里会用到一个名为FaceApi类,这个类由腾讯优图的SDK封装而来,这里分别调用了人脸检测和图像标签识别两个API接口,前者会统计”使用人脸头像”和”不使用人脸头像”的好友各自的数目,后者会累加每个头像中提取出来的标签。其分析结果如下图所示:

可以注意到,在所有微信好友中,约有接近1/4的微信好友使用了人脸头像, 而有接近3/4的微信好友没有人脸头像,这说明在所有微信好友中对”颜值 “有自信的人,仅仅占到好友总数的25%,或者说75%的微信好友行事风格偏低调为主,不喜欢用人脸头像做微信头像。
其次,考虑到腾讯优图并不能真正的识别”人脸”,我们这里对好友头像中的标签再次进行提取,来帮助我们了解微信好友的头像中有哪些关键词,其分析结果如图所示:

通过词云,我们可以发现:在微信好友中的签名词云中,出现频率相对较高的关键字有:女孩、树木、房屋、文本、截图、卡通、合影、天空、大海。这说明在我的微信好友中,好友选择的微信头像主要有日常、旅游、风景、截图四个来源。
好友选择的微信头像中风格以卡通为主,好友选择的微信头像中常见的要素有天空、大海、房屋、树木。通过观察所有好友头像,我发现在我的微信好友中,使用个人照片作为微信头像的有15人,使用网络图片作为微信头像的有53人,使用动漫图片作为微信头像的有25人,使用合照图片作为微信头像的有3人,使用孩童照片作为微信头像的有5人,使用风景图片作为微信头像的有13人,使用女孩照片作为微信头像的有18人,基本符合图像标签提取的分析结果。
4. 好友签名
分析好友签名,签名是好友信息中最为丰富的文本信息,按照人类惯用的”贴标签”的方法论,签名可以分析出某一个人在某一段时间里状态,就像人开心了会笑、哀伤了会哭,哭和笑两种标签,分别表明了人开心和哀伤的状态。
这里我们对签名做两种处理,第一种是使用结巴分词进行分词后生成词云,目的是了解好友签名中的关键字有哪些,哪一个关键字出现的频率相对较高;第二种是使用SnowNLP分析好友签名中的感情倾向,即好友签名整体上是表现为正面的、负面的还是中立的,各自的比重是多少。这里提取Signature字段即可,其核心代码如下:
def analyseSignature(friends):
 signatures = ''
 emotions = []
 pattern = re.compile("1fd.+")
 for friend in friends:
signature = friend['Signature']
if(signature != None):
 signature = signature.strip().replace('span', '').replace('class', '').replace('emoji', '')
 signature = re.sub(r'1f(d.+)','',signature)
 if(len(signature)>0):
nlp = SnowNLP(signature)
emotions.append(nlp.sentiments)
signatures += ' '.join(jieba.analyse.extract_tags(signature,5))
 with open('signatures.txt','wt',encoding='utf-8') as file:
 file.write(signatures)
 # Sinature WordCloud
 back_coloring = np.array(Image.open('flower.jpg'))
 wordcloud = WordCloud(
font_path='simfang.ttf',
background_color="white",
max_words=1200,
mask=back_coloring,
max_font_size=75,
random_state=45,
width=960,
height=720,
 margin=15
 )
 wordcloud.generate(signatures)
 plt.imshow(wordcloud)
 plt.axis("off")
 plt.show()
 wordcloud.to_file('signatures.jpg')
 # Signature Emotional Judgment
 count_good = len(list(filter(lambda x:x>0.66,emotions)))
 count_normal = len(list(filter(lambda x:x>=0.33 and x<=0.66,emotions)))
 count_bad = len(list(filter(lambda x:x<0.33,emotions)))
 labels = [u'负面消极',u'中性',u'正面积极']
 values = (count_bad,count_normal,count_good)
 plt.rcParams['font.sans-serif'] = ['simHei']
plt.rcParams['axes.unicode_minus'] = False
 plt.xlabel(u'情感判断')
 plt.ylabel(u'频数')
 plt.xticks(range(3),labels)
 plt.legend(loc='upper right',)
 plt.bar(range(3), values, color = 'rgb')
 plt.title(u'%s的微信好友签名信息情感分析' % friends[0]['NickName'])
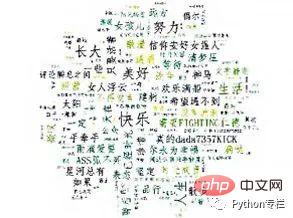
plt.show()通过词云,我们可以发现:在微信好友的签名信息中,出现频率相对较高的关键词有:努力、长大、美好、快乐、生活、幸福、人生、远方、时光、散步。

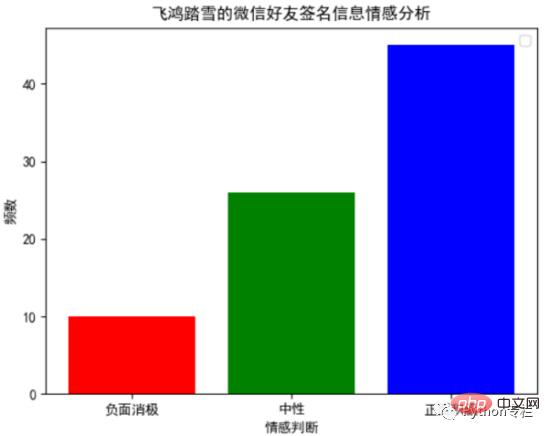
通过以下柱状图,我们可以发现:在微信好友的签名信息中,正面积极的情感判断约占到55.56%,中立的情感判断约占到32.10%,负面消极的情感判断约占到12.35%。这个结果和我们通过词云展示的结果基本吻合,这说明在微信好友的签名信息中,约有87.66%的签名信息,传达出来都是一种积极向上的态度。

5. 好友位置
分析好友位置,主要通过提取Province和City这两个字段。Python中的地图可视化主要通过Basemap模块,这个模块需要从国外网站下载地图信息,使用起来非常的不便。
百度的ECharts在前端使用的比较多,虽然社区里提供了pyecharts项目,可我注意到因为政策的改变,目前Echarts不再支持导出地图的功能,所以地图的定制方面目前依然是一个问题,主流的技术方案是配置全国各省市的JSON数据。
这里我使用的是BDP个人版,这是一个零编程的方案,我们通过Python导出一个CSV文件,然后将其上传到BDP中,通过简单拖拽就可以制作可视化地图,简直不能再简单,这里我们仅仅展示生成CSV部分的代码:
def analyseLocation(friends):
 headers = ['NickName','Province','City']
 with open('location.csv','w',encoding='utf-8',newline='',) as csvFile:
writer = csv.DictWriter(csvFile, headers)
writer.writeheader()
for friend in friends[1:]:
 row = {}
 row['NickName'] = friend['NickName']
 row['Province'] = friend['Province']
 row['City'] = friend['City']
writer.writerow(row)下图是BDP中生成的微信好友地理分布图,可以发现:我的微信好友主要集中在宁夏和陕西两个省份。
6. 总结
这篇文章是我对数据分析的又一次尝试,主要从性别、头像、签名、位置四个维度,对微信好友进行了一次简单的数据分析,主要采用图表和词云两种形式来呈现结果。总而言之一句话,”数据可视化是手段而并非目的”,重要的不是我们在这里做了这些图出来,而是从这些图里反映出来的现象,我们能够得到什么本质上的启示,希望这篇文章能让大家有所启发。
The above is the detailed content of I used Python to crawl my WeChat friends, they are like this.... For more information, please follow other related articles on the PHP Chinese website!

Hot AI Tools

Undresser.AI Undress
AI-powered app for creating realistic nude photos

AI Clothes Remover
Online AI tool for removing clothes from photos.

Undress AI Tool
Undress images for free

Clothoff.io
AI clothes remover

Video Face Swap
Swap faces in any video effortlessly with our completely free AI face swap tool!

Hot Article

Hot Tools

Notepad++7.3.1
Easy-to-use and free code editor

SublimeText3 Chinese version
Chinese version, very easy to use

Zend Studio 13.0.1
Powerful PHP integrated development environment

Dreamweaver CS6
Visual web development tools

SublimeText3 Mac version
God-level code editing software (SublimeText3)

Hot Topics
 1386
1386
 52
52
 How to run programs in terminal vscode
Apr 15, 2025 pm 06:42 PM
In VS Code, you can run the program in the terminal through the following steps: Prepare the code and open the integrated terminal to ensure that the code directory is consistent with the terminal working directory. Select the run command according to the programming language (such as Python's python your_file_name.py) to check whether it runs successfully and resolve errors. Use the debugger to improve debugging efficiency.
 Can visual studio code be used in python
Apr 15, 2025 pm 08:18 PM
VS Code can be used to write Python and provides many features that make it an ideal tool for developing Python applications. It allows users to: install Python extensions to get functions such as code completion, syntax highlighting, and debugging. Use the debugger to track code step by step, find and fix errors. Integrate Git for version control. Use code formatting tools to maintain code consistency. Use the Linting tool to spot potential problems ahead of time.
 Is the vscode extension malicious?
Apr 15, 2025 pm 07:57 PM
VS Code extensions pose malicious risks, such as hiding malicious code, exploiting vulnerabilities, and masturbating as legitimate extensions. Methods to identify malicious extensions include: checking publishers, reading comments, checking code, and installing with caution. Security measures also include: security awareness, good habits, regular updates and antivirus software.
 Can vs code run in Windows 8
Apr 15, 2025 pm 07:24 PM
VS Code can run on Windows 8, but the experience may not be great. First make sure the system has been updated to the latest patch, then download the VS Code installation package that matches the system architecture and install it as prompted. After installation, be aware that some extensions may be incompatible with Windows 8 and need to look for alternative extensions or use newer Windows systems in a virtual machine. Install the necessary extensions to check whether they work properly. Although VS Code is feasible on Windows 8, it is recommended to upgrade to a newer Windows system for a better development experience and security.
 Python: Automation, Scripting, and Task Management
Apr 16, 2025 am 12:14 AM
Python excels in automation, scripting, and task management. 1) Automation: File backup is realized through standard libraries such as os and shutil. 2) Script writing: Use the psutil library to monitor system resources. 3) Task management: Use the schedule library to schedule tasks. Python's ease of use and rich library support makes it the preferred tool in these areas.
 What is vscode What is vscode for?
Apr 15, 2025 pm 06:45 PM
VS Code is the full name Visual Studio Code, which is a free and open source cross-platform code editor and development environment developed by Microsoft. It supports a wide range of programming languages and provides syntax highlighting, code automatic completion, code snippets and smart prompts to improve development efficiency. Through a rich extension ecosystem, users can add extensions to specific needs and languages, such as debuggers, code formatting tools, and Git integrations. VS Code also includes an intuitive debugger that helps quickly find and resolve bugs in your code.
 Can visual studio code run python
Apr 15, 2025 pm 08:00 PM
VS Code not only can run Python, but also provides powerful functions, including: automatically identifying Python files after installing Python extensions, providing functions such as code completion, syntax highlighting, and debugging. Relying on the installed Python environment, extensions act as bridge connection editing and Python environment. The debugging functions include setting breakpoints, step-by-step debugging, viewing variable values, and improving debugging efficiency. The integrated terminal supports running complex commands such as unit testing and package management. Supports extended configuration and enhances features such as code formatting, analysis and version control.
 Can vs code run python
Apr 15, 2025 pm 08:21 PM
Yes, VS Code can run Python code. To run Python efficiently in VS Code, complete the following steps: Install the Python interpreter and configure environment variables. Install the Python extension in VS Code. Run Python code in VS Code's terminal via the command line. Use VS Code's debugging capabilities and code formatting to improve development efficiency. Adopt good programming habits and use performance analysis tools to optimize code performance.


