
For developers with many years of programming experience, the concept of graphs is not unfamiliar. Many top companies test understanding of graph theory during technical interviews. In fact, developers do not need to deal with advanced issues to take advantage of these concepts. To understand this, we can first review why graphs are popular data structures and how to implement them in code.
Regardless of coding experience, developers should have some understanding of the array and dictionary data types. These collections are a standard concept used in most languages and work well when rendering list-based content:
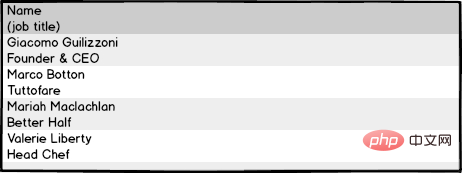
Most of the time lists are retrieved from a database or based on REST The perfect solution for displaying information in queries. However, sometimes lists need to provide records that have interrelated context. At this point, it becomes convenient to organize the data into charts.
With diagrams, the main goal is not to list information (although this can be done), but to define relationships between objects. Why is it useful to define relationships between objects? Let’s take a look at the following examples.

An undirected graph with two vertices and one edge
(1) Map application:
If asked in a technical interview, how would you organize data to recreate a mapping service (such as Apple or Google Maps)? In addition to providing a list of all known roads in a database, the model you create needs to determine the best way to reach your destination based on factors such as time of day, traffic, and one-way streets. To make this large amount of data work, you need to know the relationship between a road and all other streets in the model.
(2) Social media :
The value of a social media is usually measured by the number of users following or following the user. Online platforms like Twitter allow users to connect with anyone and receive their latest updates, thus attracting a large number of users.
The LinkedIn model is more detailed because a user cannot add someone to the user's network unless the recipient accepts the user's connection request. In this case, the LinkedIn connection represents a two-way relationship. Along this line, users can also search their network to see if anyone is associated with the job opportunity they want. In this context, "network" may mean direct or indirect connections. Such a powerful model is not just based on a simple list, it contains the intelligence to determine how all profiles are related.
Now that we have understood how graphs are used in everyday applications, let’s introduce the components of graphs.
The nodes in the graph are called vertices. While graphs can be constructed as single vertices, models containing multiple vertices better represent real-world applications.
Objects in a graph are related to each other through connections called edges.
Depending on your needs, a vertex can be connected to one or more objects through edges, or you can create a vertex without edges.
Finally, unlike other standard structures such as stacks or queues, graphs typically do not have a designated start or end point. Here are some example graph configurations:

An undirected graph with two vertices and one edge
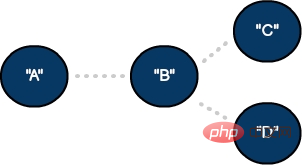
An undirected graph with two vertices and one edge
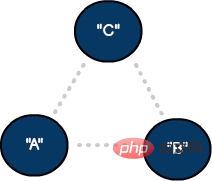
An undirected graph with Undirected graph with two vertices and one edge
In an undirected graph, the connections between source vertices and destinations are equal. These models represent two-way connections—similar to two-way streets in mapping applications.
To define a one-way connection, we can update the model to a directed graph using lines and arrows:
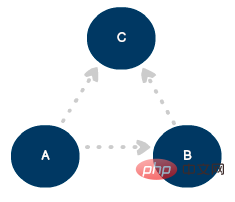
Three vertices and three Directed Graph of Edges
Sometimes, we have to express the degree of connectivity between vertices in the graph. This technique works well when quantifying distance, time, or severity between nodes. The weight is usually related to an edge and is a comparison variable used for tracking. .
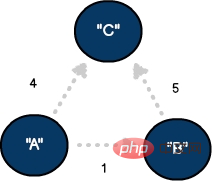
Directed graph with three vertices and three edges, where the edges are weighted
Now that we have a basic understanding of graph theory, let’s see how to replicate these models in code. Below we create a vertex that supports a custom generic object (T). A tvalue variable represents data held by that type, including a single string, int, or a custom type (for example, a street name or a social media profile).
Also, be careful to make our type conform to the popular Equatable protocol (Swift). This allows us to compare specific vertex instances for equality when needed.
public class Vertex <t> : Equatable {<br><br>var tvalue: T?<br>var neighbors = Array<edge>>()<br>let uuid = UUID()<br><br>public init(with name: T) {<br>self.tvalue = name<br>}<br><br>//equatable conformance<br>public static func == (lhs: Vertex, rhs: Vertex) -> Bool {<br> return lhs.uuid == rhs.uuid<br>}<br>}</edge></t>
The adjacency list represents the connection with other vertices. As mentioned earlier, each vertex can be connected to one or more adjacent vertices. This list of relationships is sometimes called an "adjacency list" and can be used to solve many advanced problems.
var neighbors = Array<edge>>()</edge>
When creating a vertex, we added an adjacency property to store an array of custom edge types. The lower edge provides a reference for subsequent adjacent vertices and their potential edge weights.
public class Edge <t> {<br><br>var neighbor: Vertex<t><br>var weight: Int<br><br>init() {<br> weight = 0<br> self.neighbor = Vertex<t>()<br>}<br>}</t></t></t>With the vertex and edge objects in hand, we can now add them to the central storage structure we call the graphics canvas. Although our canvas is technically an array, our goal is to visualize the collection as a set of relationships. With the addVertex function we can add a single generic vertex to the canvas, while the addEdge method provides the reference information needed for the edge.
Finally, our code assumes that the graph is directed, since edges are (only) added to the source vertex adjacency list.
public class Graph <t> {<br><br>var canvas: Array<vertex>><br><br> public init() {<br> canvas = Array<vertex>()<br>}<br><br>//add vertex to graph canvas<br>public func addVertex(element: Vertex<t>) {<br> canvas.append(element)<br>}<br>/add edge<br>public func addEdge(source: Vertex<t>, neighbor: Vertex<t>, weight: Int) {<br><br> //create a new edge<br> let newEdge = Edge<t>()<br><br> //connect source vertex to neighboring edge<br> newEdge.neighbor = neighbor<br> newEdge.weight = weight<br><br> source.neighbors.append(newEdge)<br>}<br>}</t></t></t></t></vertex></vertex></t>In summary, we introduced knowledge about graphs and saw how they can be used to represent relationships between objects. We also reviewed several ways to configure graphs and the components used to describe different models.
After defining the model, we lay the foundation for more advanced features, including graph navigation and traversal algorithms such as breadth-first search.
Kang Shaojing, 51CTO community editor, currently engaged in the communications industry, low-level driver development position, has studied data structures, Python, and is now interested in operating systems, databases and other related fields .
Original title: The complete beginner's guide to graph theory, author: Wayne Bishop
Link:
https://stackoverflow.blog/2022/05/26/the -complete-beginners-guide-to-graph-theory/
The above is the detailed content of Graph theory is actually not difficult to get started with. For more information, please follow other related articles on the PHP Chinese website!


