50 lines of Python code to create a big data screen!

Introduction to PywebIO
The PywebIO module in Python can help developers quickly build web applications or browser-based applications without HTML and JavaScript. For GUI applications, PywebIO can also be used in conjunction with some commonly used visualization modules to create a large visual screen.
Let’s first install the modules we need to use.
pip install pywebio
pip install cutecharts
The cutecharts module mentioned above is a hand-drawn style visualization artifact in Python. I believe everyone is familiar with it. Let’s take a look at the effect of combining it with the PywebIO module to draw charts. The code As follows:
from cutecharts.charts import Bar
from cutecharts.faker import Faker
from pywebio import start_server
from pywebio.output import put_html
def bar_base():
chart = Bar("Bar-基本示例", width="100%")
chart.set_options(labels=Faker.choose(), x_label="I'm xlabel", y_label="I'm ylabel")
chart.add_series("series-A", Faker.values())
put_html(chart.render_notebook())
if __name__ == '__main__':
start_server(bar_base, debug=True, port=8080)output
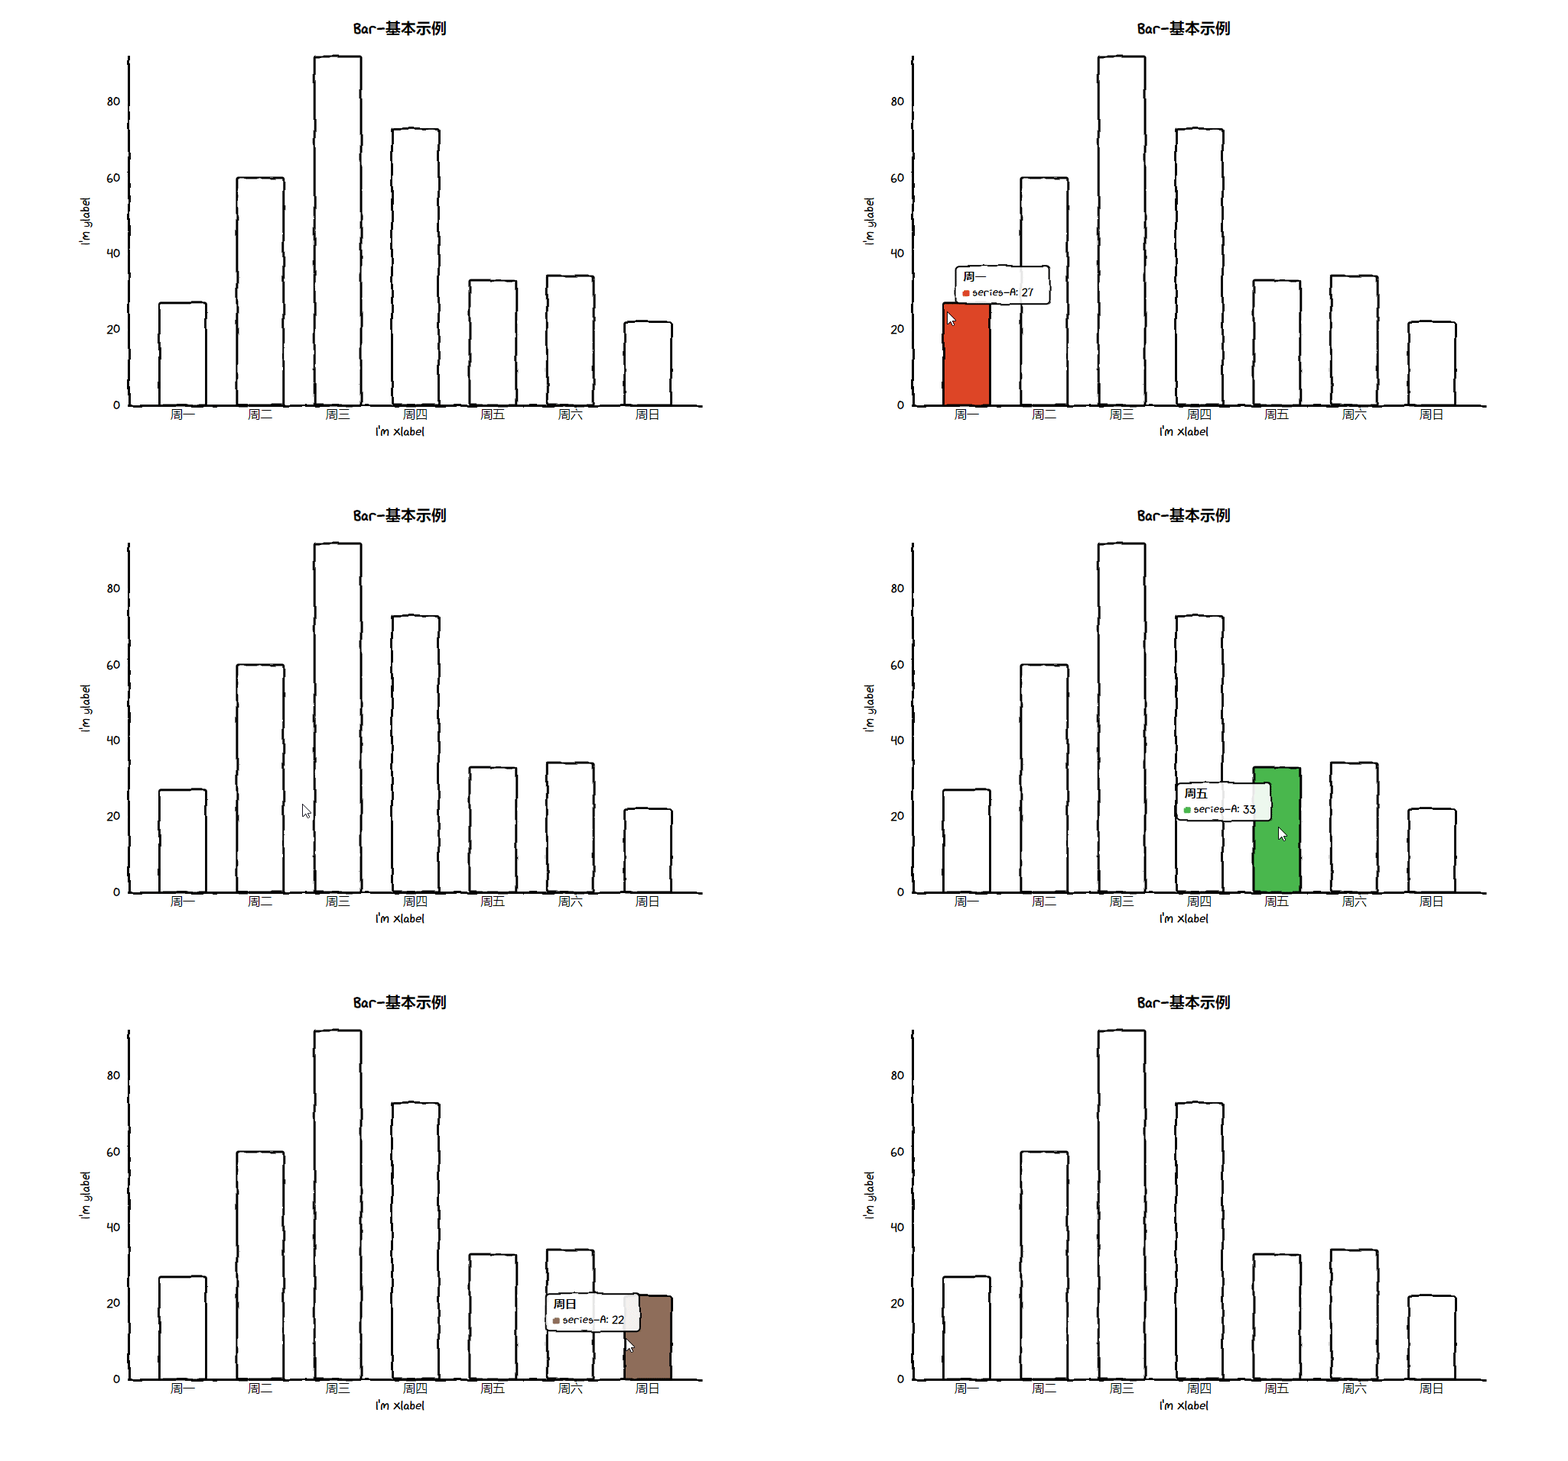
The logic of the above code is not difficult to understand. First instantiate a histogram Bar() object, and then fill in the X axis The corresponding label and the corresponding Y-axis value, and finally call the put_html() method in the PywebIO module, we will see a URL.

#Enter the URL in the browser to see the chart we drew. Of course, there is a Page() method in the cutecharts module to connect various charts to create a large visual screen. The code is as follows:
def bar_base():
chart = Bar("Bar-基本示例", width="100%")
chart.set_options(labels=Faker.choose(), x_label="I'm xlabel", y_label="I'm ylabel")
chart.add_series("series-A", Faker.values())
return chart
def pie_base() -> Pie:
chart = Pie("标题", width="100%")
........
return chart
def radar_base() -> Radar:
chart = Radar("标题", width="100%")
......
return chart
def line_base() -> Line:
chart = Line("标题", width="100%")
......
return chart
def main():
page = Page()
page.add(pie_base(), pie_base(), radar_base(), line_base(), bar_base())
put_html(page.render_notebook())
if __name__ == '__main__':
start_server(main, debug=True, port=8080)output
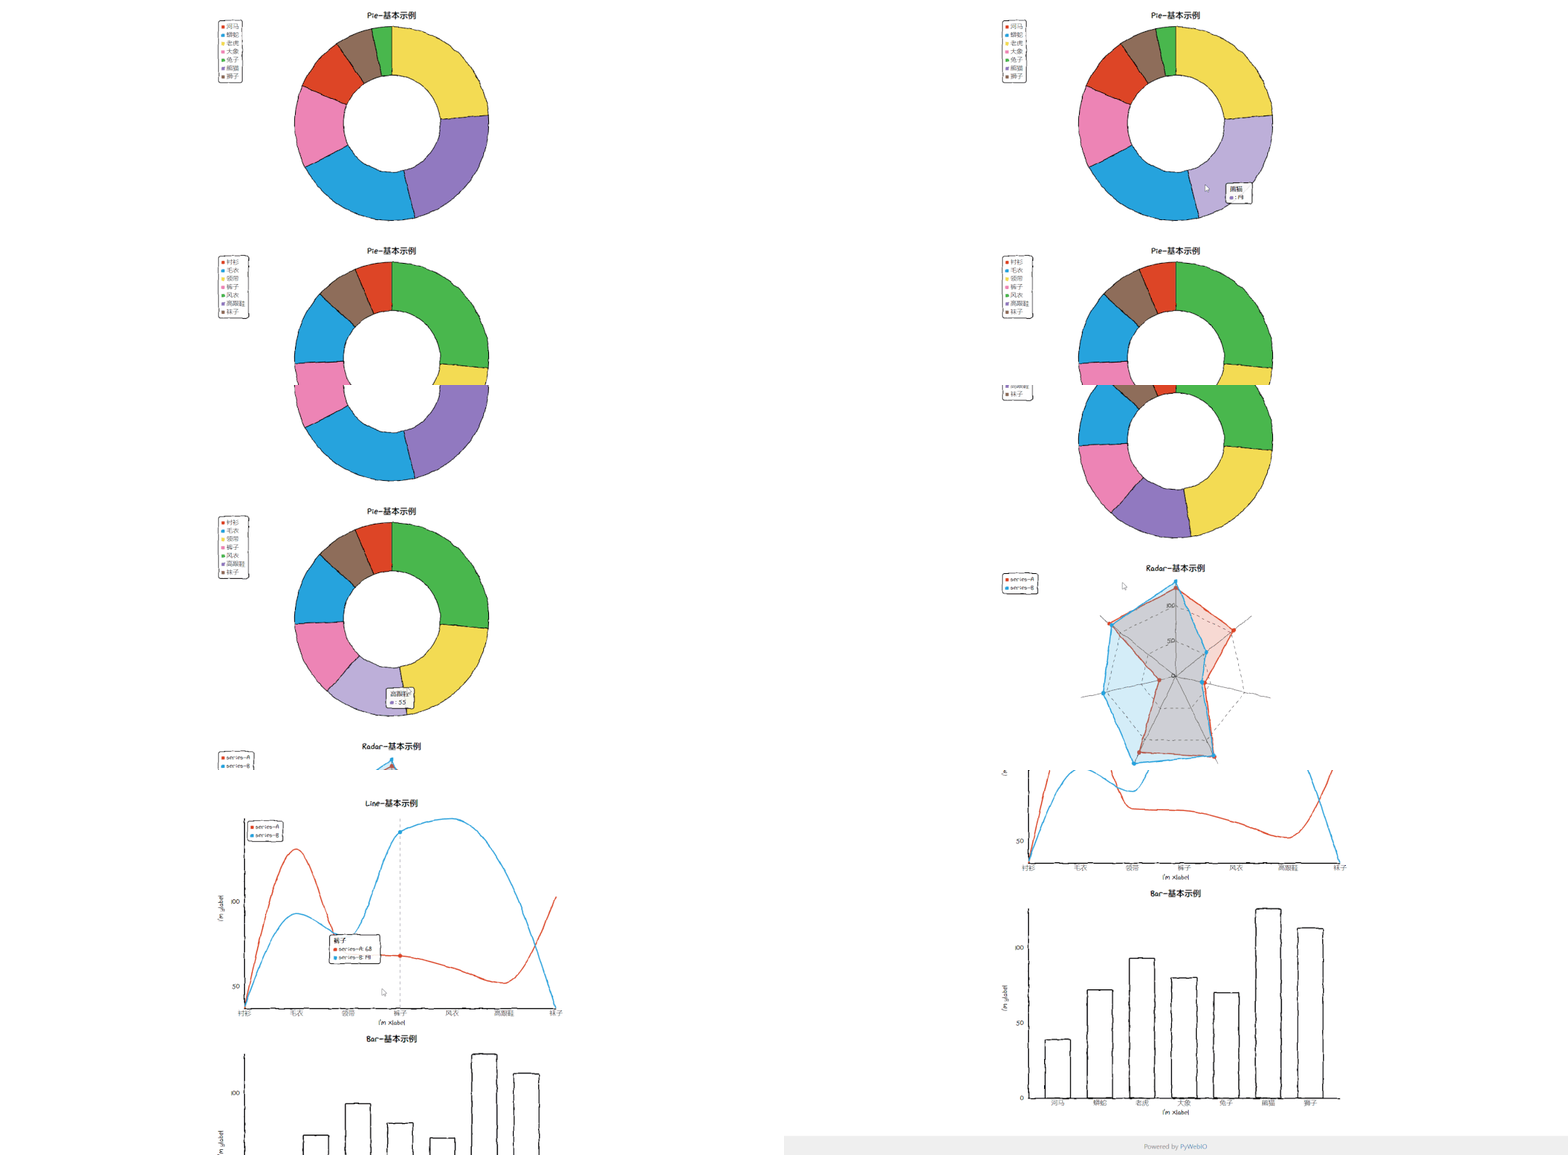
The combination of PywebIO and Pyecharts
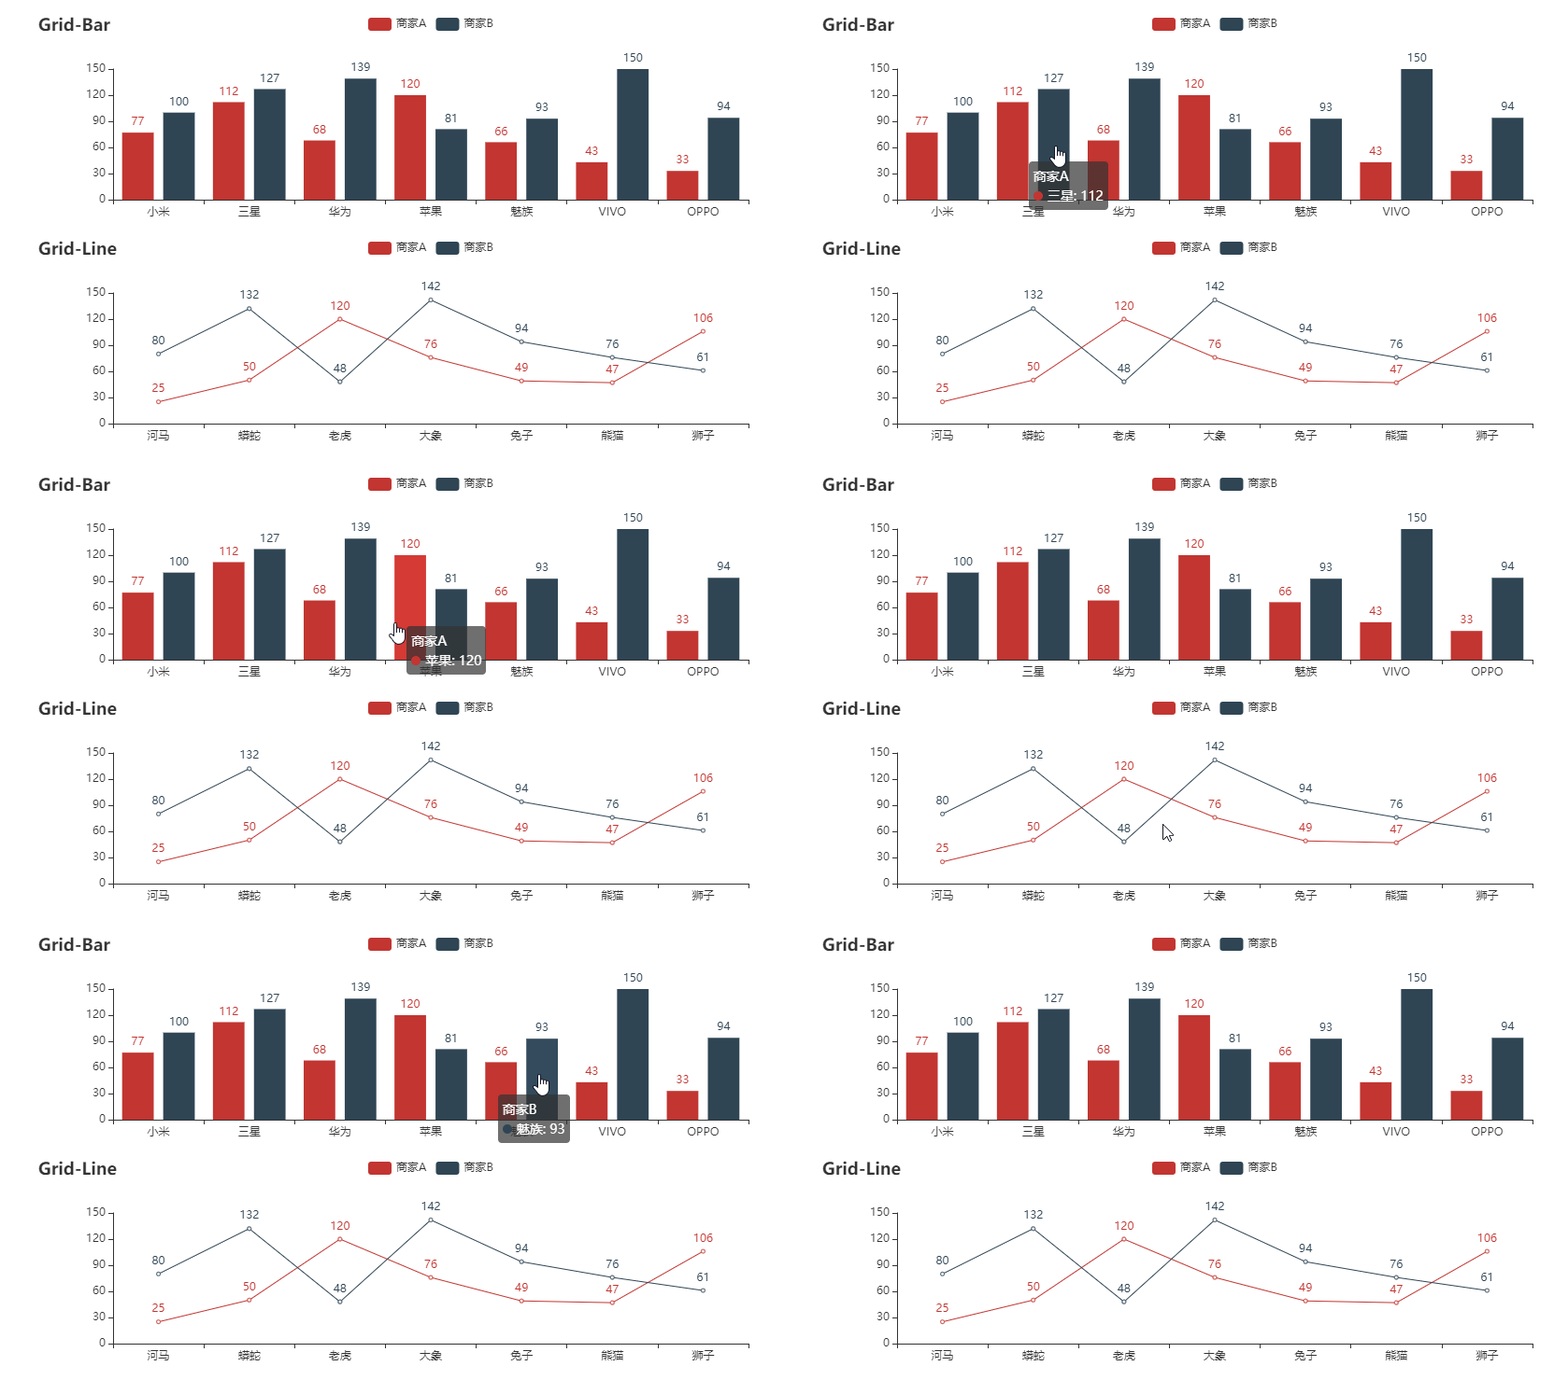
When the PywebIO module meets the Pyecharts module, the logic of the code is basically the same as that of cutecharts. First, a chart object is instantiated, and then after adding the data and setting up the chart After styling, the put_html() method is finally called to render the final result in the browser.
# `chart` 是你的图表的实例
pywebio.output.put_html(chart.render_notebook())
In this case, we call the combination component in Pyecharts to present the completed charts respectively. The code is as follows:
def bar_plots():
bar = (
Bar()
.add_xaxis(Faker.choose())
.add_yaxis("商家A", Faker.values())
.add_yaxis("商家B", Faker.values())
.set_global_opts(title_opts=opts.TitleOpts(title="Grid-Bar"))
)
return bar
def line_plots():
line = (
Line()
.add_xaxis(Faker.choose())
.add_yaxis("商家A", Faker.values())
.add_yaxis("商家B", Faker.values())
.set_global_opts(
title_opts=opts.TitleOpts(title="Grid-Line", pos_top="48%"),
legend_opts=opts.LegendOpts(pos_top="48%"),
)
)
return line
def main():
c = (
Grid()
.add(bar_plots(), grid_opts=opts.GridOpts(pos_bottom="60%"))
.add(line_plots(), grid_opts=opts.GridOpts(pos_top="60%"))
)
c.width = "100%"
put_html(c.render_notebook())
if __name__ == '__main__':
start_server(main, debug=True, port=8080)output
The combination of PywebIO and Bokeh
The combination of PywebIO and Bokeh will be slightly different from the above in terms of code syntax. The specific differences are as follows:
from bokeh.io import output_notebook
from bokeh.io import show
output_notebook(notebook_type='pywebio')
fig = figure(...)
...
show(fig)
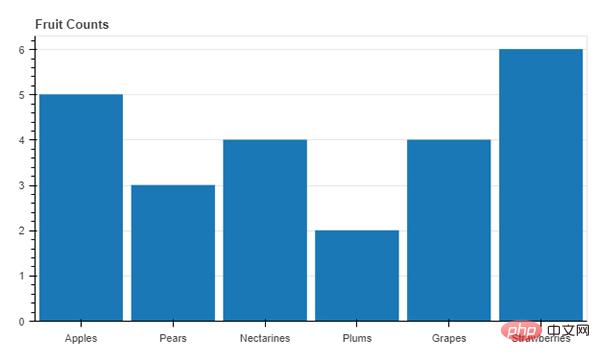
For example, we To draw a simple histogram, the code is as follows:
def bar_plots():
output_notebook(notebook_type='pywebio')
fruits = ['Apples', 'Pears', 'Nectarines', 'Plums', 'Grapes', 'Strawberries']
counts = [5, 3, 4, 2, 4, 6]
p = figure(x_range=fruits, plot_height=350, title="Fruit Counts",
 toolbar_location=None, tools="")
p.vbar(x=fruits, top=counts, width=0.9)
p.xgrid.grid_line_color = None
p.y_range.start = 0
show(p)
if __name__ == "__main__":
start_server(bar_plots, debug=True, port=8080)
output
from pywebio.input import *
from pywebio.output import *
data = input_group(
"用户数据",
[
input("请问您的名字是: ", name="name", type=TEXT),
input("输入您的年龄", name="age", type=NUMBER),
radio(
"哪个洲的",
name="continent",
options=[
"非洲",
"亚洲",
"澳大利亚",
"欧洲",
"北美洲",
"南美洲",
],
),
checkbox(
"用户隐私条例", name="agreement", options=["同意"]
),
],
)
put_text("表格输出:")
put_table(
[
["名字", data["name"]],
["年龄", data["age"]],
["位置", data["continent"]],
["条例", data["agreement"]],
]
)

- input(): input of text content
- radio(): Represents the single-select box
- checkbox(): Represents the multi-select box
- input_group(): Represents the input group
- put_table(): Represents the Output group
- put_text(): represents the output text
The above is the detailed content of 50 lines of Python code to create a big data screen!. For more information, please follow other related articles on the PHP Chinese website!

Hot AI Tools

Undresser.AI Undress
AI-powered app for creating realistic nude photos

AI Clothes Remover
Online AI tool for removing clothes from photos.

Undress AI Tool
Undress images for free

Clothoff.io
AI clothes remover

Video Face Swap
Swap faces in any video effortlessly with our completely free AI face swap tool!

Hot Article

Hot Tools

Notepad++7.3.1
Easy-to-use and free code editor

SublimeText3 Chinese version
Chinese version, very easy to use

Zend Studio 13.0.1
Powerful PHP integrated development environment

Dreamweaver CS6
Visual web development tools

SublimeText3 Mac version
God-level code editing software (SublimeText3)

Hot Topics
 1387
1387
 52
52
 The top ten virtual currency trading app addresses
Apr 21, 2025 am 09:24 AM
This article summarizes the information of the top ten virtual currency trading apps including Binance, Ouyi and Sesame Open Door, but for security reasons, the URL is not provided directly. Instead, it emphasizes the importance of safe access to the official platform through trusted channels and provides verification methods. At the same time, the article reminds investors to consider factors such as security, transaction fees, currency selection when choosing an APP, and pay attention to the risks of virtual currency trading.
 Laravel vs. Python: The Learning Curves and Ease of Use
Apr 20, 2025 am 12:17 AM
Laravel and Python have their own advantages and disadvantages in terms of learning curve and ease of use. Laravel is suitable for rapid development of web applications. The learning curve is relatively flat, but it takes time to master advanced functions. Python's grammar is concise and the learning curve is flat, but dynamic type systems need to be cautious.
 Choosing Between Python and C : The Right Language for You
Apr 20, 2025 am 12:20 AM
Python is suitable for beginners and data science, and C is suitable for system programming and game development. 1. Python is simple and easy to use, suitable for data science and web development. 2.C provides high performance and control, suitable for game development and system programming. The choice should be based on project needs and personal interests.
 Top 10 virtual currency trading app rankings Top 10 virtual currency exchange rankings
Apr 21, 2025 am 09:21 AM
This article publishes the latest top ten virtual currency trading app rankings and top ten virtual currency exchange rankings in 2024, including platforms such as Binance, Ouyi and Sesame Open. The article emphasizes that when choosing a platform and APP, factors such as security, transaction experience, and compliance should be considered, and investors should be reminded to pay attention to the risks of virtual currency transactions.
 Web3 trading platform ranking_Web3 global exchanges top ten summary
Apr 21, 2025 am 10:45 AM
Binance is the overlord of the global digital asset trading ecosystem, and its characteristics include: 1. The average daily trading volume exceeds $150 billion, supports 500 trading pairs, covering 98% of mainstream currencies; 2. The innovation matrix covers the derivatives market, Web3 layout and education system; 3. The technical advantages are millisecond matching engines, with peak processing volumes of 1.4 million transactions per second; 4. Compliance progress holds 15-country licenses and establishes compliant entities in Europe and the United States.
 New donations supporting Langley Memorial Hospital are almost one-third of its $1 million target
Apr 21, 2025 am 11:39 AM
The charity party hosted by the Langley Community Health and Hospital Foundation raised $331,000 to establish the Guru Nanak Endowment Fund. The donation raised by the "Heart of Giving" charity party for Langley Memorial Hospital has reached one-third of its million-dollar target. On April 4, more than 250 guests attended the annual fundraising event at the Cloverdale Mirage Ballroom. Activities include raffle draws, silent auctions, live auctions and fundraising games, with 50/50 draws continuing until May 2. Since 2019, the Heart of Giving charity party has brought together donors every year to celebrate the community and raise donations, said Heather Scott, executive director of the Langley Community Health and Hospital Foundation. She said: "Testimation
 A list of top 10 global leading virtual currency trading apps in 2025
Apr 21, 2025 pm 12:06 PM
The top ten leading virtual currency trading apps in the world in 2025 are: 1. Binance, 2. Gate.io, 3. OKX, 4. Huobi Global, 5. Bybit, 6. Kraken, 7. FTX, 8. KuCoin, 9. Coinbase, 10. Crypto.com.
 Recommended top ten digital currency APPs in the world (authoritative release in 2025)
Apr 21, 2025 pm 12:09 PM
The world's leading ten digital currency apps include: 1. OKX, 2. Binance, 3. Huobi, 4. Matcha (MXC), 5. Bitget, 6. BitMEX, 7. Pionex, 8. Deribit, 9. Bybit, 10. Kraken. These platforms have their own characteristics in security, transaction services, technical architecture, risk control team, user experience and ecosystem.


