 Technology peripherals
 AI
AI
 Application of graph machine learning in Ant Group's recommendation business
Application of graph machine learning in Ant Group's recommendation business
This article will introduce the application of graph machine learning in the ant recommendation system. In Ant's actual business, there is a large amount of additional information, such as knowledge graphs, user behaviors of other businesses, etc. This information is usually very helpful for recommendation business. We use graph algorithms to connect this information and recommendation systems to enhance user interests. Express. The full text mainly focuses on the following aspects:
- Background
- ##Based on Graph recommendation
- Social and text-based recommendation
- Cross-domain recommendation
01 Background
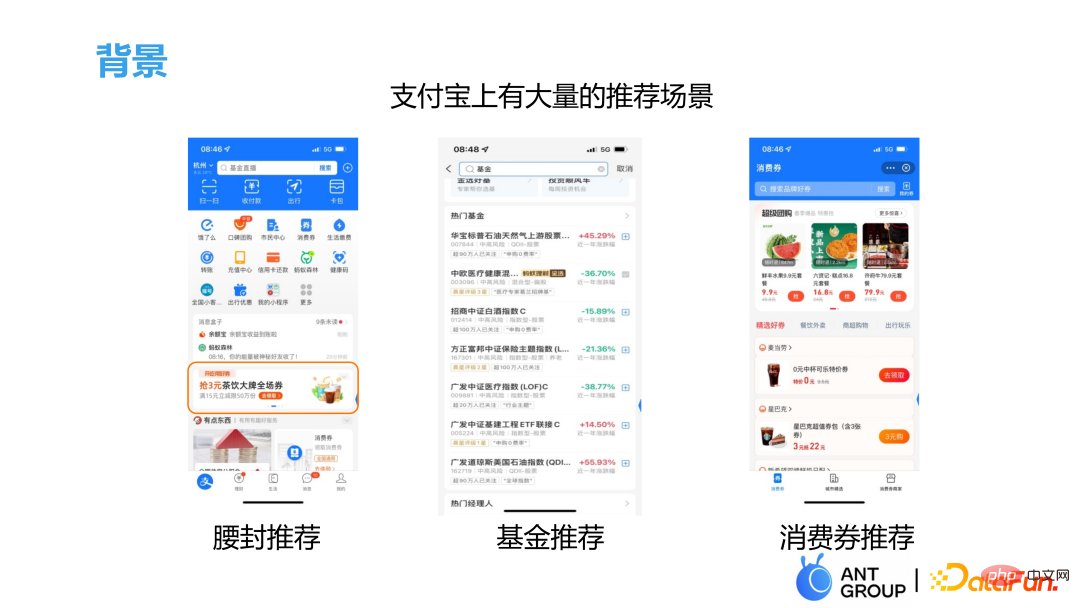
## In addition to its main payment function, Alipay also has a large number of recommendation scenarios, including waistband recommendation, fund recommendation, consumer coupon recommendation, etc. The biggest difference between recommendations within the Alipay domain compared to other recommendations is that user behavior is sparse and activity is low. Many users open Alipay just for payment and do not pay attention to other things. Therefore, there are very few records on the UI side in the recommendation network, and our focus is also on the recommendation of low-activity targets. For example, in order to increase DAU, content may only be placed on the waistband of low-active users, and normal users cannot see it; in the fund recommendation section, we pay more attention to those Users who do not have financial management or have low financial management positions are guided to buy some funds for trading; the recommendation of consumer coupons is also to promote offline consumption of low-activity users.
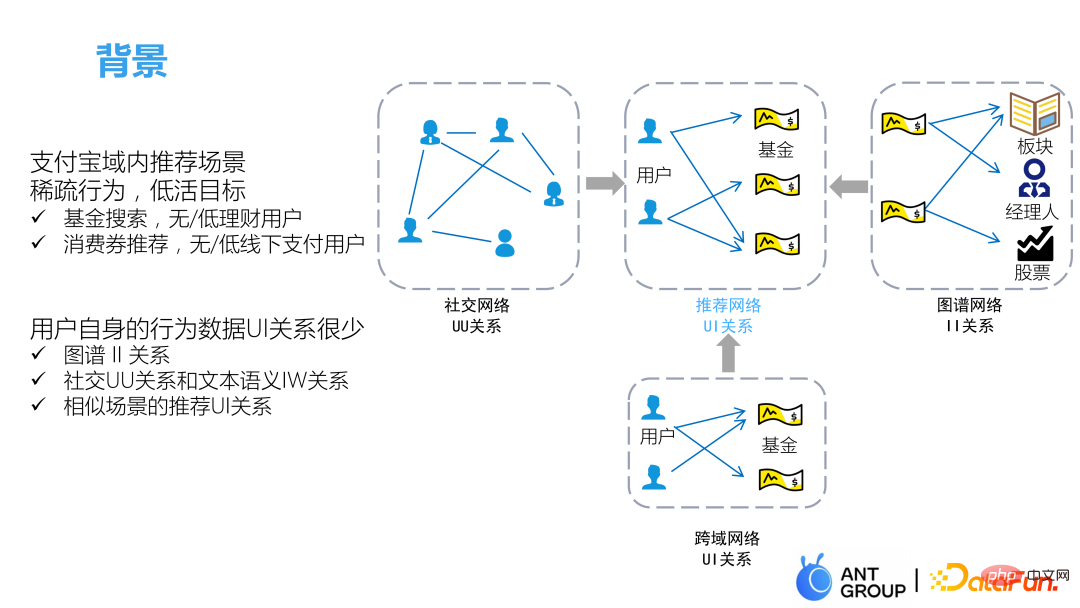
There is very little information about the historical behavior sequence of low-active users. Some methods that recommend directly based on UI historical behavior sequences may not be suitable for our scenario. Therefore, we introduced the following three scene information to enhance the UI relationship information in the Alipay domain:
- Social Network UU relationship
- II graph relationship
- UI relationships in other scenarios
The click preferences of friends of low-active users can be obtained through the UU relationship of social networks. According to Homogeneity can be used to infer the user's click preferences. The graph relationship between items can discover and expand the user's preference information for similar items. Finally, user behavior in cross-domain scenarios also has a great impact on the recommendation task of the current scenario. help.
02Graph-based recommendation
User behavior in many recommendation scenarios is sparse Especially when characterizing new users, there is very little behavioral information available, so it is usually necessary to introduce a lot of auxiliary information, such as attributes, contexts, images, etc. What we introduce here is the knowledge graph.
1. Existing challenges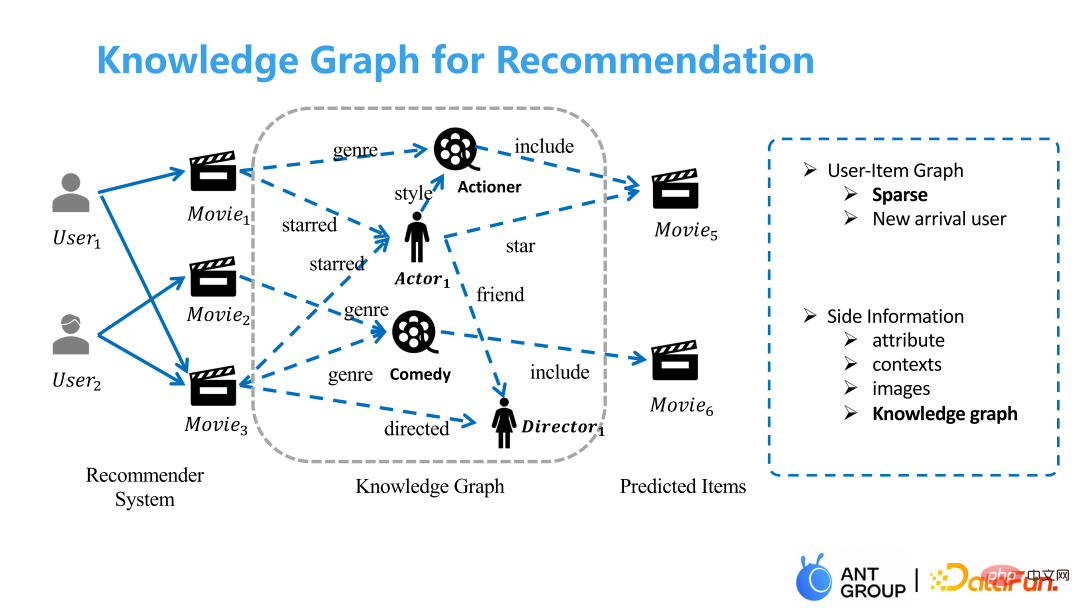
Knowledge graph is a large and Complete historical expert knowledge is helpful for our algorithm recommendation, but there are still two problems:
##First, The graph itself may not be designed for this business, so it contains a lot of useless information, and the training process is also very time-consuming. A common solution is to keep only the edges in the graph that can be associated with our products and delete all other edges, but this may cause some information loss because other edges are also useful. .
The second is that when the graph is used as auxiliary information, there is no way to aggregate user preferences to the edges inside the graph. As shown in the figure above, the reason why user 1 likes movie 1 and movie 2 may be because they have the same starring role, while the reason why user 2 likes movie 2 and movie 3 is that they are of the same genre. If you only use the UI and II relationships of ordinary graph models to model, you can only get the correlation between users and movies, but there is no way to aggregate these potential intentions of users into the graph.
#So we will mainly solve the two problems of map distillation and map refining later.
2. Existing methods
##① Embedding-based model
The Embedding-based method first converts the nodes in the graph into an Embedding through the graph representation learning method, and then converts the Embedding Directly connected to the UI model. This type of method learns the correlation in the graph in advance and converts it into an Embedding, so it is difficult to measure the similarity between the user and the knowledge edge, and does not solve the problems of graph distillation and graph refining.
② Path-based model
Path-based model The method decomposes the graph into multiple meta-paths based on the knowledge edges in the graph, but the process of constructing meta-paths requires a lot of expert knowledge and does not reflect the user's preference for knowledge edges.
##③ GCN-based model
The method based on GCN models the UI and II relationships. Generally, different weights are taken according to different types of edges through the attention method, but the weight of the edge is only related to the representation of the nodes at both ends of the edge, and has nothing to do with the representation of the target node.
3. Solution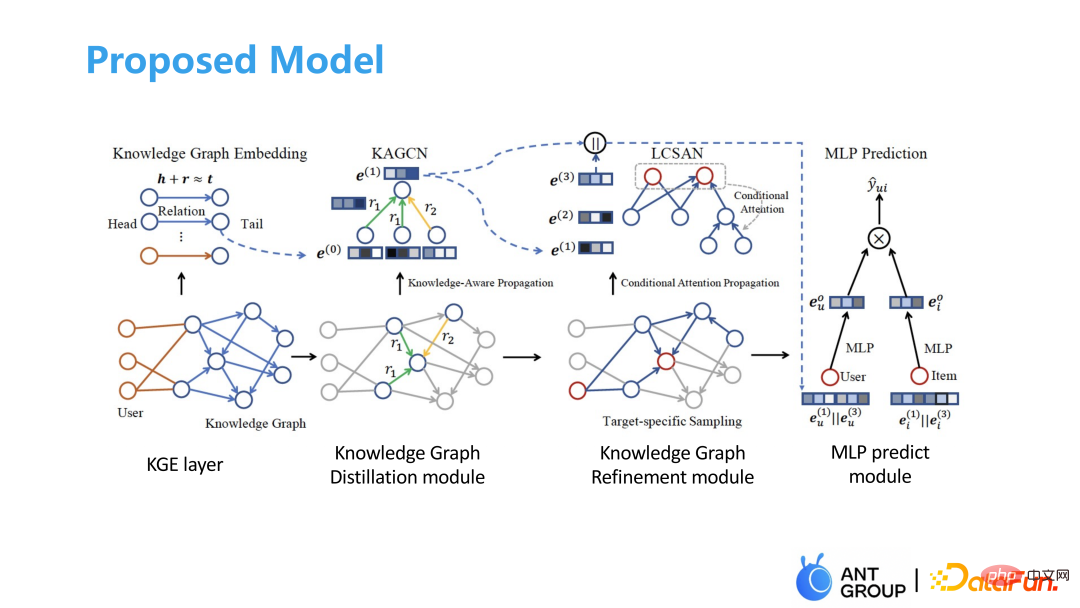
The model we propose is mainly divided into It consists of 4 parts. First, the graph representation is obtained through graph representation learning, and knowledge dependency propagation is used to learn and aggregate to obtain the importance of different edges. Then, a distillation module is used to sample and denoise the edges in the graph, and then conditional attention is added to do The map is refined, and finally a twin-tower model is made to obtain the result.
The specific details of each part are introduced below:
① Graph representation learning layer
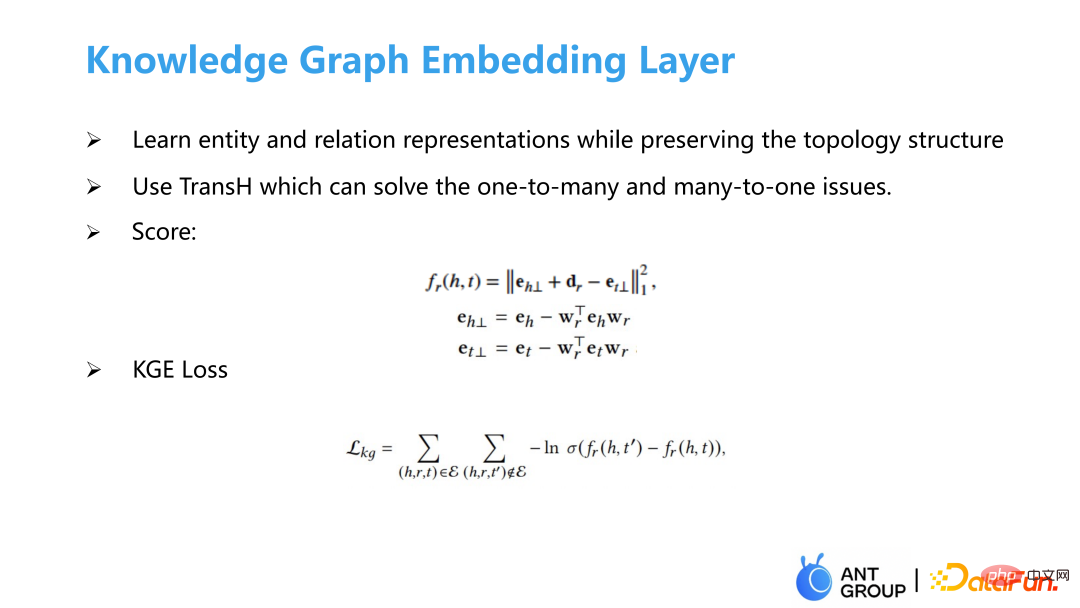
##②
Graph representation learning layer
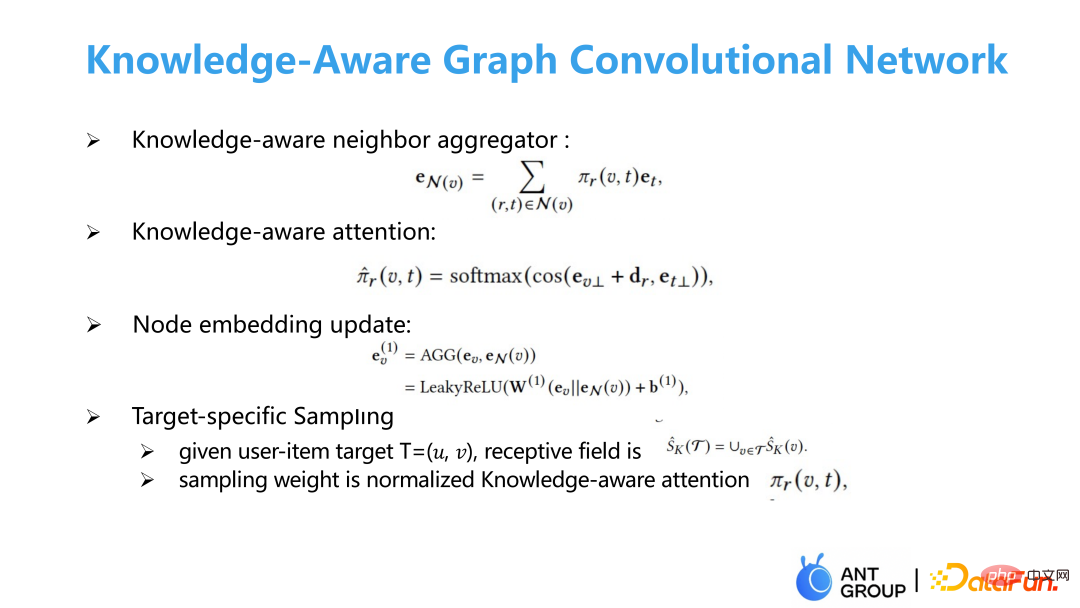
After learning the representation of the graph edges, aggregate the representations of the graph edges within the neighborhood, and then find the cos of different edge spaces Distance is represented as a weighted aggregation of points in the graph. Because the edges in the graph are very noisy, we will do an additional sampling and sample on the target subgraph based on the weights we learned. The target subgraph is the second-order subgraph of users and products combined. Sampling results in smaller subgraphs. ##③
Graph representation learning layer
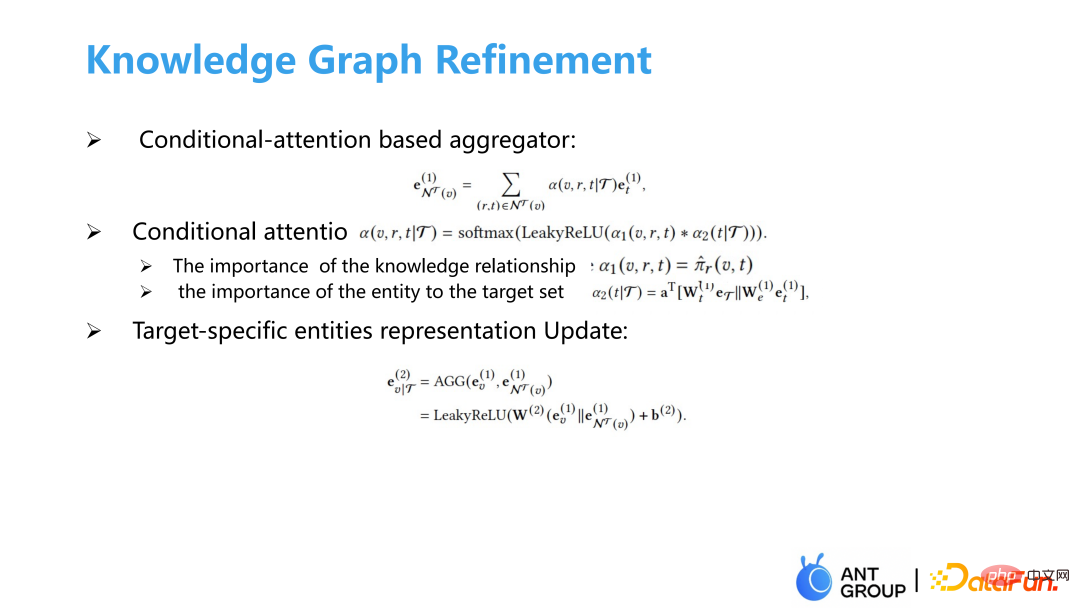
After obtaining the subgraph, we make a conditional attention to measure the importance of the edge given the user and product. The importance of an edge can be divided into two parts. One is that the edge itself is very important, and the other is that the user pays great attention to this edge. The importance of the edge itself has been learned in the knowledge-dependent attention in the previous step. No additional training is needed. The user's importance to the edge is made by splicing the representations of all target sets and the representations of both endpoints of the edge into an attention Get the conditional attention, and then do some aggregation based on the conditional attention.
##④ Twin TowersModel
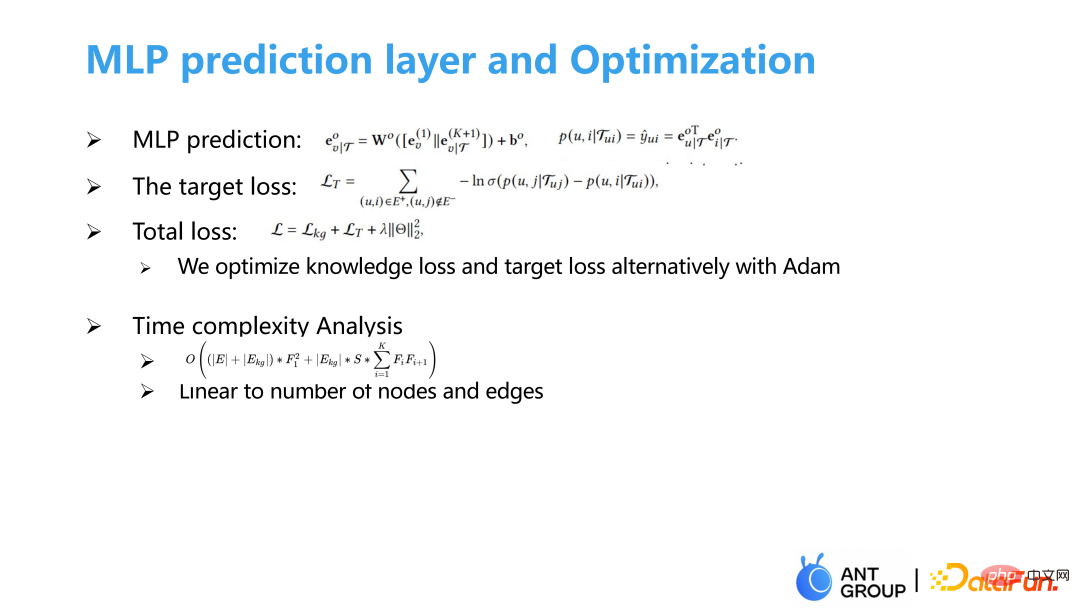
Finally, make a twin-tower model to measure pairwise loss, and use an Adam-like method to simultaneously optimize the graph representation learning loss and the target loss of the recommendation system. , the complexity of our algorithm is linearly related to the number of points and edges.
4. Experimental results
##① Experimental data set and benchmark model Select
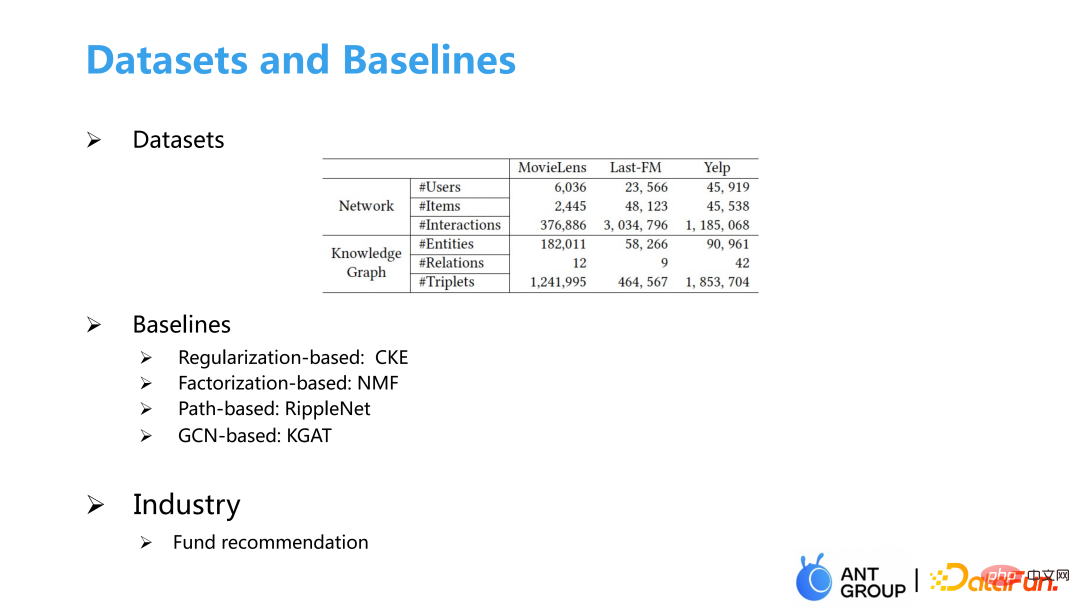
We selected some data sets of recommendation systems and knowledge graphs Regarding the fund recommendation data set of our business, the baseline mainly includes the regularization-based CKE method, the matrix decomposition-based NMF method, the Path-based heterogeneous graph method RippleNet and the GCN-based KGAT.
②Attention visualization
In the Knowledge attention on the left, the value on each edge is only related to the nodes at both ends. In the upper right corner, U532 and i The value on 1678 is very small, so it will not be easy to sample this edge later. The two users on the right are U0, but if the products are different, the weight of the entire image will be completely different. In predictionU0- i##2466 and U0-i 780, the weight of the rightmost path of the two graphs is completely different, and U0-i2466 The rightmost path of has a greater weight because in predicting U0- The rightmost path is more important for the correlation of i2466.
##③Model evaluation
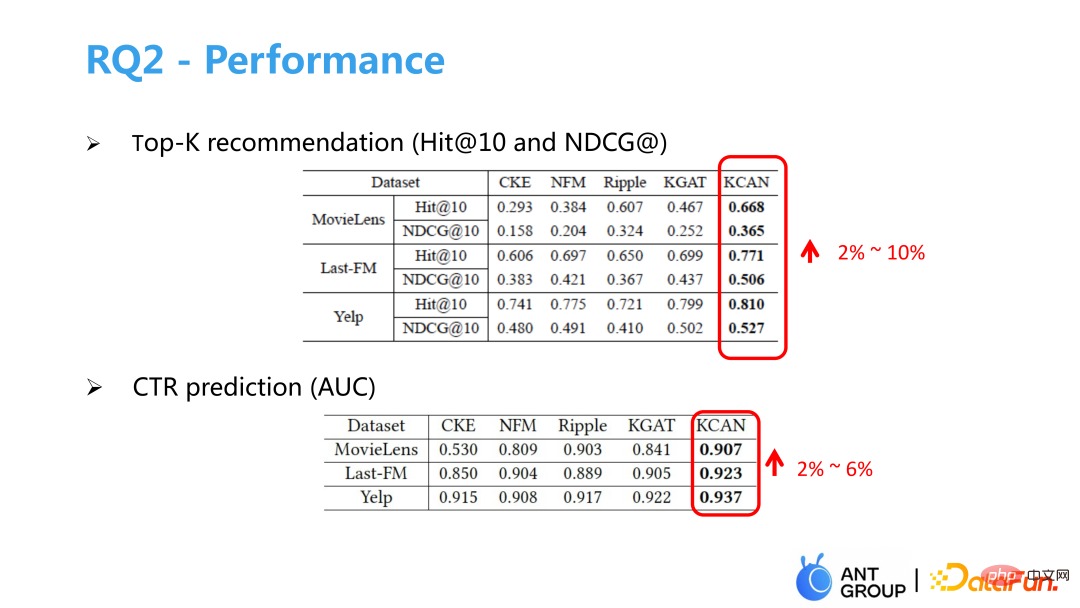 ##We measured the model effect on Top-K recommendation and CTR click tasks. Compared with the baseline model, both are greatly improved. We recommend funds online. /B testing experiments also bring improvements in performance. Finally, we conducted an ablation experiment, and the results showed that the effect of removing the conditional attention or knowledge attention model would decrease, proving the effectiveness of the improvements we made.
03
Social and text-based recommendationsWhat we have here is based on Social and text recommendation is not a recommendation scenario in the traditional sense. It is mainly to help operators understand user intentions and create some new content and new advertisements for users to guide user growth
# #. For example, how to design the cover of a girdle recommendation? Only after fully understanding the user's intentions can the operator design content that meets the user's psychological expectations. 1. Existing Challenges
A natural way is to use Topic Model measures the distribution of users to intentions and intentions to products. It treats users as a document and products as a word to decompose user intentions. But in fact, user clicks are sparse, especially when our target customers are low-active users, and product clicks follow a long-tail distribution, making it difficult to capture users' interests and intentions. 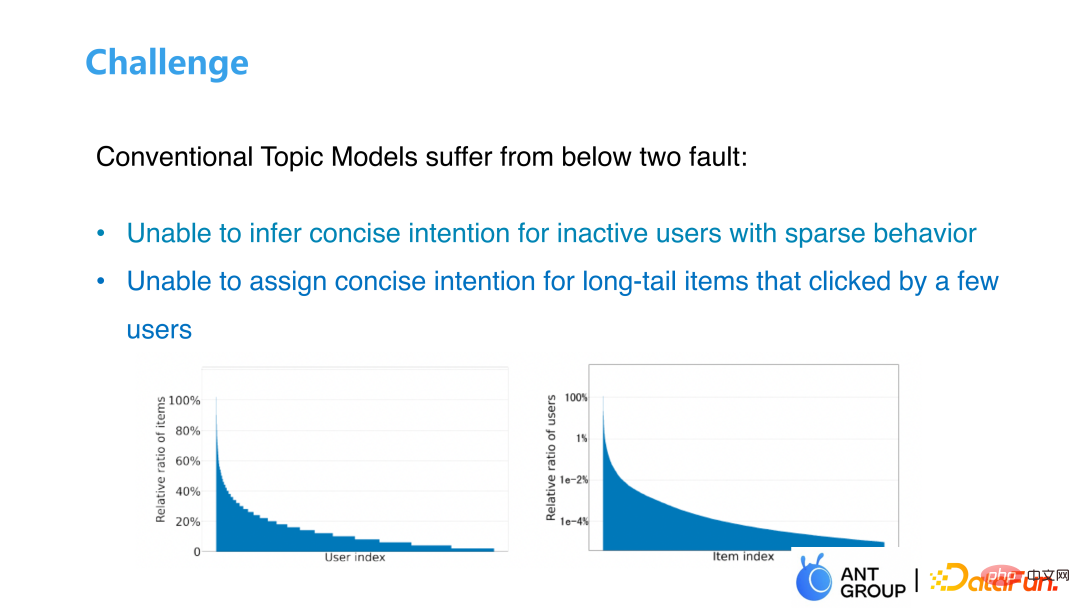
2. Solution
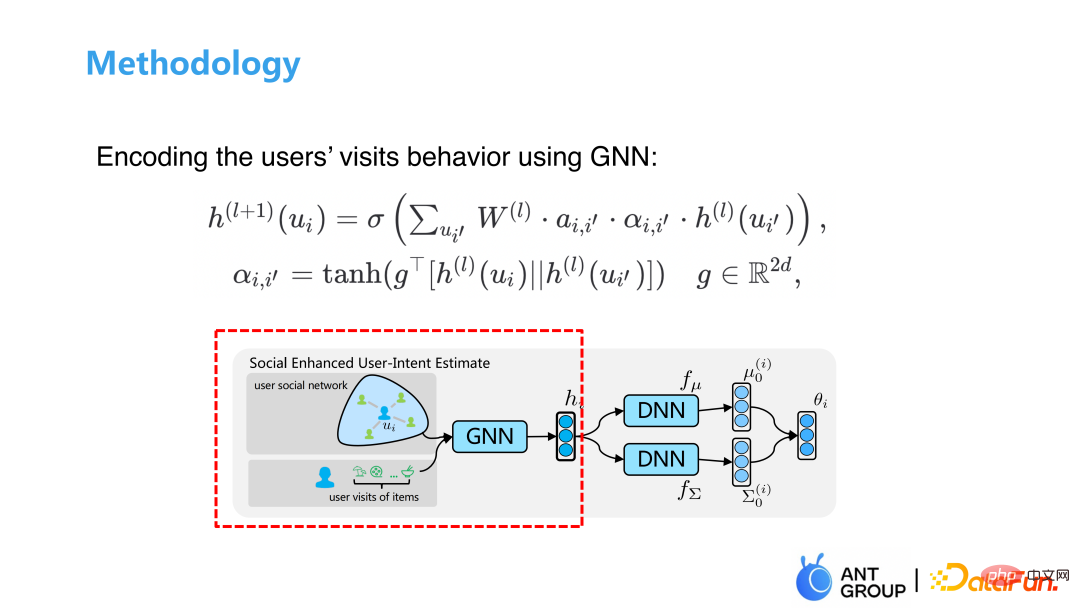
##First we combine both the UU relationship and the UI relationship Join GNN to learn and measure the user's click behavior. Then we make an approximation to the learned user-intention prior distribution. The prior distribution of the traditional Topic Model is a Dirichlet distribution. We use a The distribution of Logistic Normal looks very similar to the Dirichlet distribution, and the learning of this distribution can be made differentiable through some heavy parameterization work.
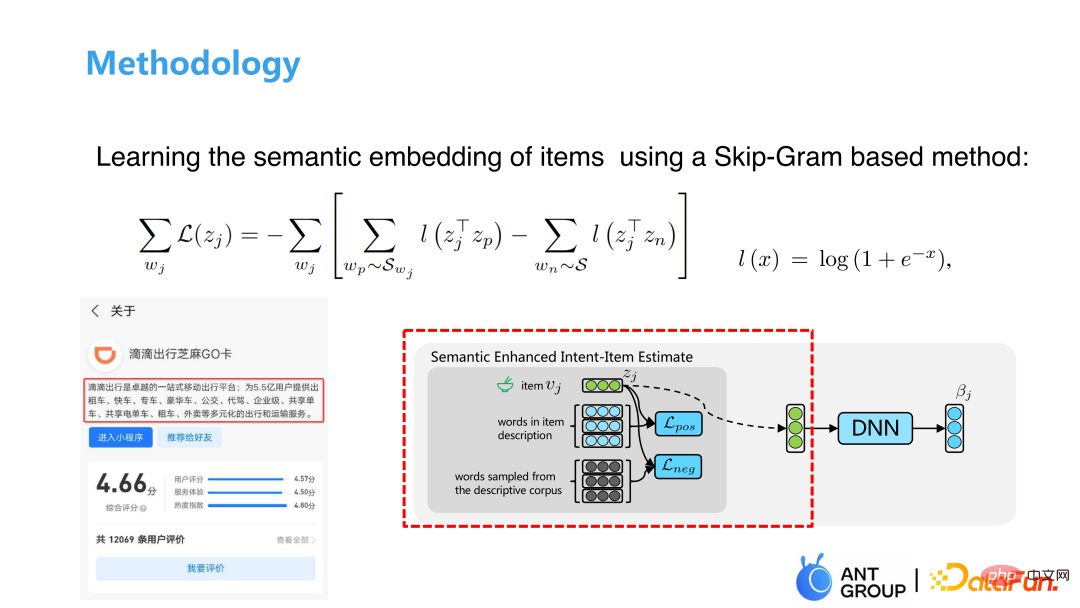
After learning the relationship between users, the next step is to learn the relationship between corpus. There is a small program in the picture above, which contains a text description. It uses the skip-gram model to calculate the similarity between the item and the positive and negative samples, obtains the similarity of the word, and maps the similarity of the word to the user intention representation through a DNN. , and finally the KL divergence constraint distribution is adjusted to the form we want.
3. Experimental results
#Our data set is the user’s click data for 7 consecutive days, including There are approximately 500,000 users, 9,206 items and 200 million users' historical click behaviors. The social network includes 7 million edges, and each user has an average of 14-15 neighbor nodes.
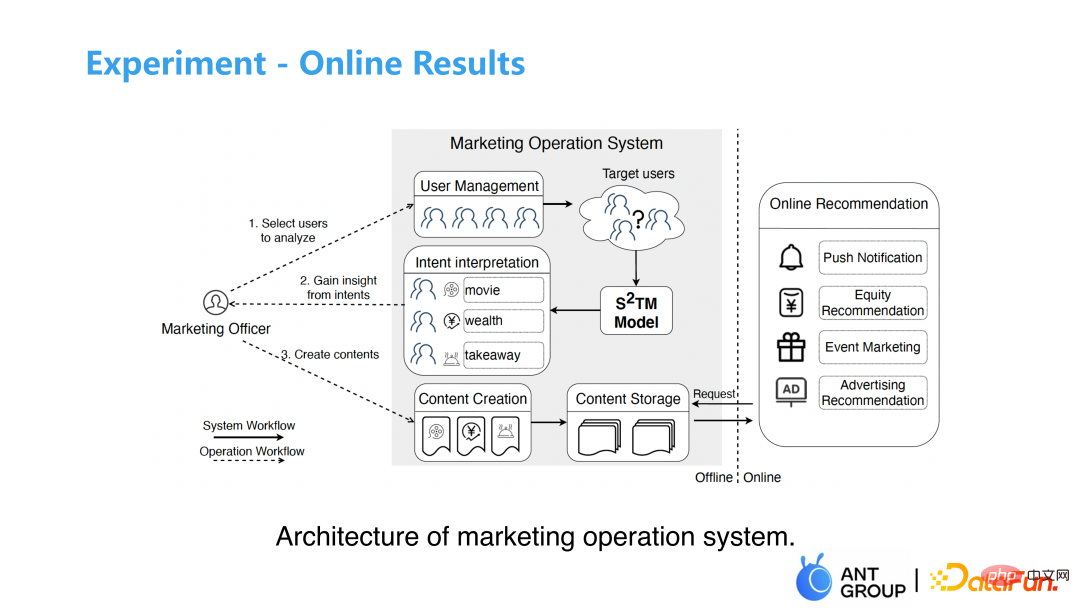
We conducted offline and online experimental tests respectively. The offline experiment measured the similarity between users under different numbers of topics. similarity between gender and semantics. Online experiments feed back to operations the user intentions predicted by our model, and operations design description texts and display pages based on user intentions to make online recommendations. The experimental link of the overall model may be relatively long, because some materials will be produced in the middle of the operation. The goal of the online A/B experiment is divided into two parts. One part is the operation to design materials based on our model feedback, and the other part is to use the experience of historical experts. output. Experimental results show that our model has been greatly improved in both offline and online experiments compared with before.
04Cross-domain recommendation
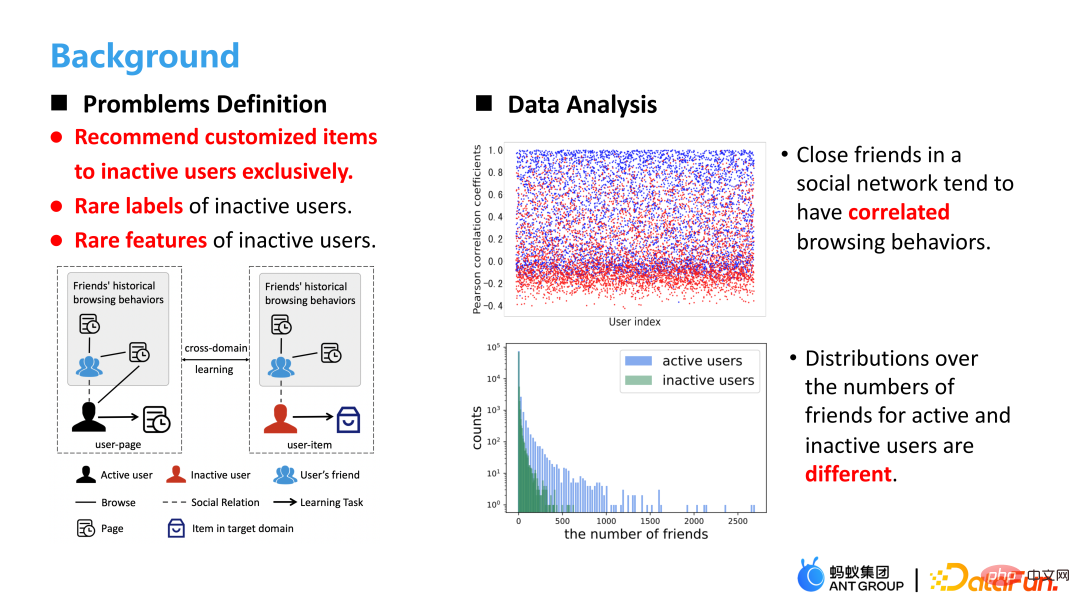
# #Our recommendation targets are low-active users. They may have no tags, no characteristics, or even have never used Alipay. In the above figure, we first analyzed the similarity between users, where blue represents behavioral similarity with strangers, and red represents behavioral similarity with friends. The results show that friends with closer relationships have a higher degree of behavioral overlap, so we The user's friend behavior information can be used as a supplement to the user's information. Then we analyzed the number of friends of active users and inactive users, and found that the number of friends of active users was much more than that of inactive users, so we wondered if we couldmigrate the click information of active users to their inactive friends Information comes up to assist with recommendations.
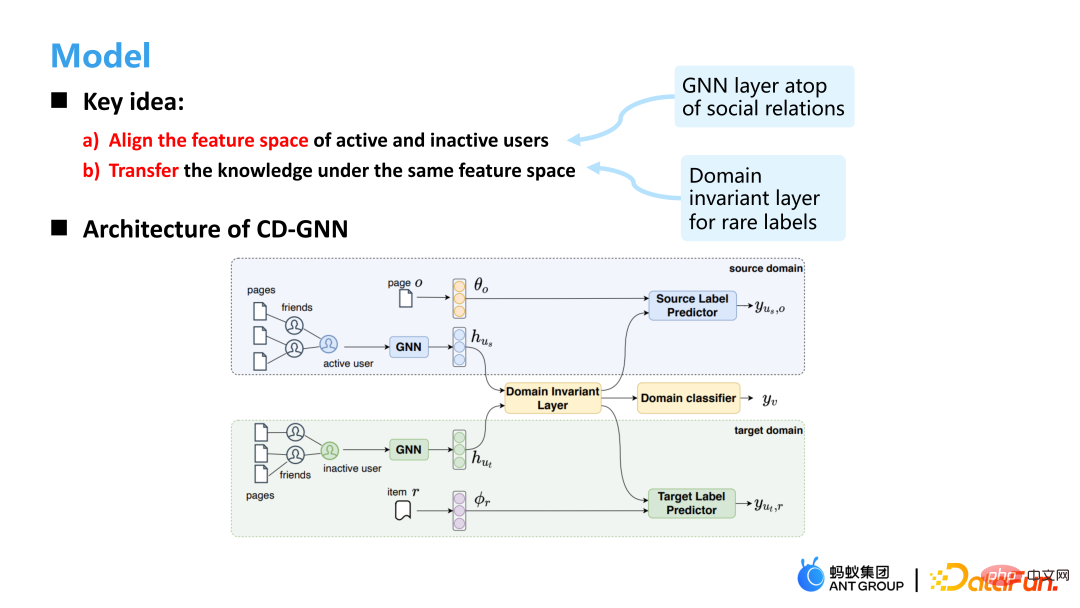
So our model A core idea is to align the feature spaces of active users and inactive users. Because inactive users are missing many features, so the characteristics of him and active users Space is inherently different. Here we use GNN to learn the user's representation and map the user's representation into a common space. As shown in the figure above, the upper layer of the structure of CD-GNN is an active user we want to predict, and the lower layer is an inactive user we want to predict. They are learned by two GNNs and then mapped to a shared user through a domain invariant layer. In terms of representation, a label prediction is made for both active users and inactive users.
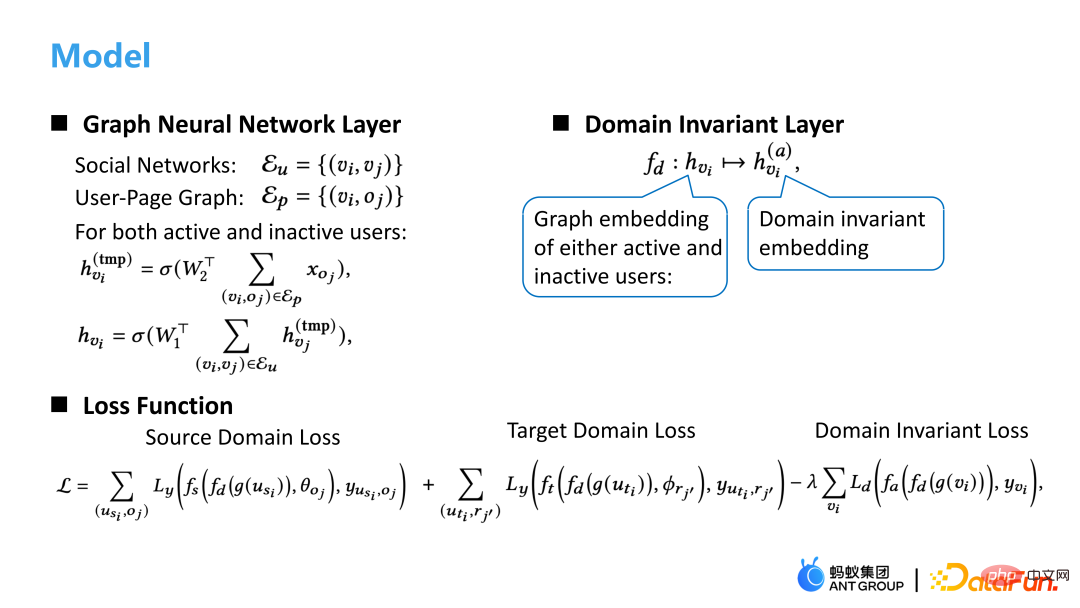
Specifically, the graph model includes the Social network and the User-Page network. It performs different aggregation on the two networks, and uses the Domain Invariant Layer to combine active users and Inactive users are mapped to the same space, and the final loss=Source loss Target loss-Domain invariant loss. The online A/B experimental results show that our model has greatly improved CTR compared to GCN, and our model can still achieve good results when the behavior is sparse.
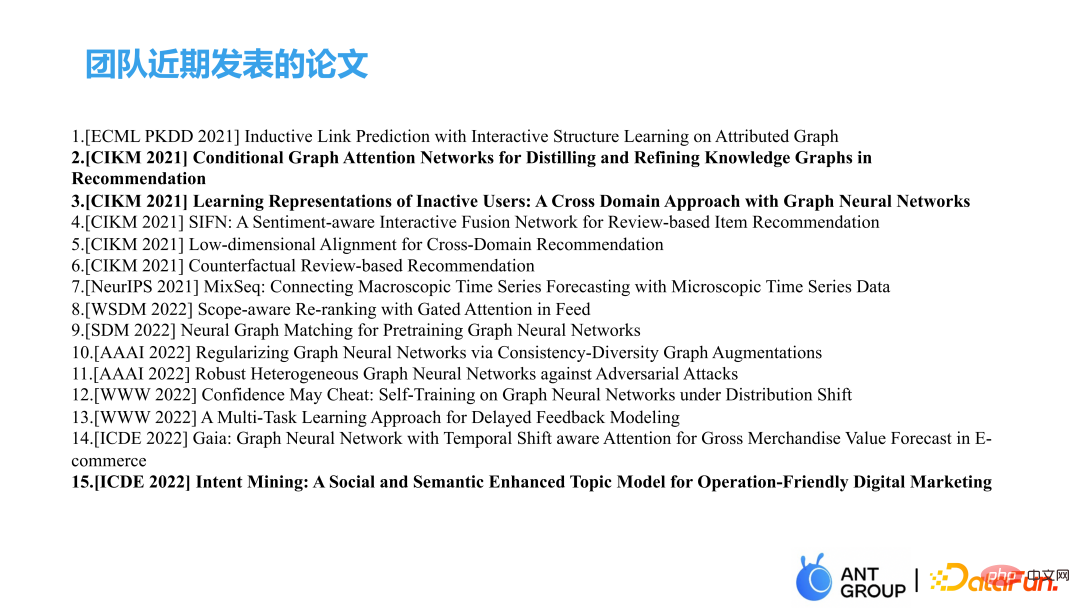
The above are some of the recent results published by our team. I am mainly talking about the work in the above three articles.
05Interactive Q&A
Q1: Parameters of CD-GNN layer Is it shared?
A1: It is not shared, because some characteristics of active users, such as ID characteristics, are much more than those of inactive users. The characteristics of both The distribution is not consistent, so we do not share it here.
#Q2: In the problem of cross-domain recommendation, the number of Target Labels of inactive users is very small, which causes the model to have difficulty learning the Target Embedding of inactive users. Poor, how should we consider this kind of issue?
A2: You can use some pre-trained methods to add some representation information in advance, or supplement the missing features through some methods. You can supplement the features while building the graph model, and supplement the features of neighbors instead of simply aggregating neighbor features. Adding loss similar to feature reconstruction may help solve this problem.
Q3: Was the first graph-based method implemented in the fine rehearsal scene? How many levels does the GNN in it generally achieve?
A3: Our fund recommendation section exposes only 5 funds to users. Unlike other scenarios where a list is recommended, there may be With hundreds of pieces of information, users can see these five funds at a glance, and the impact of rearrangement is not great. The results of our model are directly connected to the line, which is a refined model. Generally, two-stage GNN is used. The third-stage GNN does not improve much in some tasks, and the online delay is too long.
The above is the detailed content of Application of graph machine learning in Ant Group's recommendation business. For more information, please follow other related articles on the PHP Chinese website!

Hot AI Tools

Undresser.AI Undress
AI-powered app for creating realistic nude photos

AI Clothes Remover
Online AI tool for removing clothes from photos.

Undress AI Tool
Undress images for free

Clothoff.io
AI clothes remover

Video Face Swap
Swap faces in any video effortlessly with our completely free AI face swap tool!

Hot Article

Hot Tools

Notepad++7.3.1
Easy-to-use and free code editor

SublimeText3 Chinese version
Chinese version, very easy to use

Zend Studio 13.0.1
Powerful PHP integrated development environment

Dreamweaver CS6
Visual web development tools

SublimeText3 Mac version
God-level code editing software (SublimeText3)

Hot Topics
 This article will take you to understand SHAP: model explanation for machine learning
Jun 01, 2024 am 10:58 AM
In the fields of machine learning and data science, model interpretability has always been a focus of researchers and practitioners. With the widespread application of complex models such as deep learning and ensemble methods, understanding the model's decision-making process has become particularly important. Explainable AI|XAI helps build trust and confidence in machine learning models by increasing the transparency of the model. Improving model transparency can be achieved through methods such as the widespread use of multiple complex models, as well as the decision-making processes used to explain the models. These methods include feature importance analysis, model prediction interval estimation, local interpretability algorithms, etc. Feature importance analysis can explain the decision-making process of a model by evaluating the degree of influence of the model on the input features. Model prediction interval estimate
 Identify overfitting and underfitting through learning curves
Apr 29, 2024 pm 06:50 PM
This article will introduce how to effectively identify overfitting and underfitting in machine learning models through learning curves. Underfitting and overfitting 1. Overfitting If a model is overtrained on the data so that it learns noise from it, then the model is said to be overfitting. An overfitted model learns every example so perfectly that it will misclassify an unseen/new example. For an overfitted model, we will get a perfect/near-perfect training set score and a terrible validation set/test score. Slightly modified: "Cause of overfitting: Use a complex model to solve a simple problem and extract noise from the data. Because a small data set as a training set may not represent the correct representation of all data." 2. Underfitting Heru
 Transparent! An in-depth analysis of the principles of major machine learning models!
Apr 12, 2024 pm 05:55 PM
In layman’s terms, a machine learning model is a mathematical function that maps input data to a predicted output. More specifically, a machine learning model is a mathematical function that adjusts model parameters by learning from training data to minimize the error between the predicted output and the true label. There are many models in machine learning, such as logistic regression models, decision tree models, support vector machine models, etc. Each model has its applicable data types and problem types. At the same time, there are many commonalities between different models, or there is a hidden path for model evolution. Taking the connectionist perceptron as an example, by increasing the number of hidden layers of the perceptron, we can transform it into a deep neural network. If a kernel function is added to the perceptron, it can be converted into an SVM. this one
 The evolution of artificial intelligence in space exploration and human settlement engineering
Apr 29, 2024 pm 03:25 PM
In the 1950s, artificial intelligence (AI) was born. That's when researchers discovered that machines could perform human-like tasks, such as thinking. Later, in the 1960s, the U.S. Department of Defense funded artificial intelligence and established laboratories for further development. Researchers are finding applications for artificial intelligence in many areas, such as space exploration and survival in extreme environments. Space exploration is the study of the universe, which covers the entire universe beyond the earth. Space is classified as an extreme environment because its conditions are different from those on Earth. To survive in space, many factors must be considered and precautions must be taken. Scientists and researchers believe that exploring space and understanding the current state of everything can help understand how the universe works and prepare for potential environmental crises
 Implementing Machine Learning Algorithms in C++: Common Challenges and Solutions
Jun 03, 2024 pm 01:25 PM
Common challenges faced by machine learning algorithms in C++ include memory management, multi-threading, performance optimization, and maintainability. Solutions include using smart pointers, modern threading libraries, SIMD instructions and third-party libraries, as well as following coding style guidelines and using automation tools. Practical cases show how to use the Eigen library to implement linear regression algorithms, effectively manage memory and use high-performance matrix operations.
 Five schools of machine learning you don't know about
Jun 05, 2024 pm 08:51 PM
Machine learning is an important branch of artificial intelligence that gives computers the ability to learn from data and improve their capabilities without being explicitly programmed. Machine learning has a wide range of applications in various fields, from image recognition and natural language processing to recommendation systems and fraud detection, and it is changing the way we live. There are many different methods and theories in the field of machine learning, among which the five most influential methods are called the "Five Schools of Machine Learning". The five major schools are the symbolic school, the connectionist school, the evolutionary school, the Bayesian school and the analogy school. 1. Symbolism, also known as symbolism, emphasizes the use of symbols for logical reasoning and expression of knowledge. This school of thought believes that learning is a process of reverse deduction, through existing
 Is Flash Attention stable? Meta and Harvard found that their model weight deviations fluctuated by orders of magnitude
May 30, 2024 pm 01:24 PM
MetaFAIR teamed up with Harvard to provide a new research framework for optimizing the data bias generated when large-scale machine learning is performed. It is known that the training of large language models often takes months and uses hundreds or even thousands of GPUs. Taking the LLaMA270B model as an example, its training requires a total of 1,720,320 GPU hours. Training large models presents unique systemic challenges due to the scale and complexity of these workloads. Recently, many institutions have reported instability in the training process when training SOTA generative AI models. They usually appear in the form of loss spikes. For example, Google's PaLM model experienced up to 20 loss spikes during the training process. Numerical bias is the root cause of this training inaccuracy,
 Explainable AI: Explaining complex AI/ML models
Jun 03, 2024 pm 10:08 PM
Translator | Reviewed by Li Rui | Chonglou Artificial intelligence (AI) and machine learning (ML) models are becoming increasingly complex today, and the output produced by these models is a black box – unable to be explained to stakeholders. Explainable AI (XAI) aims to solve this problem by enabling stakeholders to understand how these models work, ensuring they understand how these models actually make decisions, and ensuring transparency in AI systems, Trust and accountability to address this issue. This article explores various explainable artificial intelligence (XAI) techniques to illustrate their underlying principles. Several reasons why explainable AI is crucial Trust and transparency: For AI systems to be widely accepted and trusted, users need to understand how decisions are made


