Ten Python libraries for explainable AI
The goal of XAI is to provide meaningful explanations for the behavior and decisions of the model. This article compiles the 10 Python libraries currently available for explainable AI
What is XAI?
XAI, Explainable AI refers to systems or strategies that can provide clear and understandable explanations for artificial intelligence (AI) decision-making processes and predictions. The goal of XAI is to provide meaningful explanations for their actions and decisions, which helps increase trust, provide accountability, and transparency in model decisions. XAI is not limited to interpretation, but also conducts ML experiments in a way that makes inferences easier to extract and interpret for users.
In practice, XAI can be achieved through a variety of methods, such as using feature importance measures, visualization techniques, or by building models that are inherently interpretable, such as decision trees or linear regression models. The choice of method depends on the type of problem being solved and the level of interpretability required.
AI systems are used in a growing number of applications, including healthcare, finance and criminal justice, where the potential impact of AI on people’s lives is high and where decisions are made with the understanding The specific reason is crucial. Because the cost of wrong decisions in these areas is high (the stakes are high), XAI is becoming increasingly important, as even decisions made by AI need to be carefully checked for validity and explainability.
Steps in explainability practice
Data preparation: This stage includes the collection and processing of data. Data should be high quality, balanced, and representative of the real-world problem being solved. Having balanced, representative, clean data reduces future efforts to keep AI explainable.
Model training: The model is trained on prepared data, either a traditional machine learning model or a deep learning neural network. The choice of model depends on the problem to be solved and the level of interpretability required. The simpler the model, the easier it is to interpret the results, but the performance of simple models will not be very high.
Model evaluation: Choosing appropriate evaluation methods and performance metrics is necessary to maintain the interpretability of the model. It is also important to assess the interpretability of the model at this stage to ensure that it can provide meaningful explanations for its predictions.
Explanation generation: This can be done using various techniques, such as feature importance measures, visualization techniques, or by building inherently explainable models.
Explanation verification: Verify the accuracy and completeness of the explanations generated by the model. This helps ensure that the explanation is believable.
Deployment and Monitoring: The work of XAI does not end with model creation and validation. It requires ongoing explainability work after deployment. When monitoring in a real environment, it is important to regularly evaluate the performance and interpretability of the system.
1. SHAP (SHapley Additive exPlanations)
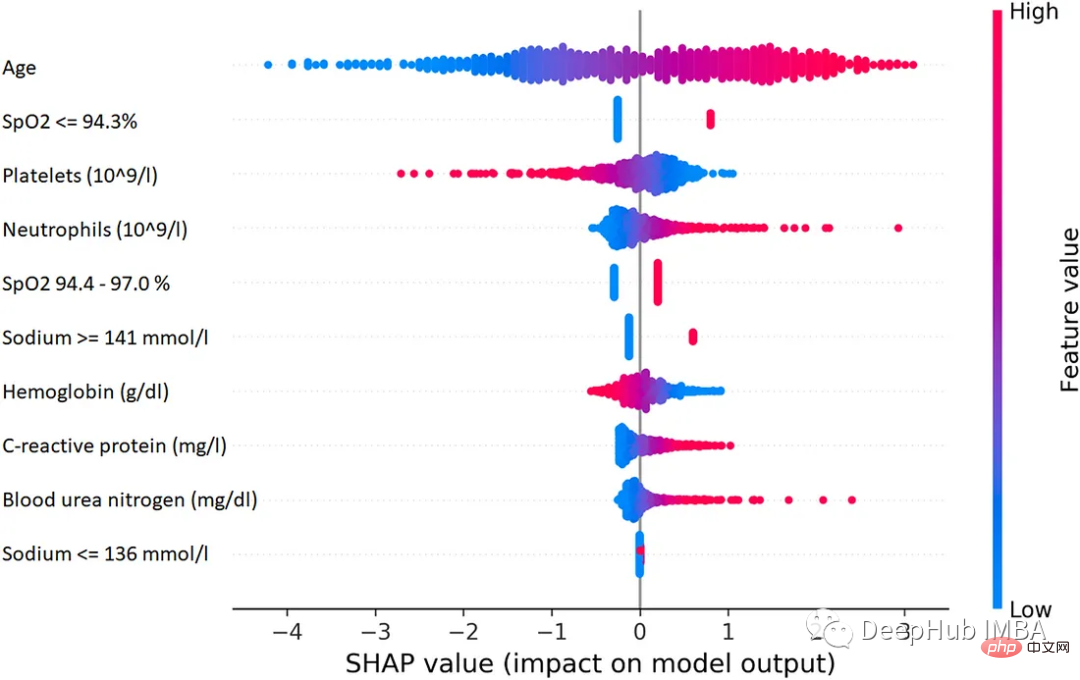
SHAP is a game theory method that can be used to explain the output of any machine learning model. It uses the classic Shapley value from game theory and its related extensions to relate optimal credit allocation to local interpretations.
2. LIME (Local Interpretable Model-agnostic Explanations)
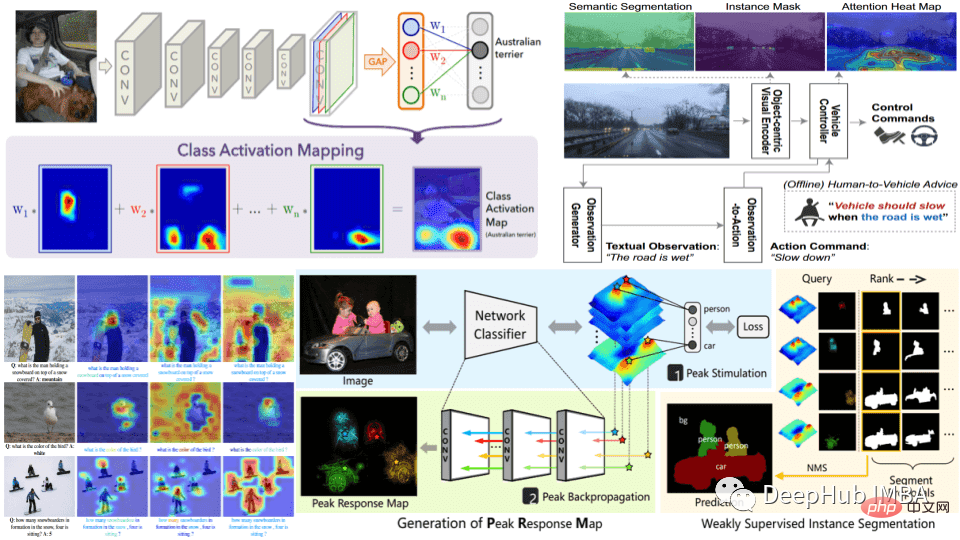
LIME is a model-independent method that locally approximates specific predictions by surrounding them Model behavior to work with. LIME attempts to explain what a machine learning model is doing. LIME supports interpreting individual predictions for text classifiers, classifiers for tabular data, or images.

3. Eli5
ELI5 is a Python package that helps debug machine learning classifiers and interpret their predictions. It provides support for the following machine learning frameworks and packages:
- scikit-learn: ELI5 can interpret the weights and predictions of scikit-learn linear classifiers and regressors, and decision trees can be printed as text or SVG that shows feature importance and explains predictions from decision trees and tree ensembles. ELI5 also understands text handlers in scikit-learn and highlights text data accordingly.
- Keras - Visual interpretation of image classifier predictions via Grad-CAM.
- XGBoost - Shows feature importance and explains the predictions of XGBClassifier, XGBRegressor and XGBoost .boost.
- LightGBM - Shows feature importance and explains the predictions of LGBMClassifier and LGBMRegressor.
- CatBoost: Displays the feature importance of CatBoostClassifier and CatBoostRegressor.
- lightning - Interprets the weights and predictions of lightning classifiers and regressors.
- sklearn-crfsuite. ELI5 allows checking the weights of the sklearn_crfsuite.CRF model.
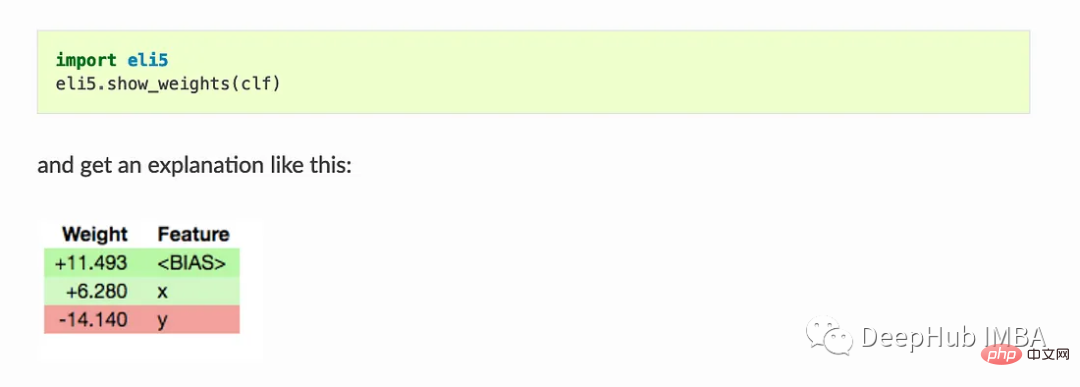
Basic usage:
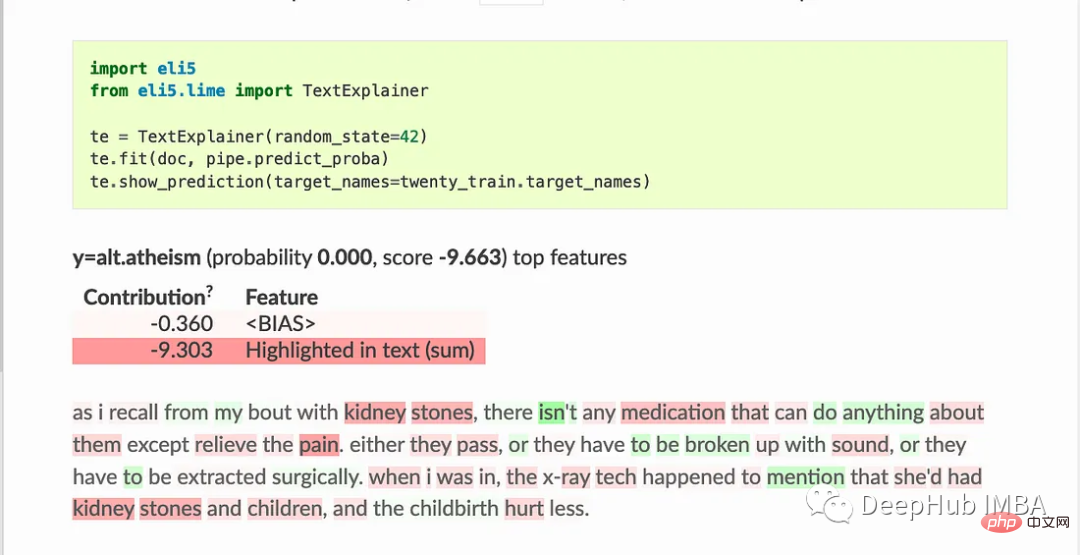
Show_weights() displays all weights of the model, Show_prediction() can be used to check the individual predictions of the model
ELI5 also implements some algorithms for checking black-box models:
TextExplainer uses the LIME algorithm to explain the predictions of any text classifier. The permutation importance method can be used to calculate feature importance for black-box estimators.
4. Shapash
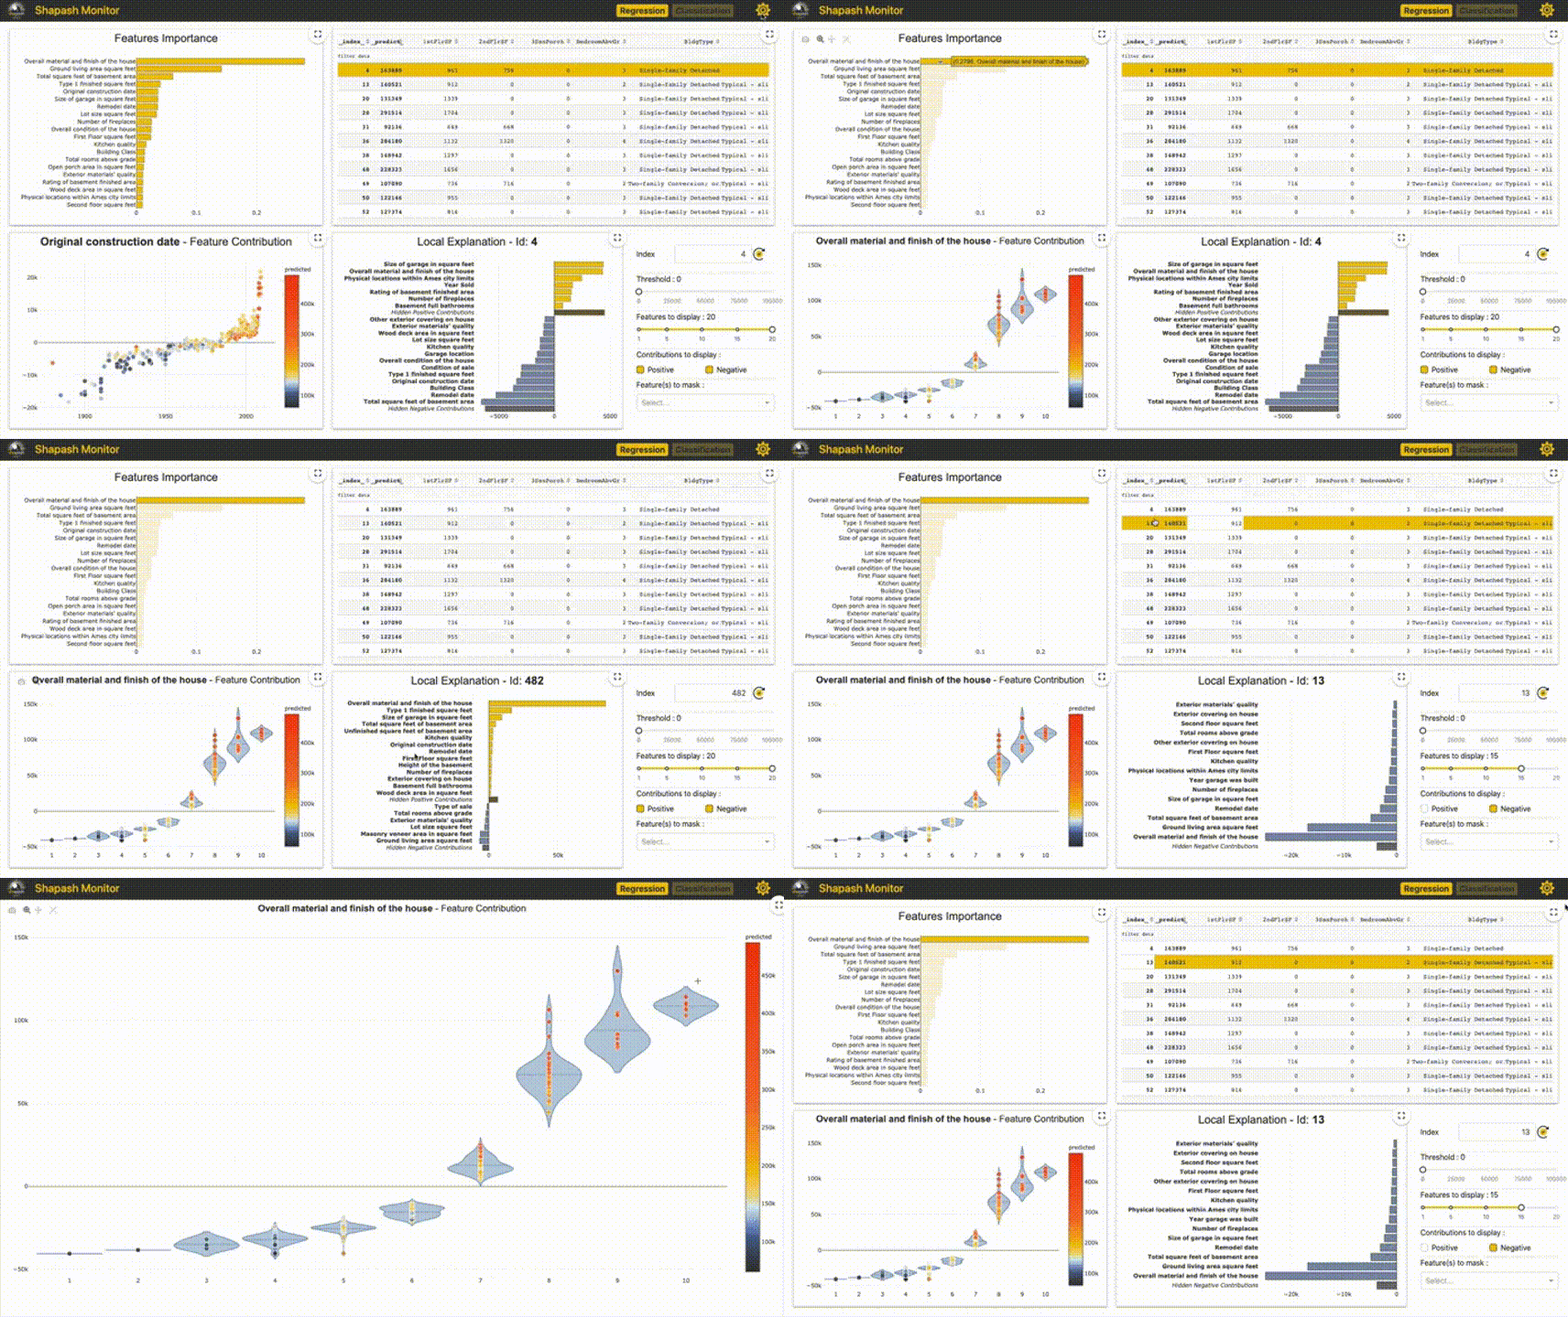
Shapash provides several types of visualizations to make it easier to understand the model. Use the summary to understand the decisions proposed by the model. This project is developed by MAIF data scientists. Shapash mainly explains the model through a set of excellent visualizations.
Shapash works through the web application mechanism and can be perfectly integrated with Jupyter/ipython.
from shapash import SmartExplainer

 xpl = SmartExplainer(
 model=regressor,
 preprocessing=encoder, # Optional: compile step can use inverse_transform method
 features_dict=house_dict# Optional parameter, dict specifies label for features name
 )

 xpl.compile(x=Xtest,
y_pred=y_pred,
y_target=ytest, # Optional: allows to display True Values vs Predicted Values
)

xpl.plot.contribution_plot("OverallQual")5. Anchors
Anchors explain the behavior of complex models using high-precision rules called anchor points, which represent local "sufficient" prediction conditions. The algorithm can efficiently compute the explanation of any black-box model with high probability guarantees.
Anchors can be thought of as LIME v2, where some limitations of LIME (such as the inability to fit models for invisible instances of the data) have been corrected. Anchors use local areas rather than each individual viewpoint. It is computationally lightweight than SHAP and therefore can be used with high-dimensional or large data sets. But some limitations are that labels can only be integers.

6. BreakDown
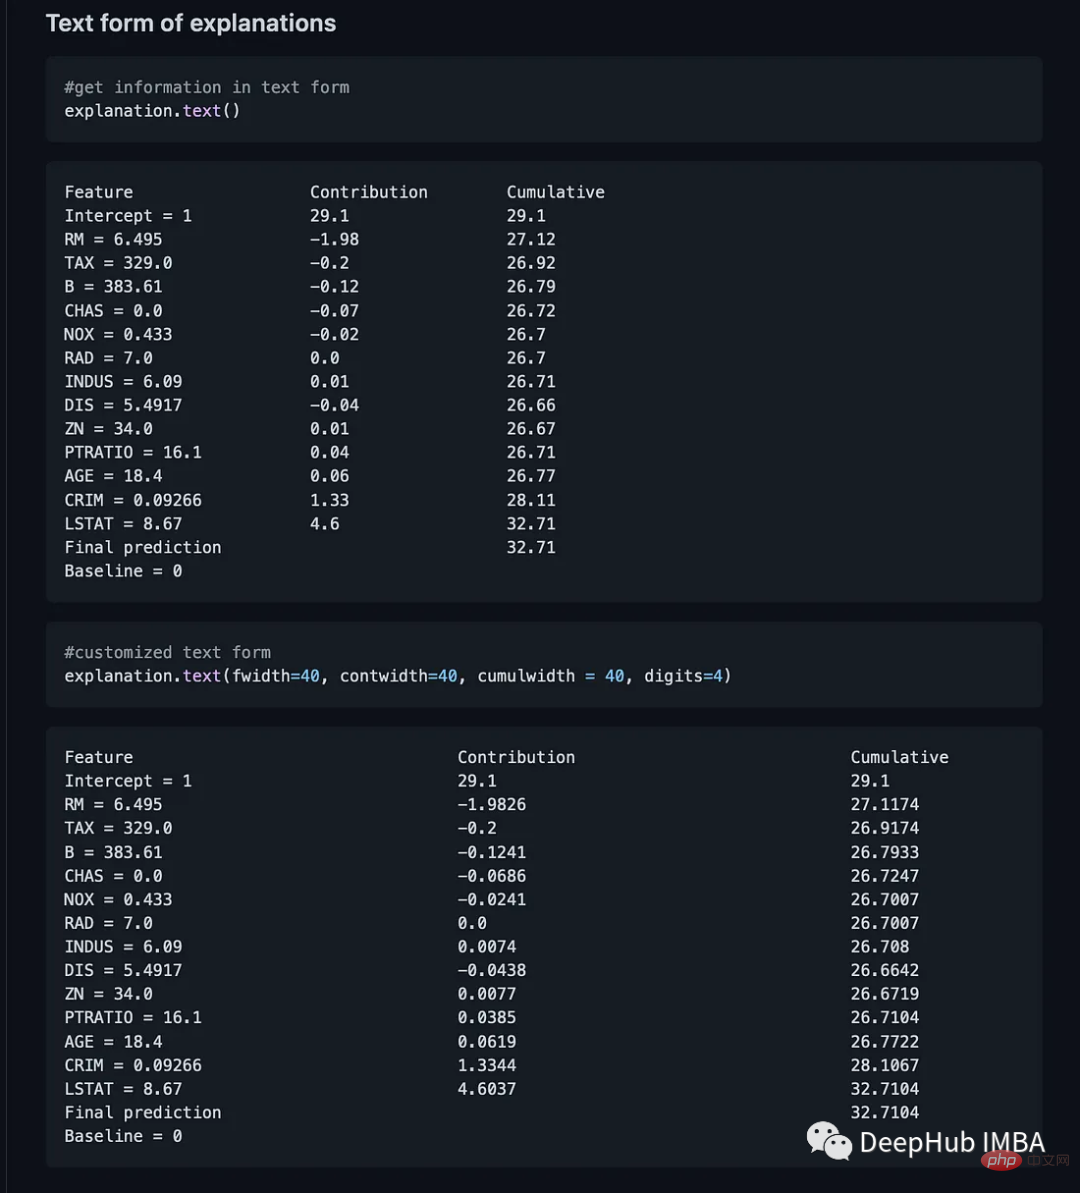
BreakDown is a tool that can be used to explain linear model predictions. It works by decomposing the model's output into the contribution of each input feature. There are two main methods in this package. Explainer() and Explanation()
model = tree.DecisionTreeRegressor()
 model = model.fit(train_data,y=train_labels)

 #necessary imports
 from pyBreakDown.explainer import Explainer
 from pyBreakDown.explanation import Explanation

 #make explainer object
 exp = Explainer(clf=model, data=train_data, colnames=feature_names)

 #What do you want to be explained from the data (select an observation)
 explanation = exp.explain(observation=data[302,:],direction="up")
7, Interpret-Text
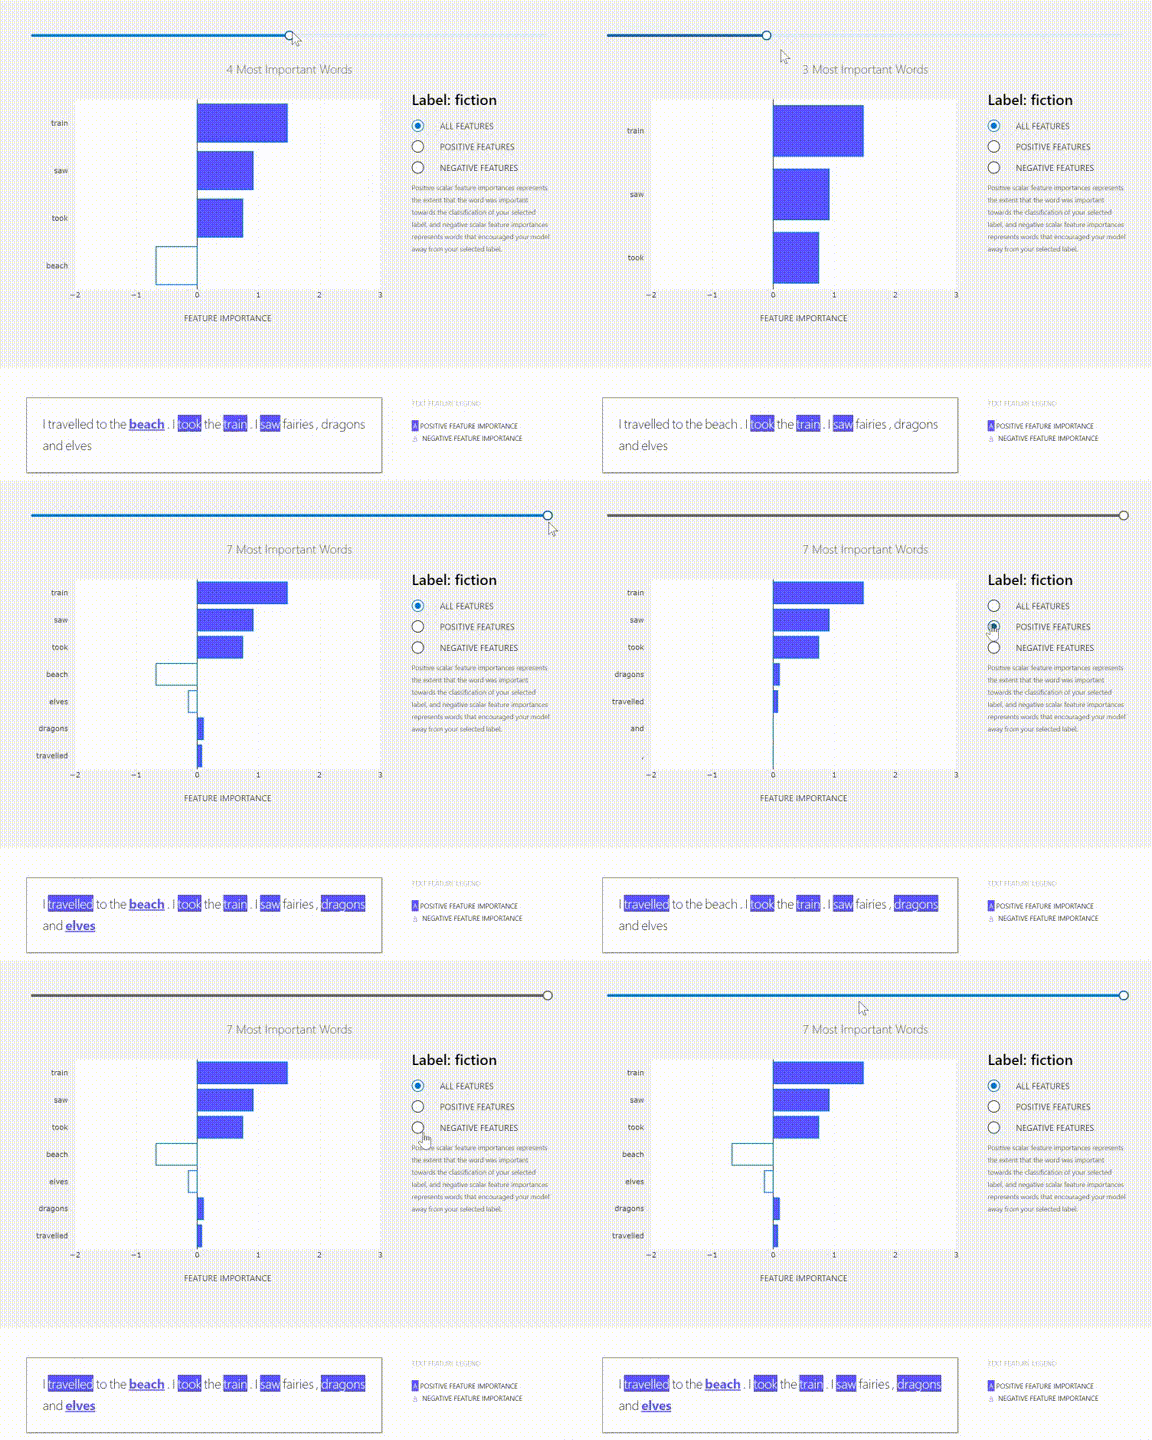
Interpret-Text combines community development for NLP models Interpretability techniques and visualization panels for viewing results. Experiments can be run on multiple state-of-the-art interpreters and analyzed comparatively. This toolkit can interpret machine learning models globally on each tag or locally on each document.
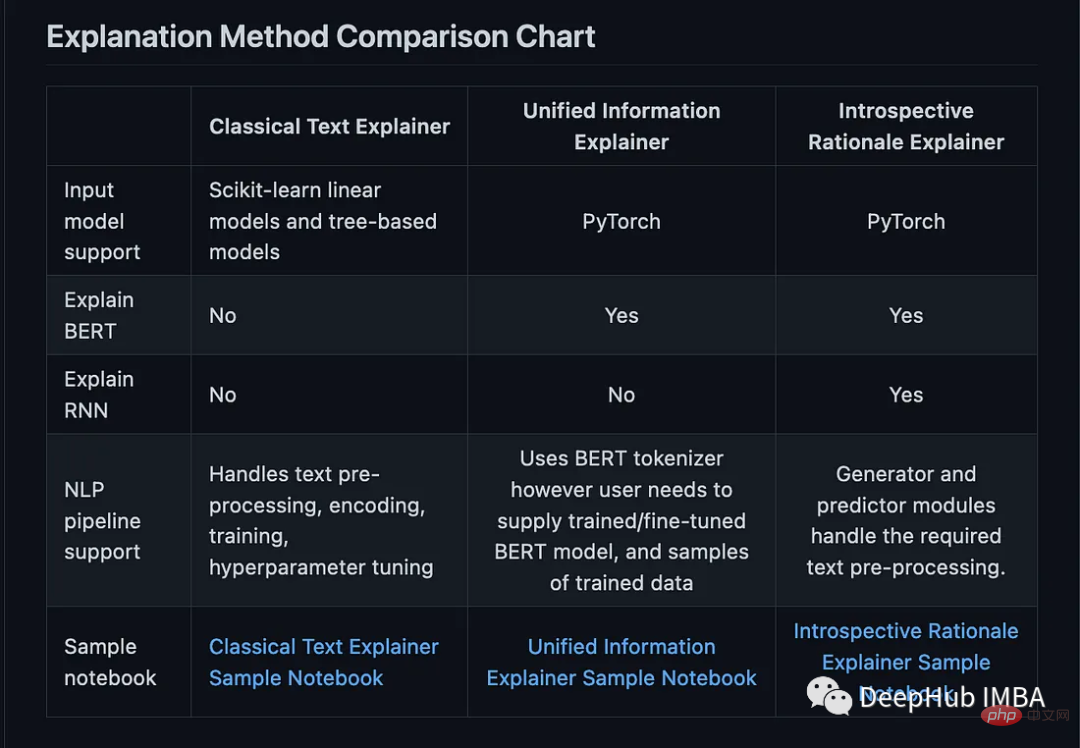
The following is a list of interpreters available in this package:
- Classical Text Explainer - (Default: bag of words for logistic regression)
- Unified Information Explainer
- Introspective Rationale Explainer
from interpret_text.widget import ExplanationDashboard
 from interpret_text.explanation.explanation import _create_local_explanation

 # create local explanation
 local_explanantion = _create_local_explanation(
 classification=True,
 text_explanation=True,
 local_importance_values=feature_importance_values,
 method=name_of_model,
 model_task="classification",
 features=parsed_sentence_list,
 classes=list_of_classes,
 )
 # Dash it
 ExplanationDashboard(local_explanantion)
- Towards Robust Interpretability with Self-Explaining Neural Networks, 2018. ref
- Boolean Decision Rules via Column Generation, 2018. ref
- Explanations Based on the Missing: Towards Contrastive Explanations with Pertinent Negatives, 2018. ref
- Improving Simple Models with Confidence Profiles, , 2018. ref
- Efficient Data Representation by Selecting Prototypes with Importance Weights, 2019. ref
- TED: Teaching AI to Explain Its Decisions, 2019. ref
- Variational Inference of Disentangled Latent Concepts from Unlabeled Data, 2018. ref
- Generating Contrastive Explanations with Monotonic Attribute Functions, 2019. ref
- Generalized Linear Rule Models, 2019. ref
9、OmniXAI
OmniXAI (Omni explable AI的缩写),解决了在实践中解释机器学习模型产生的判断的几个问题。
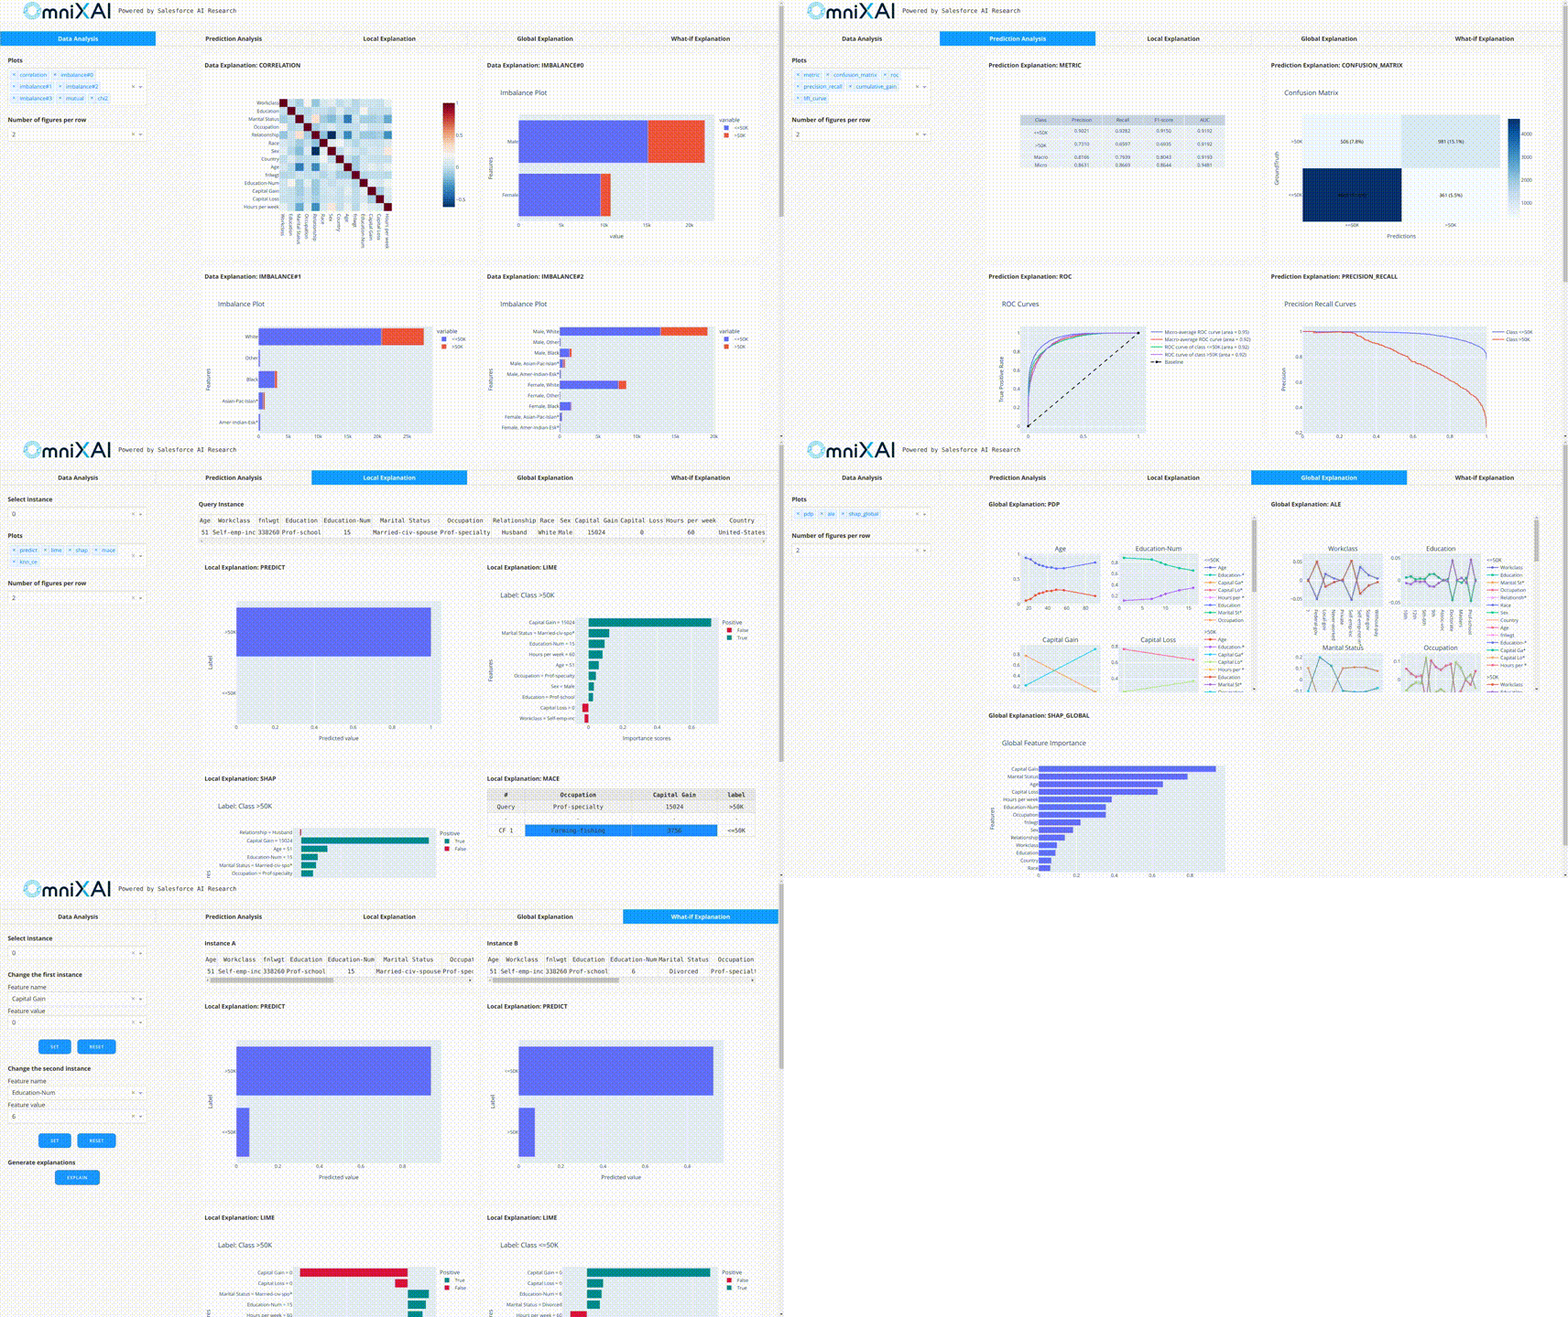
它是一个用于可解释AI (XAI)的Python机器学习库,提供全方位的可解释AI和可解释机器学习功能,并能够解决实践中解释机器学习模型所做决策的许多痛点。OmniXAI旨在成为一站式综合库,为数据科学家、ML研究人员和从业者提供可解释的AI。
from omnixai.visualization.dashboard import Dashboard
 # Launch a dashboard for visualization
 dashboard = Dashboard(
instances=test_instances,# The instances to explain
local_explanations=local_explanations, # Set the local explanations
global_explanations=global_explanations, # Set the global explanations
prediction_explanations=prediction_explanations, # Set the prediction metrics
class_names=class_names, # Set class names
explainer=explainer# The created TabularExplainer for what if analysis
 )
 dashboard.show()
10、XAI (eXplainable AI)
XAI 库由 The Institute for Ethical AI & ML 维护,它是根据 Responsible Machine Learning 的 8 条原则开发的。它仍处于 alpha 阶段因此请不要将其用于生产工作流程。
The above is the detailed content of Ten Python libraries for explainable AI. For more information, please follow other related articles on the PHP Chinese website!

Hot AI Tools

Undresser.AI Undress
AI-powered app for creating realistic nude photos

AI Clothes Remover
Online AI tool for removing clothes from photos.

Undress AI Tool
Undress images for free

Clothoff.io
AI clothes remover

AI Hentai Generator
Generate AI Hentai for free.

Hot Article

Hot Tools

Notepad++7.3.1
Easy-to-use and free code editor

SublimeText3 Chinese version
Chinese version, very easy to use

Zend Studio 13.0.1
Powerful PHP integrated development environment

Dreamweaver CS6
Visual web development tools

SublimeText3 Mac version
God-level code editing software (SublimeText3)

Hot Topics
 Is the conversion speed fast when converting XML to PDF on mobile phone?
Apr 02, 2025 pm 10:09 PM
The speed of mobile XML to PDF depends on the following factors: the complexity of XML structure. Mobile hardware configuration conversion method (library, algorithm) code quality optimization methods (select efficient libraries, optimize algorithms, cache data, and utilize multi-threading). Overall, there is no absolute answer and it needs to be optimized according to the specific situation.
 Is there any mobile app that can convert XML into PDF?
Apr 02, 2025 pm 08:54 PM
An application that converts XML directly to PDF cannot be found because they are two fundamentally different formats. XML is used to store data, while PDF is used to display documents. To complete the transformation, you can use programming languages and libraries such as Python and ReportLab to parse XML data and generate PDF documents.
 How to convert XML files to PDF on your phone?
Apr 02, 2025 pm 10:12 PM
It is impossible to complete XML to PDF conversion directly on your phone with a single application. It is necessary to use cloud services, which can be achieved through two steps: 1. Convert XML to PDF in the cloud, 2. Access or download the converted PDF file on the mobile phone.
 What is the function of C language sum?
Apr 03, 2025 pm 02:21 PM
There is no built-in sum function in C language, so it needs to be written by yourself. Sum can be achieved by traversing the array and accumulating elements: Loop version: Sum is calculated using for loop and array length. Pointer version: Use pointers to point to array elements, and efficient summing is achieved through self-increment pointers. Dynamically allocate array version: Dynamically allocate arrays and manage memory yourself, ensuring that allocated memory is freed to prevent memory leaks.
 How to control the size of XML converted to images?
Apr 02, 2025 pm 07:24 PM
To generate images through XML, you need to use graph libraries (such as Pillow and JFreeChart) as bridges to generate images based on metadata (size, color) in XML. The key to controlling the size of the image is to adjust the values of the <width> and <height> tags in XML. However, in practical applications, the complexity of XML structure, the fineness of graph drawing, the speed of image generation and memory consumption, and the selection of image formats all have an impact on the generated image size. Therefore, it is necessary to have a deep understanding of XML structure, proficient in the graphics library, and consider factors such as optimization algorithms and image format selection.
 How to open xml format
Apr 02, 2025 pm 09:00 PM
Use most text editors to open XML files; if you need a more intuitive tree display, you can use an XML editor, such as Oxygen XML Editor or XMLSpy; if you process XML data in a program, you need to use a programming language (such as Python) and XML libraries (such as xml.etree.ElementTree) to parse.
 How to convert xml into pictures
Apr 03, 2025 am 07:39 AM
XML can be converted to images by using an XSLT converter or image library. XSLT Converter: Use an XSLT processor and stylesheet to convert XML to images. Image Library: Use libraries such as PIL or ImageMagick to create images from XML data, such as drawing shapes and text.
 Recommended XML formatting tool
Apr 02, 2025 pm 09:03 PM
XML formatting tools can type code according to rules to improve readability and understanding. When selecting a tool, pay attention to customization capabilities, handling of special circumstances, performance and ease of use. Commonly used tool types include online tools, IDE plug-ins, and command-line tools.


