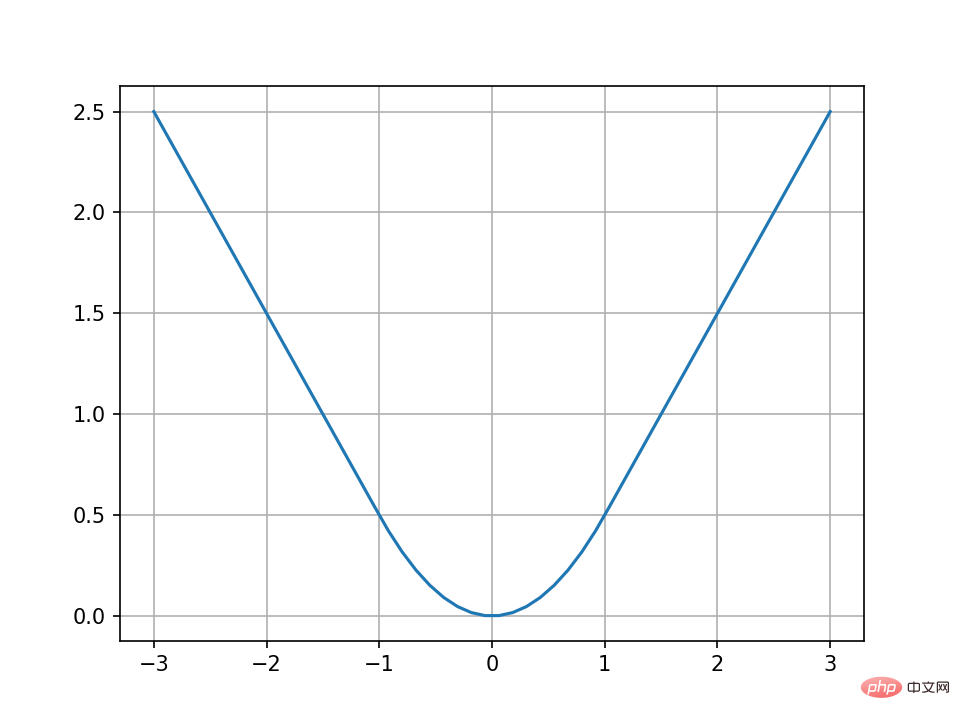
The details are as follows:

How to draw the piecewise function as shown in the figure above in Python?
import matplotlib.pyplot as plt
import numpy as np
def f(x):
    if x <= -1:
        return -0.5 - x
    if -1 < x <= 1:
        return 0.5 * (x ** 2)
    else:
        return x - 0.5
x = np.linspace(-3, 3)
y = []
for i in x:
    y_1 = f(i)
    y.append(y_1)
plt.plot(x, y)
plt.grid()
plt.show()
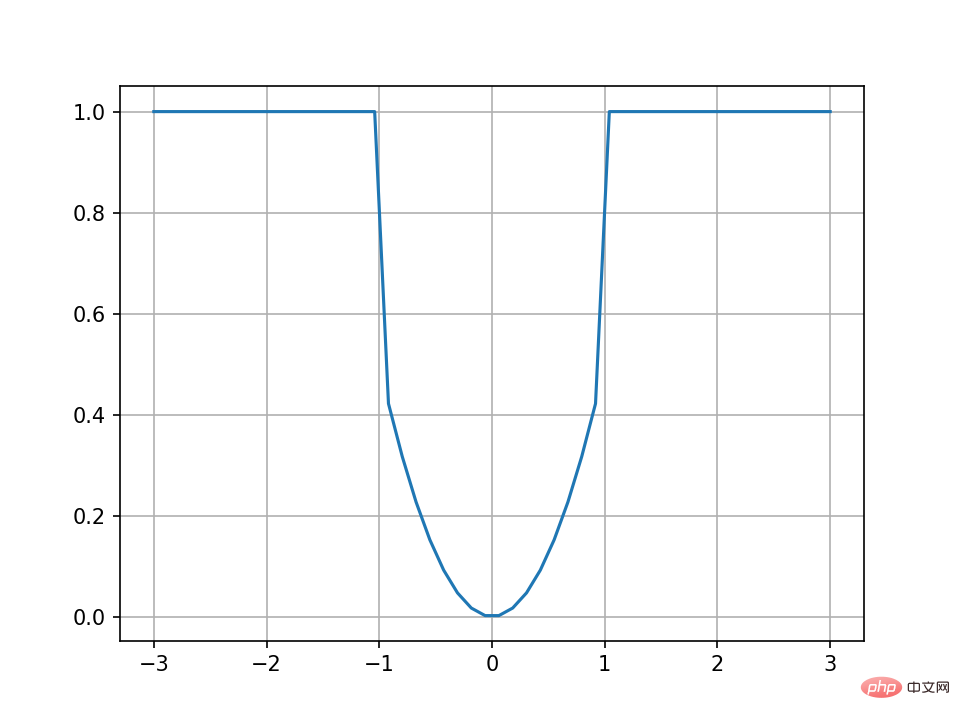
Let’s change the example:
import matplotlib.pyplot as plt
import numpy as np
def f(x):
    if x <= -1:
        return 1
    if -1 < x <= 1:
        return 0.5 * (x ** 2)
    else:
        return 1
x = np.linspace(-3, 3)
y = []
for i in x:
    y_1 = f(i)
    y.append(y_1)
y_2 = x ** 2
plt.plot(x, y)
plt.grid()
plt.show()The result is displayed as:

The above is the detailed content of How to plot piecewise functions using Python. For more information, please follow other related articles on the PHP Chinese website!


