

Easily build a tree heat map with one line of Python code


Today I will learn a visualization technology with you: building a treemap treemap. Tree diagrams are easy to visualize and easy to understand. Treemaps convey different sizes of data by displaying rectangles of different sizes. It is generally believed that larger rectangles represent a large part of the whole, while smaller rectangles represent a small part of the whole. In this article, Yun Duojun will learn with you how to use the Squarify library to build a tree diagram in Python.
Introduction
Dendrograms use rectangles of different sizes nested together to visualize hierarchical data. The size of each rectangle is proportional to the overall amount of data it represents. These nested rectangles represent the branches of the tree, hence the name. In addition to size, each rectangle has a unique color that represents a unique category. Treemaps are widely used in industries ranging from financial institutions to sales organizations.
The tree diagram was first invented in the early 1990s by Professor Ben Shneiderman of the Human-Computer Interaction Laboratory at the University of Maryland. The idea behind this visualization is to compare quantities by size in a fixed space. Now, we'll look at how to actually build a word cloud.
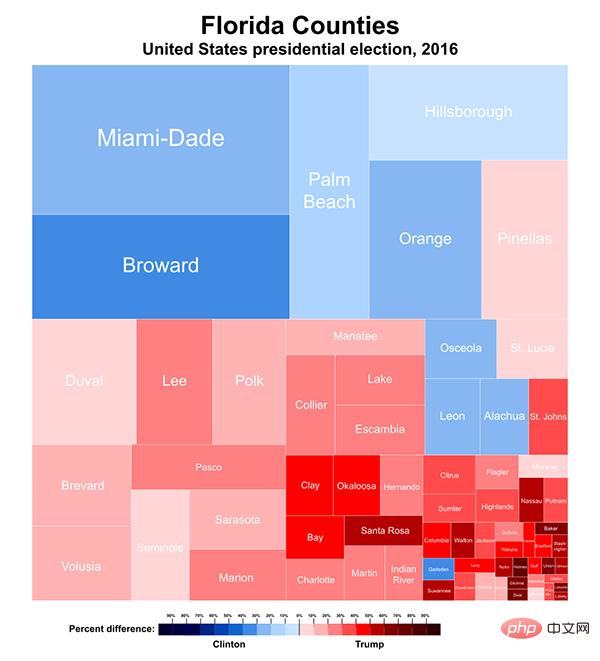
Florida dendrogram source: https://commons.wikimedia.org
Build dendrogram using Squarify
In Python, you can use Squarify to build dendrograms directly. And it can be easily constructed with only one line of code squarify.plot(data).
1. Install the necessary libraries
!pip install squarify
2. Import the necessary libraries
import matplotlib.pyplot as plt
import squarify
3. Create random data
Randomly generate a list of values, these The values will be passed into our plot as data.
data = [500, 250, 60, 120]
4. Draw a dendrogram
Use the **squarify.plot()** method to construct a dendrogram. Here, the random data variable data is used as a parameter of this squarify.plot method. Additionally, append a line of decorator code plt.axis('off') to hide the axes of the dendrogram.
squarify.plot(data)
plt.axis('off')
plt.show()
5. Putting them together
import matplotlib.pyplot as plt
import squarify
data = [500, 250, 60, 120]
squarify.plot(data)
plt.axis('off')
plt.show()
When executing this code, we get:

Every time this code is executed , it generates a set of nested rectangles of random colors.
Using additional parameters
With the help of the parameters of the .plot() method, more modifications can be added to the dendrogram. The color, label, and fill of the treemap can be controlled by explicitly specifying properties.
1. Specify the color of the dendrogram
import matplotlib.pyplot as plt
import squarify
sizes = [500, 250, 120, 60]
color = ['red', 'green', 'blue', 'orange']
squarify.plot(sizes,color=color)
plt.axis('off')
plt.show()
When executing this code, we get:

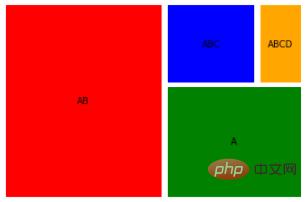
2. Give the dendrogram Plot Adding Labels
Different label values can be added explicitly by passing a list to the labels property of squarify.plot(). This will overwrite existing tags or add the tag to our dendrogram if it doesn't exist yet. Labels will be added to the dendrogram in the same order as in the list passed to .plot().
import matplotlib.pyplot as plt
import squarify
labels = ['A', 'AB', 'ABC', 'ABCD']
sizes = [500, 250, 120, 60]
color = ['red', 'green', 'blue', 'orange']
squarify.plot(sizes,color=color, label = labels)
plt.axis('off')
plt.show()
When executing this code, we get:
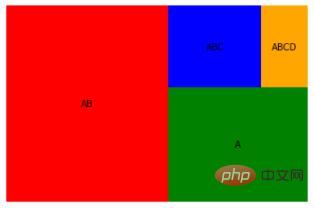
3. The pad
in the dendrogram can be found in the dendrogram Add pads to separate each rectangle from each other in the treemap. This will help distinguish the rectangles better. This is useful when there are a large number of categories or rectangles. Can be called by setting the pad parameter to True.
import matplotlib.pyplot as plt
import squarify
labels = ['AB', 'A', 'ABC', 'ABCD']
sizes = [500, 250, 120, 60]
color = ['red', 'green', 'blue', 'orange']
squarify.plot(sizes,color=color, label = labels, pad = True)
plt.axis('off')
plt.show()
When executing the code, we get:
Written at the end
From this point of view, building a tree diagram can be said to be A piece of cake. In addition to the squarify library, dendrograms can be built using several other libraries in Python. Such as the popular plotly library. In today’s second tweet, its application cases are introduced, interested friends can take a look.
import plotly_express as px
import plotly.graph_objects as go
px.treemap(names = name, parents = parent)
go.Figure(go.Treemap(labels = name, parents = parent,))
Of course, there are many BI tools that can be used to build tree diagrams more conveniently and simply.
Sometimes, ambiguities can occur in the dendrogram. If there are multiple categories with the same number (or rectangle size) and the same shade of color, it ends up being difficult for the user to differentiate between them. So when building a dendrogram, you must always consider the number of categories involved and the color mapping.
The above is the detailed content of Easily build a tree heat map with one line of Python code. For more information, please follow other related articles on the PHP Chinese website!

Hot AI Tools

Undresser.AI Undress
AI-powered app for creating realistic nude photos

AI Clothes Remover
Online AI tool for removing clothes from photos.

Undress AI Tool
Undress images for free

Clothoff.io
AI clothes remover

AI Hentai Generator
Generate AI Hentai for free.

Hot Article
Hot Tools

Notepad++7.3.1
Easy-to-use and free code editor

SublimeText3 Chinese version
Chinese version, very easy to use

Zend Studio 13.0.1
Powerful PHP integrated development environment

Dreamweaver CS6
Visual web development tools

SublimeText3 Mac version
God-level code editing software (SublimeText3)
Hot Topics
 1378
1378
 52
52

 The 2-Hour Python Plan: A Realistic Approach
Apr 11, 2025 am 12:04 AM
The 2-Hour Python Plan: A Realistic Approach
Apr 11, 2025 am 12:04 AM
You can learn basic programming concepts and skills of Python within 2 hours. 1. Learn variables and data types, 2. Master control flow (conditional statements and loops), 3. Understand the definition and use of functions, 4. Quickly get started with Python programming through simple examples and code snippets.
 How to read redis queue
Apr 10, 2025 pm 10:12 PM
How to read redis queue
Apr 10, 2025 pm 10:12 PM
To read a queue from Redis, you need to get the queue name, read the elements using the LPOP command, and process the empty queue. The specific steps are as follows: Get the queue name: name it with the prefix of "queue:" such as "queue:my-queue". Use the LPOP command: Eject the element from the head of the queue and return its value, such as LPOP queue:my-queue. Processing empty queues: If the queue is empty, LPOP returns nil, and you can check whether the queue exists before reading the element.
 How to view server version of Redis
Apr 10, 2025 pm 01:27 PM
How to view server version of Redis
Apr 10, 2025 pm 01:27 PM
Question: How to view the Redis server version? Use the command line tool redis-cli --version to view the version of the connected server. Use the INFO server command to view the server's internal version and need to parse and return information. In a cluster environment, check the version consistency of each node and can be automatically checked using scripts. Use scripts to automate viewing versions, such as connecting with Python scripts and printing version information.
 How to start the server with redis
Apr 10, 2025 pm 08:12 PM
How to start the server with redis
Apr 10, 2025 pm 08:12 PM
The steps to start a Redis server include: Install Redis according to the operating system. Start the Redis service via redis-server (Linux/macOS) or redis-server.exe (Windows). Use the redis-cli ping (Linux/macOS) or redis-cli.exe ping (Windows) command to check the service status. Use a Redis client, such as redis-cli, Python, or Node.js, to access the server.
 How to set the Redis memory size according to business needs?
Apr 10, 2025 pm 02:18 PM
How to set the Redis memory size according to business needs?
Apr 10, 2025 pm 02:18 PM
Redis memory size setting needs to consider the following factors: data volume and growth trend: Estimate the size and growth rate of stored data. Data type: Different types (such as lists, hashes) occupy different memory. Caching policy: Full cache, partial cache, and phasing policies affect memory usage. Business Peak: Leave enough memory to deal with traffic peaks.
 What is the impact of Redis persistence on memory?
Apr 10, 2025 pm 02:15 PM
What is the impact of Redis persistence on memory?
Apr 10, 2025 pm 02:15 PM
Redis persistence will take up extra memory, RDB temporarily increases memory usage when generating snapshots, and AOF continues to take up memory when appending logs. Influencing factors include data volume, persistence policy and Redis configuration. To mitigate the impact, you can reasonably configure RDB snapshot policies, optimize AOF configuration, upgrade hardware and monitor memory usage. Furthermore, it is crucial to find a balance between performance and data security.
 Python vs. C : Applications and Use Cases Compared
Apr 12, 2025 am 12:01 AM
Python vs. C : Applications and Use Cases Compared
Apr 12, 2025 am 12:01 AM
Python is suitable for data science, web development and automation tasks, while C is suitable for system programming, game development and embedded systems. Python is known for its simplicity and powerful ecosystem, while C is known for its high performance and underlying control capabilities.
 What are the Redis memory configuration parameters?
Apr 10, 2025 pm 02:03 PM
What are the Redis memory configuration parameters?
Apr 10, 2025 pm 02:03 PM
**The core parameter of Redis memory configuration is maxmemory, which limits the amount of memory that Redis can use. When this limit is exceeded, Redis executes an elimination strategy according to maxmemory-policy, including: noeviction (directly reject write), allkeys-lru/volatile-lru (eliminated by LRU), allkeys-random/volatile-random (eliminated by random elimination), and volatile-ttl (eliminated by expiration time). Other related parameters include maxmemory-samples (LRU sample quantity), rdb-compression
