How to print stack information to hprof file
Run the program to increase VM parameters:
-XX:+HeapDumpOnOutOfMemoryError # 会打印出现内存溢出异常时,Dump出当前内存堆转存快找以便分析
Step 1:
In the command line interface, execute the following command, where java_pid73912.hprof is the file name
jhat java_pid73912.hprof
The execution of the command will output
Reading from java_pid73912.hprof...Dump file created Thu Apr 08 22:18:08 CST 2021Snapshot read, resolving...Resolving 818890 objects...Chasing references, expect 163 dots...................................................................................................................................................................Eliminating duplicate references...................................................................................................................................................................Snapshot resolved.Started HTTP server on port 7000Server is ready.
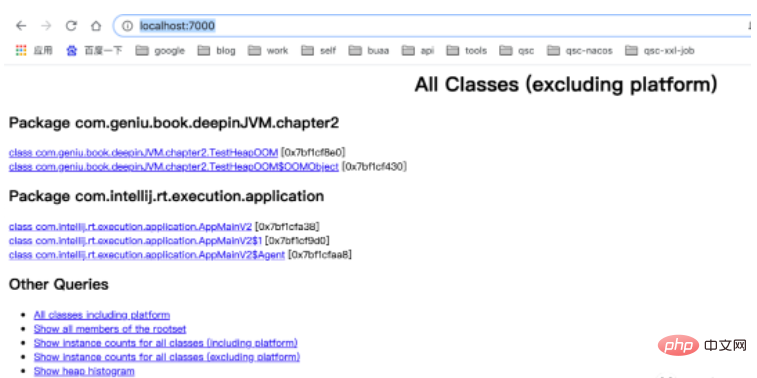
When you see that Server is ready., you can access it through the ip port address browser. I am local here, so it is localhost:7000

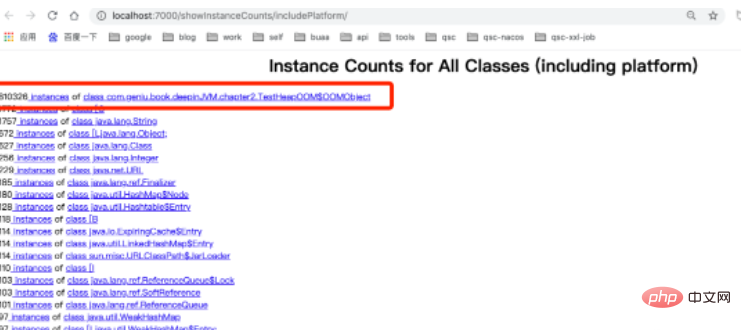
ClickShow instance counts for all classes (including platform)Will display information about classes including platform

ClickShow instance counts for all classes (excluding platform)will display information about all classes excluding platform

You can view it The class that takes up the most space here is class com.geniu.book.deepinJVM.chapter2.TestHeapOOM$OOMObject with more than 800,000 instances.
In this way, you can analyze the object status in the memory and analyze abnormal situations when a memory overflow occurs.
Other suggestions:
1) Use the idea plug-in JProfiler
2) The minidump_stackwalk tool can read dump files
The above is the detailed content of How to analyze Java heap dump (hprof) file on Mac platform?. For more information, please follow other related articles on the PHP Chinese website!


