

What does linux core mean?

In Linux, Core means memory. When an exception is detected while the program is running and the program exits abnormally, the system stores the current memory status of the program in a core file, called core dumped, which is also an information dump; when the operating system detects an exception in the current process, it will use a signal Notify the target process of the corresponding error information. Common signals include SIGSEGV, SIGBUS, etc. By default, the process has a corresponding processing mechanism when it receives the corresponding signal.

#The operating environment of this tutorial: linux7.3 system, Dell G3 computer.
When developing under Linux, we often hear programmers say that the core of my program has dropped. Usually, such problems occur due to low-level bugs such as memory access out of bounds, use of null pointers, stack overflow, etc. If the program exits or terminates abnormally during running, core files will be generated when these conditions are met.
Why does Coredump happen
Core means memory. This word comes from the material used to make memory a long time ago and has been used until Now, when an exception is detected while the program is running and the program exits abnormally, the system stores the current memory status of the program in a core file, called core dumped, which is also Information dump. The operating system detects the current When the process is abnormal, the target process will be notified of the corresponding error information through signals. Common signals include SIGSEGV, SIGBUS, etc. By default, the process will have corresponding processing mechanisms for receiving corresponding signals.
Taking Linux as an example, Action corresponds to the signal processing method, and the red box is marked as a common signal

It is best to understand it before doing this Regarding the memory layout of the process, the process space layout of Unix and Linux systems will be slightly different. The kernel space will be smaller than Linux, especially the kernel and user processes adopt separate address space mode. Here is Linux as an example:
The storage location of the coredump file
We know that in the Linux system, if the process crashes, the system kernel will capture the process crash information , and then write the coredump information of the process to the file. The file name defaults to core. The storage location is in the same directory as the corresponding executable program. The file name is core. You can see the location of the core file through the following command:
The format of Core_pattern:
%p PID of the dump process
%u (number) Actual UID of the dump process
%G (number) dump The actual GID of the process
%s The number of signals that caused the dump
%t The dump time, expressed as the number of seconds since January 1, 1970 00:00:00 0000 (UTC)
% H Host name (same as the node name returned by uname(2))
%e Executable file name (no path prefix)
%E Path name of the executable file, replaced with slash ('/') for the exclamation mark ('!').
%C Core file size soft resource limit for crash process (since Linux 2.6.24)
The following program can be used to demonstrate the pipe syntax in the /proc/sys/kernel/core_pattern file usage.
#include <sys/stat.h>
#include <fcntl.h>
#include <limits.h>
#include <stdio.h>
#include <stdlib.h>
#include <unistd.h>

#define BUF_SIZE 1024

int main(int argc, char *argv[])
{
    int tot, j;
    ssize_t nread;
    char buf[BUF_SIZE];
    FILE *fp;
    char cwd[PATH_MAX];

   /* 属性的当前工作目录崩溃的过程*/

    snprintf(cwd, PATH_MAX, "/proc/%s/cwd", argv[1]);
    chdir(cwd);

   /* 将输出写到该目录下的文件"core.info" */

    fp = fopen("core.info", "w+");
	if (fp == NULL)
	{
		exit(EXIT_FAILURE);
	}


   fprintf(fp, "argc=%d\n", argc);
    for (j = 0; j < argc; j++)
	{
        fprintf(fp, "argc[%d]=<%s>\n", j, argv[j]);
	}

   /* 计算标准输入(核心转储)中的字节数*/

    tot = 0;
    while ((nread = read(STDIN_FILENO, buf, BUF_SIZE)) > 0)
	{
        tot += nread;
	}

    fprintf(fp, "Total bytes in core dump: %d\n", tot);

   return 0;
}注意一下: 这里是指在进程当前工作目录的下创建。通常与程序在相同的路径下。但如果程序中调用了chdir函数,则有可能改变了当前工作目录。这时core文件创建在chdir指定的路径下。有好多程序崩溃了,我们却找不到core文件放在什么位置。和chdir函数就有关系。当然程序崩溃了不一定都产生 core文件。
下面通过的命令可以更改coredump文件的存储位置,如下:
echo “|$PWD/core_pattern_pipe_test %p UID=%u GID=%g sig=%s” >
/proc/sys/kernel/core_pattern
cat /proc/sys/kernel/core_pattern 查看路径已经变为如下:

下面带大家配置永久的core。只要出现内存访问越界、使用空指针、堆栈溢出等情况,都可以在这个目录下查看。
配置 core
1、首先在根目录下建立一个储存coredump文件的文件夹,命令如下:
mkdir /corefile
2、设置产生coredump文件的大小,命令如下:
ulimit -c unlimited
3、 执行以下两条命令:
echo “1” > /proc/sys/kernel/core_uses_pid       //将1写入到该文件里
echo “/corefile/core-%e-%p-%t” > /proc/sys/kernel/core_pattern
将coredump产生的格式制定好写入core_pattern文件,这样当coredump产生时会直接以这种格式存入到根目录下的文件夹corefile中。
4、修改配置文件/etc/profile
vim /etc/profile
添加 ulimit -S -c unlimited > /dev/null 2>&1

执行命令生效该文件
5、 在配置文件/etc/rc.local中最后面添加信息(机器重启时会自动加载该命令):添加命令:
rm -rf /corefile/*
机器重启时清空该文件夹,由于产生的coredump文件很大,若不清空的话时间长了会将硬盘占满;
再执行以下两条命令:
echo “1” > /proc/sys/kernel/core_uses_pid
echo “/corefile/core-%e-%p-%t” > /proc/sys/kernel/core_pattern
测试
下面写个例子测试一下是否配置好了corefile文件
#include
编译运行,注意这里需要-g选项编译。

进入前面创建的corefile文件夹:
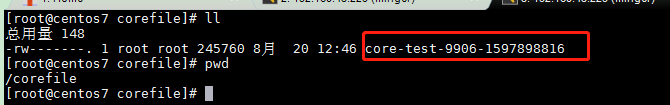
出现core文件表示完成coredump配置。可以用通过readelf命令进行判断是否是core文件:

Run gdb to read the core file. The command is "gdb program corresponds to coredump file". At this time, you will enter the gdb prompt "(gdb)".
#As you can see from the red box screenshot, the program terminates because of signal 11.
You can see the call stack of the function through the bt(backtrace) command (or where):

That is, a segfault occurs when the program is executed to line 6 of test.cpp. The reason is that it points to a null pointer.
Summary
There are many reasons for program coredump. Here is a summary, mainly memory access out of bounds, use of thread-unsafe functions, Using null pointers, stack overflow, etc.
I want to say here that when debugging coredump with gdb, most of the time you can only find out the intuitive reason for the core from the core file, but the more fundamental reason generally needs to be combined with the code to analyze the running of the process at that time. Only through contextual scenarios can we infer where the problem lies in the program code.
Related recommendations: "Linux Video Tutorial"
The above is the detailed content of What does linux core mean?. For more information, please follow other related articles on the PHP Chinese website!

Hot AI Tools

Undresser.AI Undress
AI-powered app for creating realistic nude photos

AI Clothes Remover
Online AI tool for removing clothes from photos.

Undress AI Tool
Undress images for free

Clothoff.io
AI clothes remover

Video Face Swap
Swap faces in any video effortlessly with our completely free AI face swap tool!

Hot Article
Hot Tools

Notepad++7.3.1
Easy-to-use and free code editor

SublimeText3 Chinese version
Chinese version, very easy to use

Zend Studio 13.0.1
Powerful PHP integrated development environment

Dreamweaver CS6
Visual web development tools

SublimeText3 Mac version
God-level code editing software (SublimeText3)
Hot Topics


 What computer configuration is required for vscode
Apr 15, 2025 pm 09:48 PM
What computer configuration is required for vscode
Apr 15, 2025 pm 09:48 PM
VS Code system requirements: Operating system: Windows 10 and above, macOS 10.12 and above, Linux distribution processor: minimum 1.6 GHz, recommended 2.0 GHz and above memory: minimum 512 MB, recommended 4 GB and above storage space: minimum 250 MB, recommended 1 GB and above other requirements: stable network connection, Xorg/Wayland (Linux)
 vscode cannot install extension
Apr 15, 2025 pm 07:18 PM
vscode cannot install extension
Apr 15, 2025 pm 07:18 PM
The reasons for the installation of VS Code extensions may be: network instability, insufficient permissions, system compatibility issues, VS Code version is too old, antivirus software or firewall interference. By checking network connections, permissions, log files, updating VS Code, disabling security software, and restarting VS Code or computers, you can gradually troubleshoot and resolve issues.
 How to run java code in notepad
Apr 16, 2025 pm 07:39 PM
How to run java code in notepad
Apr 16, 2025 pm 07:39 PM
Although Notepad cannot run Java code directly, it can be achieved by using other tools: using the command line compiler (javac) to generate a bytecode file (filename.class). Use the Java interpreter (java) to interpret bytecode, execute the code, and output the result.
 What is vscode What is vscode for?
Apr 15, 2025 pm 06:45 PM
What is vscode What is vscode for?
Apr 15, 2025 pm 06:45 PM
VS Code is the full name Visual Studio Code, which is a free and open source cross-platform code editor and development environment developed by Microsoft. It supports a wide range of programming languages and provides syntax highlighting, code automatic completion, code snippets and smart prompts to improve development efficiency. Through a rich extension ecosystem, users can add extensions to specific needs and languages, such as debuggers, code formatting tools, and Git integrations. VS Code also includes an intuitive debugger that helps quickly find and resolve bugs in your code.
 Can vscode be used for mac
Apr 15, 2025 pm 07:36 PM
Can vscode be used for mac
Apr 15, 2025 pm 07:36 PM
VS Code is available on Mac. It has powerful extensions, Git integration, terminal and debugger, and also offers a wealth of setup options. However, for particularly large projects or highly professional development, VS Code may have performance or functional limitations.
 How to use VSCode
Apr 15, 2025 pm 11:21 PM
How to use VSCode
Apr 15, 2025 pm 11:21 PM
Visual Studio Code (VSCode) is a cross-platform, open source and free code editor developed by Microsoft. It is known for its lightweight, scalability and support for a wide range of programming languages. To install VSCode, please visit the official website to download and run the installer. When using VSCode, you can create new projects, edit code, debug code, navigate projects, expand VSCode, and manage settings. VSCode is available for Windows, macOS, and Linux, supports multiple programming languages and provides various extensions through Marketplace. Its advantages include lightweight, scalability, extensive language support, rich features and version
 What is the main purpose of Linux?
Apr 16, 2025 am 12:19 AM
What is the main purpose of Linux?
Apr 16, 2025 am 12:19 AM
The main uses of Linux include: 1. Server operating system, 2. Embedded system, 3. Desktop operating system, 4. Development and testing environment. Linux excels in these areas, providing stability, security and efficient development tools.
 How to check the warehouse address of git
Apr 17, 2025 pm 01:54 PM
How to check the warehouse address of git
Apr 17, 2025 pm 01:54 PM
To view the Git repository address, perform the following steps: 1. Open the command line and navigate to the repository directory; 2. Run the "git remote -v" command; 3. View the repository name in the output and its corresponding address.
