

How to create a PivotTable in Microsoft Excel

When you have a lot of data, it often becomes increasingly difficult to analyze it. But does it really have to be this way? Microsoft Excel offers an amazing built-in feature called Pivot Tables that can be used to easily analyze huge chunks of data. They can be used to efficiently aggregate your data by creating your own custom reports. They can be used to automatically calculate the sum of a column, filters can be applied to it, the data within it can be sorted, etc. The things you can do with pivot tables and how to use them to ease your daily excel hurdles are endless.
Keep reading to learn how to easily create a Pivot Table and learn how to organize it effectively. Hope you enjoyed reading this article.
Section 1: What is a PivotTable
In very basic terms, you can think of a PivotTable as a dynamic report. However, there is a huge difference between reports and pivot tables. Reports are static, they do not provide any interaction. But unlike them, PivotTables allow you to view your data in many different ways. Additionally, a PivotTable does not require any formulas to form the data it holds. You can apply many filters on the pivot table and customize the data as per your requirements.
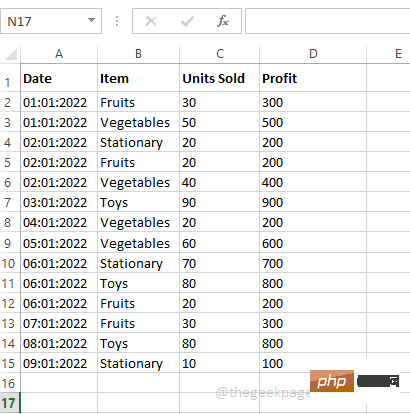
Part 2: Sample Data
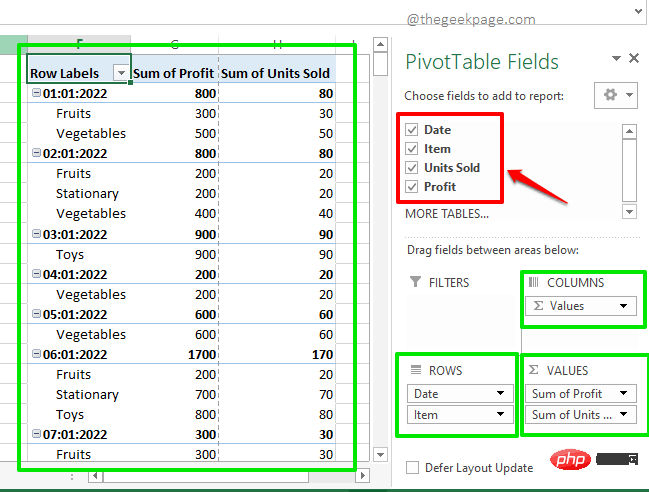
In this article, we created a sample table that contains data for creating a PivotTable report. In the example table we created, there are columns Date, Item, Units Sold, and Profit. We are mainly interested in finding the daily total profit based on different projects. Let's see how to do this with detailed steps and examples.
Part 3: How to Create a Pivot Table
Creating a Pivot Table is very easy once you have your data ready.
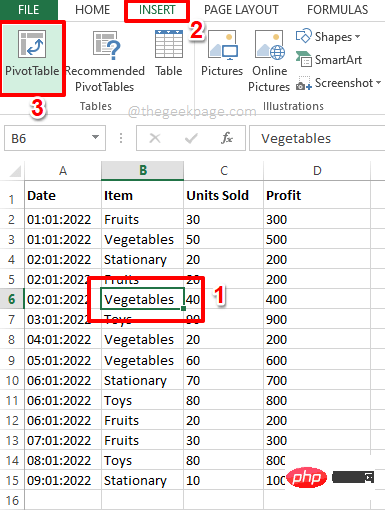
Step 1: Click anywhere within the data. Next, click the Insert tab on the top ribbon. Now, click on the button named Pivot Table.
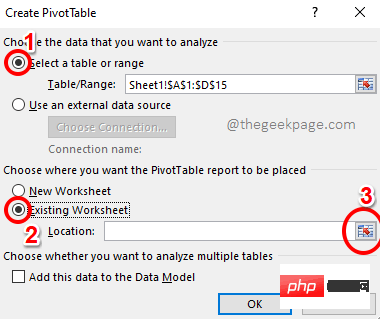
Step 2: NowCreate PivotDataTable window launches in front of you.
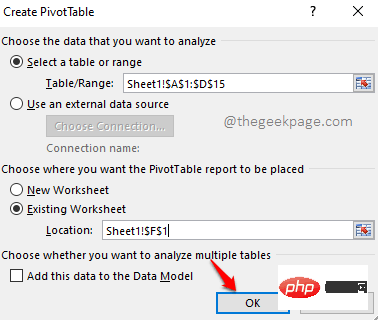
Under the "Select data to analyze" section, the radio option corresponding to the "Select a table or range" option will be selected by default Button. If there is no selection, select it.
Now, under the Select where you want the PivotTable to be placed section, you can choose to place it in a New worksheet or Existing worksheet Create a pivot table in the table.
If you select New Worksheet, the PivotTable will be created in a different worksheet. However, it is easier to compare the PivotTable and our sample data if they are both on the same worksheet, so I selected the Existing Worksheet option.
After selecting the radio button corresponding to the existing worksheet, click Select Cell# on the position field ## button.
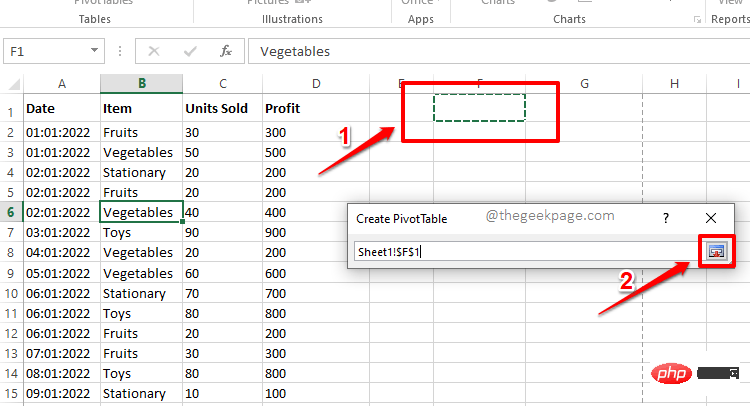
Step 3:Create PivotDataThe table window will now be minimized. Click the cell where you want to start the PivotTable report. After selecting the cells, click the "Select Cells" button again to maximize the window.
Step 4: After returning to the "Create PivotTableTable" window, click "OK" button.
Step 5: That’s it. Your PivotTable report is now inserted into your worksheet. In the following sections, let us see how data is generated in a PivotTable and how to manipulate the data.
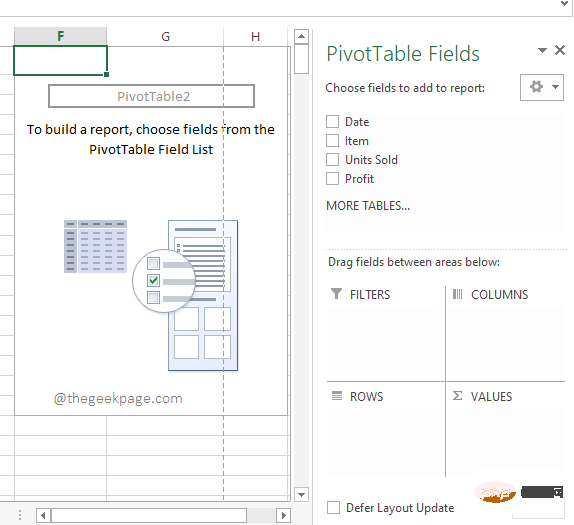
Step 1: Suppose you want to see the sum of profits . You don't need to write any formulas for this.
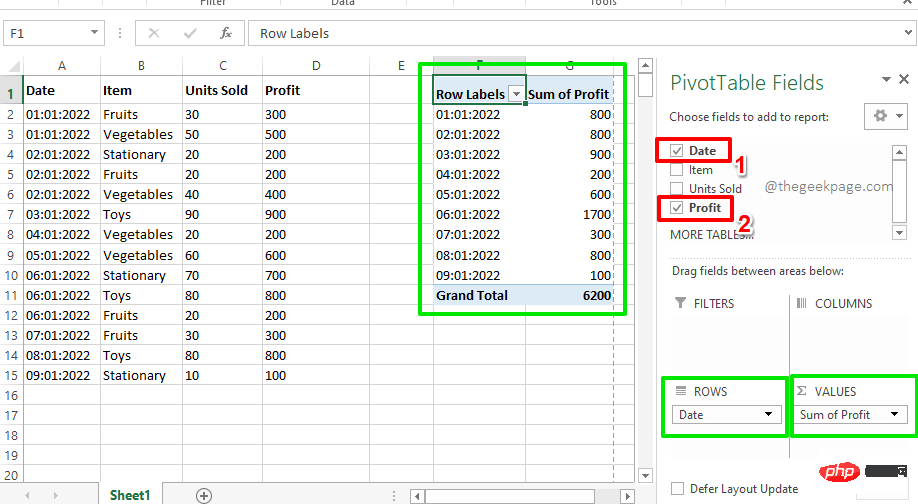
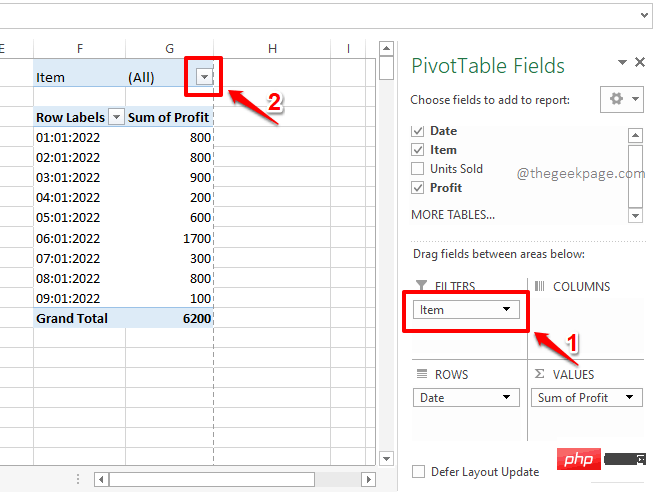
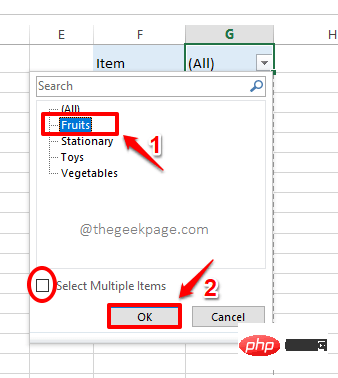
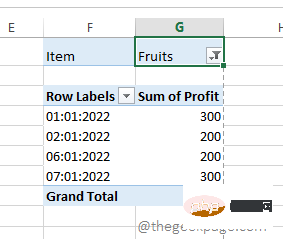
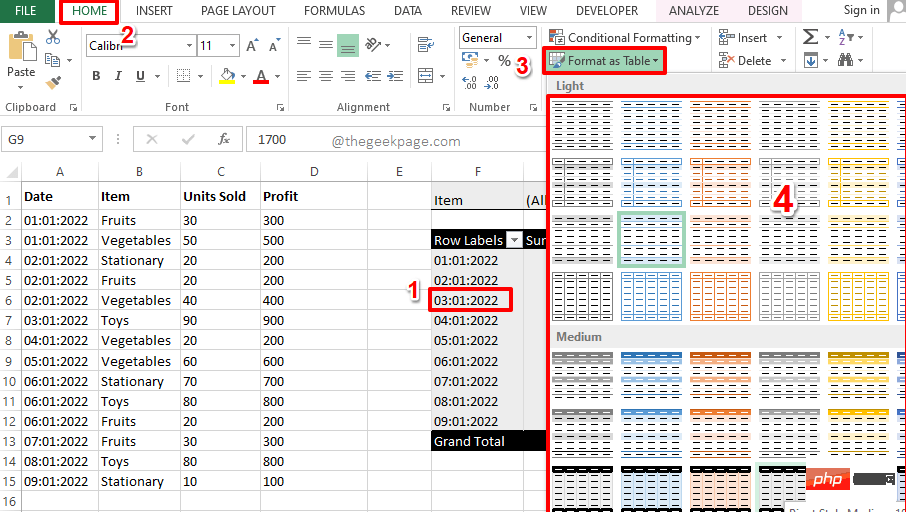
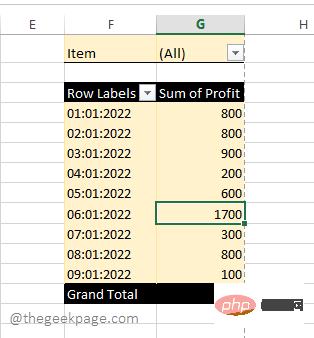
In theright pane where the Pivot table settings are located, you simply click on the # corresponding to the Profit column ## Checkbox. If you look at your Excel worksheet, you will see that your PivotTable now only has one column and it reads Sum of Profit. It calculates the sum of all available profits in the sample data. Step 2: Now let’s say you want to see the total profit, but at the same time, you also want to see the daily profit. In this case, also select the checkbox corresponding to the Date column in the right pane. Now, the Date column will automatically be located below the ROWS section of the PivotTable and your PivotTable will successfully display the profit for each day. Finally, it also shows the total of the profit earned. Step 3: Now, let us try to select the checkboxes corresponding to all the columns in the sample data. Well, this provides a perfect report in your pivot table showing the profit per project per day. Well, it couldn’t be more organized and we agree! If you only want to view the PivotTable after applying some specific filters , there are also some ways to do this. For example, if you want to view the daily profit of only the fruit project, you can follow the steps below. Step 1: First, on the right side of the window , drag the Item field from PivotTable Fields Put it in the FILTERS section. This simply adds filter items to your pivot table. Now on the PivotTable you will see the newly added filter Item. Click the drop-down menu associated with it. Step 2: Now click on the item Fruits and click on the OK button to filter only Pivot table of Fruits. Note: You can also choose to apply multiple filters on the PivotTable. You can do this by enabling the Select multiple items checkbox that corresponds to the circle marked in the screenshot below, then selecting multiple fields Step 3: If you look at the pivot table now, you can see that each day consists of only Fruits itemsTotal profit obtained Step 1: First click Now, make sure you are on the "Home" tab. Next, click the drop-down Format as Table. From the list of available styles, select any style Step 2 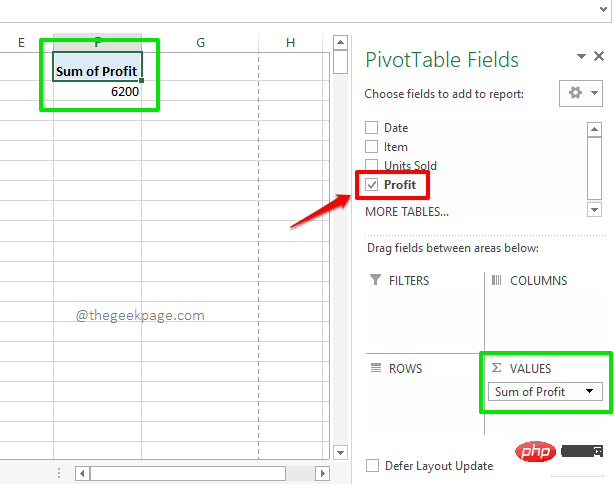
Part 5: How to Apply Filters in PivotTable
The above is the detailed content of How to create a PivotTable in Microsoft Excel. For more information, please follow other related articles on the PHP Chinese website!

Hot AI Tools

Undresser.AI Undress
AI-powered app for creating realistic nude photos

AI Clothes Remover
Online AI tool for removing clothes from photos.

Undress AI Tool
Undress images for free

Clothoff.io
AI clothes remover

Video Face Swap
Swap faces in any video effortlessly with our completely free AI face swap tool!

Hot Article
Hot Tools

Notepad++7.3.1
Easy-to-use and free code editor

SublimeText3 Chinese version
Chinese version, very easy to use

Zend Studio 13.0.1
Powerful PHP integrated development environment

Dreamweaver CS6
Visual web development tools

SublimeText3 Mac version
God-level code editing software (SublimeText3)
Hot Topics
 1387
1387
 52
52

 PHP's big data structure processing skills
May 08, 2024 am 10:24 AM
PHP's big data structure processing skills
May 08, 2024 am 10:24 AM
Big data structure processing skills: Chunking: Break down the data set and process it in chunks to reduce memory consumption. Generator: Generate data items one by one without loading the entire data set, suitable for unlimited data sets. Streaming: Read files or query results line by line, suitable for large files or remote data. External storage: For very large data sets, store the data in a database or NoSQL.
 C++ development experience sharing: Practical experience in C++ big data programming
Nov 22, 2023 am 09:14 AM
C++ development experience sharing: Practical experience in C++ big data programming
Nov 22, 2023 am 09:14 AM
In the Internet era, big data has become a new resource. With the continuous improvement of big data analysis technology, the demand for big data programming has become more and more urgent. As a widely used programming language, C++’s unique advantages in big data programming have become increasingly prominent. Below I will share my practical experience in C++ big data programming. 1. Choosing the appropriate data structure Choosing the appropriate data structure is an important part of writing efficient big data programs. There are a variety of data structures in C++ that we can use, such as arrays, linked lists, trees, hash tables, etc.
 Five major development trends in the AEC/O industry in 2024
Apr 19, 2024 pm 02:50 PM
Five major development trends in the AEC/O industry in 2024
Apr 19, 2024 pm 02:50 PM
AEC/O (Architecture, Engineering & Construction/Operation) refers to the comprehensive services that provide architectural design, engineering design, construction and operation in the construction industry. In 2024, the AEC/O industry faces changing challenges amid technological advancements. This year is expected to see the integration of advanced technologies, heralding a paradigm shift in design, construction and operations. In response to these changes, industries are redefining work processes, adjusting priorities, and enhancing collaboration to adapt to the needs of a rapidly changing world. The following five major trends in the AEC/O industry will become key themes in 2024, recommending it move towards a more integrated, responsive and sustainable future: integrated supply chain, smart manufacturing
 Application of algorithms in the construction of 58 portrait platform
May 09, 2024 am 09:01 AM
Application of algorithms in the construction of 58 portrait platform
May 09, 2024 am 09:01 AM
1. Background of the Construction of 58 Portraits Platform First of all, I would like to share with you the background of the construction of the 58 Portrait Platform. 1. The traditional thinking of the traditional profiling platform is no longer enough. Building a user profiling platform relies on data warehouse modeling capabilities to integrate data from multiple business lines to build accurate user portraits; it also requires data mining to understand user behavior, interests and needs, and provide algorithms. side capabilities; finally, it also needs to have data platform capabilities to efficiently store, query and share user profile data and provide profile services. The main difference between a self-built business profiling platform and a middle-office profiling platform is that the self-built profiling platform serves a single business line and can be customized on demand; the mid-office platform serves multiple business lines, has complex modeling, and provides more general capabilities. 2.58 User portraits of the background of Zhongtai portrait construction
 Discussion on the reasons and solutions for the lack of big data framework in Go language
Mar 29, 2024 pm 12:24 PM
Discussion on the reasons and solutions for the lack of big data framework in Go language
Mar 29, 2024 pm 12:24 PM
In today's big data era, data processing and analysis have become an important support for the development of various industries. As a programming language with high development efficiency and superior performance, Go language has gradually attracted attention in the field of big data. However, compared with other languages such as Java and Python, Go language has relatively insufficient support for big data frameworks, which has caused trouble for some developers. This article will explore the main reasons for the lack of big data framework in Go language, propose corresponding solutions, and illustrate it with specific code examples. 1. Go language
 Getting Started Guide: Using Go Language to Process Big Data
Feb 25, 2024 pm 09:51 PM
Getting Started Guide: Using Go Language to Process Big Data
Feb 25, 2024 pm 09:51 PM
As an open source programming language, Go language has gradually received widespread attention and use in recent years. It is favored by programmers for its simplicity, efficiency, and powerful concurrent processing capabilities. In the field of big data processing, the Go language also has strong potential. It can be used to process massive data, optimize performance, and can be well integrated with various big data processing tools and frameworks. In this article, we will introduce some basic concepts and techniques of big data processing in Go language, and show how to use Go language through specific code examples.
 AI, digital twins, visualization... Highlights of the 2023 Yizhiwei Autumn Product Launch Conference!
Nov 14, 2023 pm 05:29 PM
AI, digital twins, visualization... Highlights of the 2023 Yizhiwei Autumn Product Launch Conference!
Nov 14, 2023 pm 05:29 PM
Yizhiwei’s 2023 autumn product launch has concluded successfully! Let us review the highlights of the conference together! 1. Intelligent inclusive openness, allowing digital twins to become productive Ning Haiyuan, co-founder of Kangaroo Cloud and CEO of Yizhiwei, said in his opening speech: At this year’s company’s strategic meeting, we positioned the main direction of product research and development as “intelligent inclusive openness” "Three core capabilities, focusing on the three core keywords of "intelligent inclusive openness", we further proposed the development goal of "making digital twins a productive force". 2. EasyTwin: Explore a new digital twin engine that is easier to use 1. From 0.1 to 1.0, continue to explore the digital twin fusion rendering engine to have better solutions with mature 3D editing mode, convenient interactive blueprints, and massive model assets
 Big data processing in C++ technology: How to use in-memory databases to optimize big data performance?
May 31, 2024 pm 07:34 PM
Big data processing in C++ technology: How to use in-memory databases to optimize big data performance?
May 31, 2024 pm 07:34 PM
In big data processing, using an in-memory database (such as Aerospike) can improve the performance of C++ applications because it stores data in computer memory, eliminating disk I/O bottlenecks and significantly increasing data access speeds. Practical cases show that the query speed of using an in-memory database is several orders of magnitude faster than using a hard disk database.