 Backend Development
 Python Tutorial
 How to create a three-dimensional line chart using Python and Matplotlib
How to create a three-dimensional line chart using Python and Matplotlib
1.0 Introduction
Three-dimensional image technology is one of the most advanced computer display technologies in the world. Any ordinary computer only needs to install a plug-in to present three-dimensional products in a web browser. It is not only lifelike, And it can dynamically display the product combination process, which is especially suitable for remote browsing.
The three-dimensional images are visually distinct and colorful, with strong visual impact, allowing viewers to stay in the scene for a long time and leaving a deep impression. The three-dimensional pictures give people a real and lifelike feeling, the characters are ready to be seen, and they have an immersive feeling, which has a high artistic appreciation value.
2.0 Three-dimensional drawing method and type
First, you need to install the Matplotlib library, you can use pip:
pip install matplotlib
Assume that the matplotlib tool package has been installed.
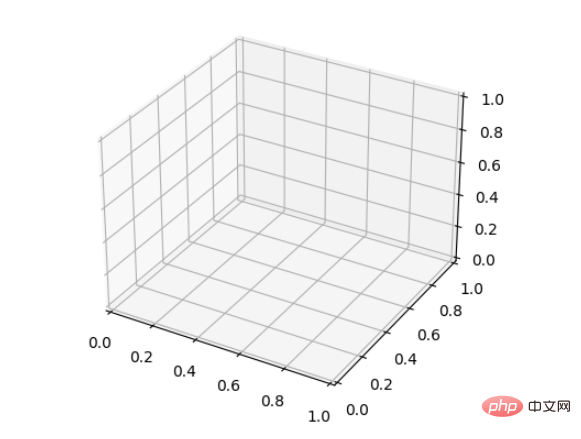
Use matplotlib.figure.Figure to create a plot frame:
import matplotlib.pyplot as plt
from mpl_toolkits.mplot3d import Axes3D
fig = plt.figure()
ax = fig.add_subplot(111, projection='3d')
1. Line plots
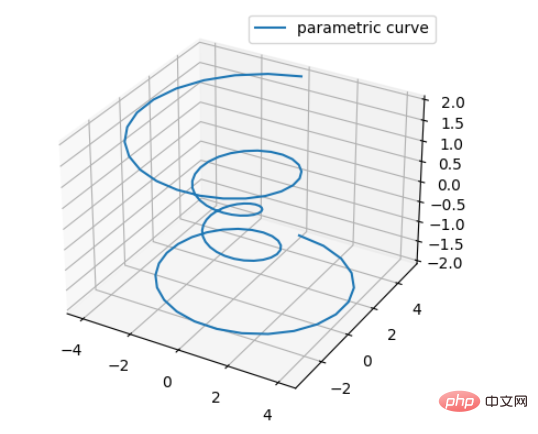
Basic usage: ax.plot(x,y,z,label=' ')
The code is as follows:
import matplotlib as mpl
from mpl_toolkits.mplot3d import Axes3D
import numpy as np
import matplotlib.pyplot as plt

mpl.rcParams['legend.fontsize'] = 10

fig = plt.figure()
ax = fig.add_subplot(projection='3d')
theta = np.linspace(-4 * np.pi, 4 * np.pi, 100)
z = np.linspace(-2, 2, 100)
r = z ** 2 + 1
x = r * np.sin(theta)
y = r * np.cos(theta)
ax.plot(x, y, z, label='parametric curve')
ax.legend()
The effect is as follows:
2 , Scatter plots
Basic syntax:
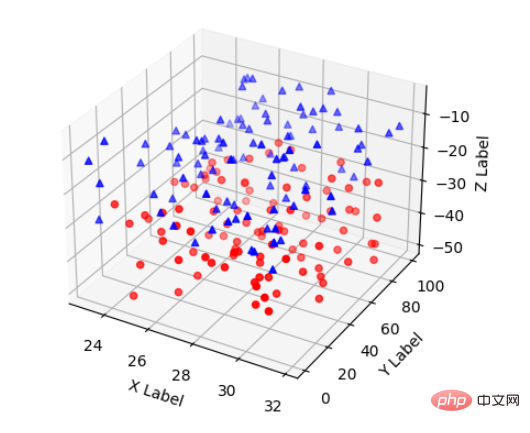
ax.scatter(xs, ys, zs, s=20, c=None, depthshade=True, *args , *kwargs)
The code is roughly:
xs,ys,zs: input data;
s: size of scatter point
c: color, if c = 'r’ it is red;
depthshase: transparency, True is Transparent, the default is True, False is opaque
*args and so on are expansion variables, such as maker = ‘o’, then the scatter result is the shape of ’o‘
Sample code:
from mpl_toolkits.mplot3d import Axes3D
import matplotlib.pyplot as plt
import numpy as np


def randrange(n, vmin, vmax):
    '''
    Helper function to make an array of random numbers having shape (n, )
    with each number distributed Uniform(vmin, vmax).
    '''
    return (vmax - vmin)*np.random.rand(n) + vmin

fig = plt.figure()
ax = fig.add_subplot(111, projection='3d')

n = 100

# For each set of style and range settings, plot n random points in the box
# defined by x in [23, 32], y in [0, 100], z in [zlow, zhigh].
for c, m, zlow, zhigh in [('r', 'o', -50, -25), ('b', '^', -30, -5)]:
    xs = randrange(n, 23, 32)
    ys = randrange(n, 0, 100)
    zs = randrange(n, zlow, zhigh)
    ax.scatter(xs, ys, zs, c=c, marker=m)

ax.set_xlabel('X Label')
ax.set_ylabel('Y Label')
ax.set_zlabel('Z Label')

plt.show()Effect:
- ##X,Y,Z: Input data
- rstride: Row step length
- cstride: Column step length
- ##rcount: Upper limit of row number
- ccount: Upper limit of number of columns
- Sample code:
from mpl_toolkits.mplot3d import axes3d
import matplotlib.pyplot as plt


fig = plt.figure()
ax = fig.add_subplot(100, projection='3d')

# Grab some test data.
X, Y, Z = axes3d.get_test_data(0.12)

# Plot a basic wireframe.
ax.plot_wireframe(X, Y, Z, rstride=10, cstride=10)

plt.show()
4. Tri-Surface plots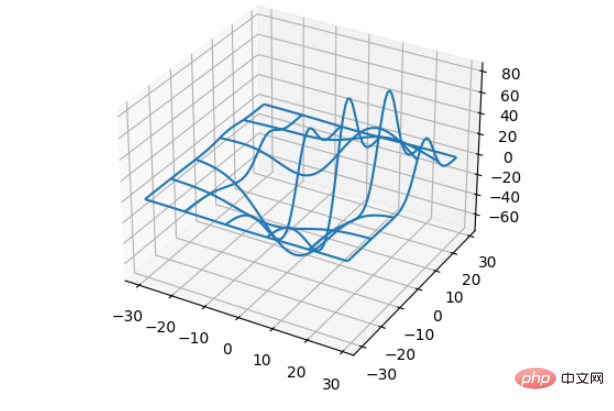
from mpl_toolkits.mplot3d import Axes3D
import matplotlib.pyplot as plt
import numpy as np


n_radii = 8
n_angles = 36

radii = np.linspace(0.125, 1.0, n_radii)
angles = np.linspace(0, 2*np.pi, n_angles, endpoint=False)

angles = np.repeat(angles[..., np.newaxis], n_radii, axis=1)


# points in the (x, y) plane.
x = np.append(0, (radii*np.cos(angles)).flatten())
y = np.append(0, (radii*np.sin(angles)).flatten())


z = np.sin(-x*y)

fig = plt.figure()
ax = fig.add_subplot(projection='3d')

ax.plot_trisurf(x, y, z, linewidth=0.2, antialiased=True)

plt.show()
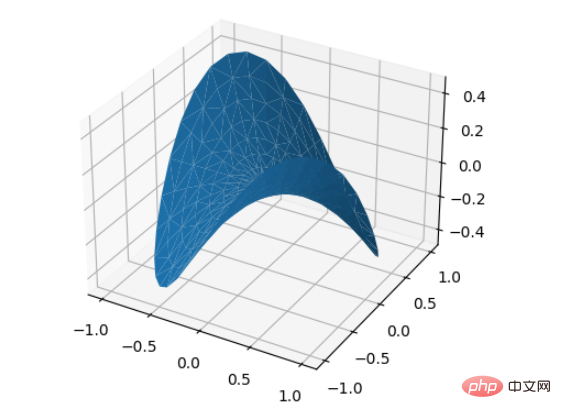 Use scatter generates a random scatter plot.
Function definition:
#Function definitionmatplotlib.pyplot.scatter(x, y,
s=None, #Scatter size array scalarc=None, #Color sequence array, sequencemarker=None, #Point style
cmap=None, #colormap color style
norm=None, #Normalization Normalized color camp
vmin=None, vmax=None, #corresponding to the normalized range above
alpha=None, #transparency
linewidths=None, #linewidth
verts=None,
# edgecolors =None, #Edge color
data=None,
**kwargs
)
Sample code:Effect:import numpy as np import matplotlib.pyplot as plt #定义坐标轴 fig4 = plt.figure() ax4 = plt.axes(projection='3d') #生成三维数据 xx = np.random.random(20)*10-5 #取100个随机数,范围在5~5之间 yy = np.random.random(20)*10-5 X, Y = np.meshgrid(xx, yy) Z = np.sin(np.sqrt(X**2+Y**2)) #作图 ax4.scatter(X,Y,Z,alpha=0.3,c=np.random.random(400),s=np.random.randint(10,20,size=(20, 20))) #生成散点.利用c控制颜色序列,s控制大小 plt.show()Copy after login
The above is the detailed content of How to create a three-dimensional line chart using Python and Matplotlib. For more information, please follow other related articles on the PHP Chinese website!

Hot AI Tools

Undresser.AI Undress
AI-powered app for creating realistic nude photos

AI Clothes Remover
Online AI tool for removing clothes from photos.

Undress AI Tool
Undress images for free

Clothoff.io
AI clothes remover

AI Hentai Generator
Generate AI Hentai for free.

Hot Article

Hot Tools

Notepad++7.3.1
Easy-to-use and free code editor

SublimeText3 Chinese version
Chinese version, very easy to use

Zend Studio 13.0.1
Powerful PHP integrated development environment

Dreamweaver CS6
Visual web development tools

SublimeText3 Mac version
God-level code editing software (SublimeText3)

Hot Topics
 How to open xml format
Apr 02, 2025 pm 09:00 PM
Use most text editors to open XML files; if you need a more intuitive tree display, you can use an XML editor, such as Oxygen XML Editor or XMLSpy; if you process XML data in a program, you need to use a programming language (such as Python) and XML libraries (such as xml.etree.ElementTree) to parse.
 Is there a free XML to PDF tool for mobile phones?
Apr 02, 2025 pm 09:12 PM
There is no simple and direct free XML to PDF tool on mobile. The required data visualization process involves complex data understanding and rendering, and most of the so-called "free" tools on the market have poor experience. It is recommended to use computer-side tools or use cloud services, or develop apps yourself to obtain more reliable conversion effects.
 Is there any mobile app that can convert XML into PDF?
Apr 02, 2025 pm 08:54 PM
An application that converts XML directly to PDF cannot be found because they are two fundamentally different formats. XML is used to store data, while PDF is used to display documents. To complete the transformation, you can use programming languages and libraries such as Python and ReportLab to parse XML data and generate PDF documents.
 Does XML modification require programming?
Apr 02, 2025 pm 06:51 PM
Modifying XML content requires programming, because it requires accurate finding of the target nodes to add, delete, modify and check. The programming language has corresponding libraries to process XML and provides APIs to perform safe, efficient and controllable operations like operating databases.
 Recommended XML formatting tool
Apr 02, 2025 pm 09:03 PM
XML formatting tools can type code according to rules to improve readability and understanding. When selecting a tool, pay attention to customization capabilities, handling of special circumstances, performance and ease of use. Commonly used tool types include online tools, IDE plug-ins, and command-line tools.
 How to beautify the XML format
Apr 02, 2025 pm 09:57 PM
XML beautification is essentially improving its readability, including reasonable indentation, line breaks and tag organization. The principle is to traverse the XML tree, add indentation according to the level, and handle empty tags and tags containing text. Python's xml.etree.ElementTree library provides a convenient pretty_xml() function that can implement the above beautification process.
 How to convert XML files to PDF on your phone?
Apr 02, 2025 pm 10:12 PM
It is impossible to complete XML to PDF conversion directly on your phone with a single application. It is necessary to use cloud services, which can be achieved through two steps: 1. Convert XML to PDF in the cloud, 2. Access or download the converted PDF file on the mobile phone.
 How to convert XML to PDF on your phone?
Apr 02, 2025 pm 10:18 PM
It is not easy to convert XML to PDF directly on your phone, but it can be achieved with the help of cloud services. It is recommended to use a lightweight mobile app to upload XML files and receive generated PDFs, and convert them with cloud APIs. Cloud APIs use serverless computing services, and choosing the right platform is crucial. Complexity, error handling, security, and optimization strategies need to be considered when handling XML parsing and PDF generation. The entire process requires the front-end app and the back-end API to work together, and it requires some understanding of a variety of technologies.


