

How to implement Gantt chart drawing in Python?

Preliminary preparation
Because we need to use the streamlit, streamlit-aggrid and plotly modules this time, first pass the The pip command downloads these modules, of which streamlit-aggrid is mainly used to present the data table on the page
pip install streamlit-aggrid
pip install plotly
The structure of the page
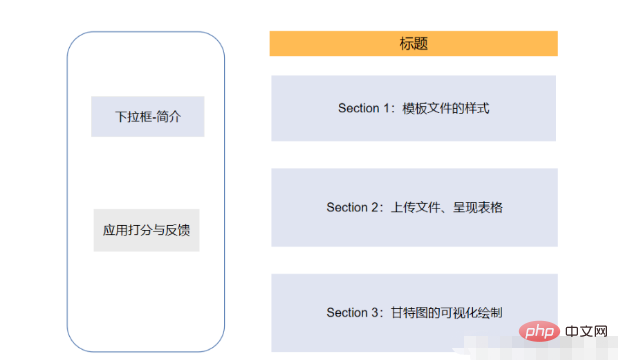
The overall page The structure is that there is a toolbar on the left, which contains some brief introductions to the web page, and a module that hopes users to rate and give feedback
. Section1 on the right is the template style of the project planning document, mainly in CSV Write clearly the details of the task in the file, including task name, task description, start and end time, etc. Section2 allows users to upload their own CSV files, modify the content of the items in the CSV file and provide a visual presentation, while Section3 exports the above content to an HTML file.
Code part
The following is the code part of the page
from st_aggrid import AgGrid
import streamlit as st
import pandas as pd
import numpy as np
import plotly.express as px
from  PIL import Image
import io
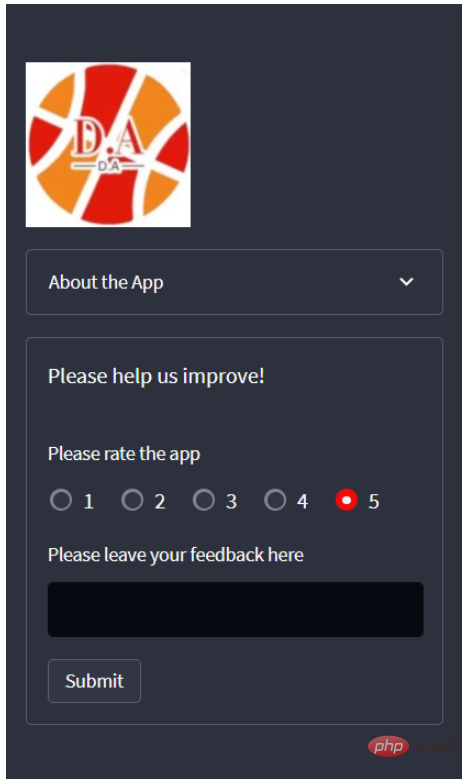
Next we will develop the part of the toolbar on the left, mainly to provide a simple introduction to the page and scoring functions
logo = Image.open(r'wechat_logo.jpg')
st.sidebar.image(logo, width=120)
with st.sidebar.expander("关于此APP的功能"):
st.write("""
项目的简单介绍)
""")
with st.sidebar.form(key='columns_in_form',clear_on_submit=True):
st.write('反馈')
st.write('<style>div.row-widget.stRadio > div{flex-direction:row;} </style>', unsafe_allow_html=True) # 水平方向的按钮
rating=st.radio("打分",('1','2','3','4','5'),index=4)
text=st.text_input(label='反馈')
submitted = st.form_submit_button('提交')
if submitted:
st.write('感谢')
st.markdown('您的评分是:')
st.markdown(rating)
st.markdown('您的反馈是:')
st.markdown(text)The results are shown in the figure below
Development of the main page-Section 1
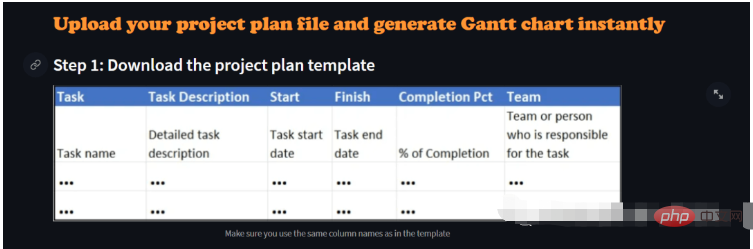
The next step is the development of Section 1 of the main page, mainly for display The style of the project CSV file, which columns it contains, what the column names are, etc., the code is as follows
st.markdown(""" <style> .font {
font-size:30px ; font-family: 'Cooper Black'; color: #FF9633;}
</style> """, unsafe_allow_html=True)
st.markdown('<p class="font">上传您的CSV文件</p>', unsafe_allow_html=True)
st.subheader('第一步:下载模板文件')
image = Image.open(r'example.png') # 模板文件的截图
st.image(image, caption='确保列名是一致的')
@st.cache_data
def convert_df(df):
return df.to_csv().encode('utf-8')
df=pd.read_csv(r'template.csv', encoding='gbk')
csv = convert_df(df)
st.download_button(
label="下载模板",
data=csv,
file_name='project_template.csv',
mime='text/csv',
)We provide a download button that allows users to download the template file with one click, and the final appearance is like this
Development of home page -Section 2
The next step is to upload our own CSV file, here we use the streamlit_aggrid module , the advantage of this module is that it can display the data table and modify the data in it,
st.subheader('Step 2: Upload your project plan file')
uploaded_file = st.file_uploader(
    "上传文件",
    type=['csv'])
if uploaded_file is not None:
    Tasks = pd.read_csv(uploaded_file, encoding='gbk')
    Tasks['Start'] = Tasks['Start'].astype('datetime64')
    Tasks['Finish'] = Tasks['Finish'].astype('datetime64')

    grid_response = AgGrid(
        Tasks,
        editable=True,
        height=300,
        width='100%',
    )

    updated = grid_response['data']
df = pd.DataFrame(updated)output
Next It is a visual presentation of data. Here we use the Plotly module to draw a Gantt chart. We can choose to draw it based on the team's dimension or the progress of the project completion. The code is as follows
st.subheader('第三部:绘制甘特图')

Options = st.selectbox("以下面哪种维度来绘制甘特图:", ['Team', 'Completion Pct'], index=0)
if st.button('绘制甘特图'):
    fig = px.timeline(
        df,
        x_start="Start",
        x_end="Finish",
        y="Task",
        color=Options,
        hover_name="Task Description"
    )

    fig.update_yaxes(
        autorange="reversed")

    fig.update_layout(
        title='Project Plan Gantt Chart',
        bargap=0.2,
        height=600,
        xaxis_title="Date",
        yaxis_title="Project Name",
        title_x=0.5,
        xaxis=dict(
            tickfont_size=15,
            tickangle=270,
            rangeslider_visible=True,
            side="top",
            showgrid=True,
            zeroline=True,
            showline=True,
            showticklabels=True,
            tickformat="%x\n",
        )
    )

    fig.update_xaxes(tickangle=0, tickfont=dict(family='Rockwell', color='blue', size=15))
    st.plotly_chart(fig, use_container_width=True)  # 绘制甘特图至页面上
    st.subheader(
        'Bonus: 导出至HTML')
    buffer = io.StringIO()
    fig.write_html(buffer, include_plotlyjs='cdn')
    html_bytes = buffer.getvalue().encode()
    st.download_button(
        label='Export to HTML',
        data=html_bytes,
        file_name='Gantt.html',
        mime='text/html'
    )
else:
st.write('---')The above is the detailed content of How to implement Gantt chart drawing in Python?. For more information, please follow other related articles on the PHP Chinese website!

Hot AI Tools

Undresser.AI Undress
AI-powered app for creating realistic nude photos

AI Clothes Remover
Online AI tool for removing clothes from photos.

Undress AI Tool
Undress images for free

Clothoff.io
AI clothes remover

AI Hentai Generator
Generate AI Hentai for free.

Hot Article
Hot Tools

Notepad++7.3.1
Easy-to-use and free code editor

SublimeText3 Chinese version
Chinese version, very easy to use

Zend Studio 13.0.1
Powerful PHP integrated development environment

Dreamweaver CS6
Visual web development tools

SublimeText3 Mac version
God-level code editing software (SublimeText3)
Hot Topics


 How to program deepseek
Feb 19, 2025 pm 05:36 PM
How to program deepseek
Feb 19, 2025 pm 05:36 PM
DeepSeek is not a programming language, but a deep search concept. Implementing DeepSeek requires selection based on existing languages. For different application scenarios, it is necessary to choose the appropriate language and algorithms, and combine machine learning technology. Code quality, maintainability, and testing are crucial. Only by choosing the right programming language, algorithms and tools according to your needs and writing high-quality code can DeepSeek be successfully implemented.
 How to access DeepSeekapi - DeepSeekapi access call tutorial
Mar 12, 2025 pm 12:24 PM
How to access DeepSeekapi - DeepSeekapi access call tutorial
Mar 12, 2025 pm 12:24 PM
Detailed explanation of DeepSeekAPI access and call: Quick Start Guide This article will guide you in detail how to access and call DeepSeekAPI, helping you easily use powerful AI models. Step 1: Get the API key to access the DeepSeek official website and click on the "Open Platform" in the upper right corner. You will get a certain number of free tokens (used to measure API usage). In the menu on the left, click "APIKeys" and then click "Create APIkey". Name your APIkey (for example, "test") and copy the generated key right away. Be sure to save this key properly, as it will only be displayed once
 Major update of Pi Coin: Pi Bank is coming!
Mar 03, 2025 pm 06:18 PM
Major update of Pi Coin: Pi Bank is coming!
Mar 03, 2025 pm 06:18 PM
PiNetwork is about to launch PiBank, a revolutionary mobile banking platform! PiNetwork today released a major update on Elmahrosa (Face) PIMISRBank, referred to as PiBank, which perfectly integrates traditional banking services with PiNetwork cryptocurrency functions to realize the atomic exchange of fiat currencies and cryptocurrencies (supports the swap between fiat currencies such as the US dollar, euro, and Indonesian rupiah with cryptocurrencies such as PiCoin, USDT, and USDC). What is the charm of PiBank? Let's find out! PiBank's main functions: One-stop management of bank accounts and cryptocurrency assets. Support real-time transactions and adopt biospecies
 Quantitative currency trading software
Mar 19, 2025 pm 04:06 PM
Quantitative currency trading software
Mar 19, 2025 pm 04:06 PM
This article explores the quantitative trading functions of the three major exchanges, Binance, OKX and Gate.io, aiming to help quantitative traders choose the right platform. The article first introduces the concepts, advantages and challenges of quantitative trading, and explains the functions that excellent quantitative trading software should have, such as API support, data sources, backtesting tools and risk control functions. Subsequently, the quantitative trading functions of the three exchanges were compared and analyzed in detail, pointing out their advantages and disadvantages respectively, and finally giving platform selection suggestions for quantitative traders of different levels of experience, and emphasizing the importance of risk assessment and strategic backtesting. Whether you are a novice or an experienced quantitative trader, this article will provide you with valuable reference
 deepseek how to deploy r1 model locally - deepseek locally install r1 model tutorial
Mar 12, 2025 pm 12:15 PM
deepseek how to deploy r1 model locally - deepseek locally install r1 model tutorial
Mar 12, 2025 pm 12:15 PM
DeepSeekR1 model local deployment guide: Unlocking data analysis and prediction potential DeepSeek is a powerful data analysis and prediction tool, and its R1 model can provide efficient and accurate model support for various application scenarios. This guide will provide you with detailed instructions on how to deploy the DeepSeekR1 model in your on-premises environment to help you get started quickly and take advantage of its power. System requirements for the local deployment step preparation stage of the DeepSeekR1 model: Please make sure that your local machine meets the minimum system configuration requirements of DeepSeek (for specific requirements, please refer to the official DeepSeek document). Software installation: Download and install the installation package provided by DeepSeek and follow the installation guide
 How to implement calls with Python - Deepseek Python Call Method Guide
Mar 12, 2025 pm 12:51 PM
How to implement calls with Python - Deepseek Python Call Method Guide
Mar 12, 2025 pm 12:51 PM
DeepSeek Deep Learning Library Python Call Guide DeepSeek is a powerful deep learning library that can be used to build and train various neural network models. This article will introduce in detail how to use Python to call DeepSeek for deep learning development. Steps to Call DeepSeek with Python 1. Install DeepSeek Make sure that the Python environment and pip tools are installed. Install DeepSeek with the following command: pipinstalldeepseek2. Import the DeepSeek library Import the DeepSeek library in a Python script or JupyterNotebook: impor
 What is Binance Alpha
Mar 25, 2025 pm 03:39 PM
What is Binance Alpha
Mar 25, 2025 pm 03:39 PM
Anbi Alpha is a tool and service aggregation platform for professional traders and investors on the Binance platform. Its core functions include: 1. Strategy Square, which brings together different trading strategies; 2. Strategy builder, which allows custom trading strategies; 3. Advanced data analysis, providing market analysis tools; 4. Institutional-level services to meet the needs of professional investors.
 Which exchanges can send option hedging instructions through the trading side
Mar 28, 2025 pm 03:27 PM
Which exchanges can send option hedging instructions through the trading side
Mar 28, 2025 pm 03:27 PM
As of 2024, mainstream cryptocurrency exchanges that support directly sending option hedging instructions through trading terminals: 1. Deribit supports advanced strategies such as Delta hedging and Gamma Scalping, and provide web version/API one-click hedging; 2. OKX supports volatility hedging and strategy combination tools, and a built-in hedging panel on the web/APP; 3. Binance supports protective hedging, requiring manual or API combination positions; 4. CME, providing standard options, requiring access through brokers; 5. LedgerX, providing professional-level hedging tools, requiring institutional certification.
