 Technology peripherals
 AI
AI
 The causal representation learning method proposed by Hong Kong et al. aims at the external generalization problem of complex orthograph data distribution.
The causal representation learning method proposed by Hong Kong et al. aims at the external generalization problem of complex orthograph data distribution.
With the application and promotion of deep learning models, people have gradually discovered that models often use spurious correlations (Spurious Correlation) in the data to obtain higher training performance. However, since such correlations often do not hold true on test data, the test performance of such models is often unsatisfactory [1]. The essence is that the traditional machine learning objective (Empirical Risk Minimization, ERM) assumes the independent and identical distribution characteristics of the training and test set, but in reality, the scenarios where the independent and identical distribution assumption is true are often limited. In many real-life scenarios, the distribution of training data and the distribution of test data usually show inconsistencies, that is, distribution shifts (Distribution Shifts). The problem aimed at improving the performance of the model in such scenarios is usually called out-of-distribution generalization (out-of-distribution generalization). Out-of-Distribution) problem. A class of methods such as ERM that focus on learning correlations rather than causation in the data often struggle with distribution shifts. Although many methods have emerged in recent years and have made certain progress in the problem of Out-of-Distribution by using the Invariance Principle in Causal Inference, research on graph data is still limited. This is because out-of-distribution generalization of graph data is more difficult than traditional European data, which brings more challenges to graph machine learning. This paper takes the graph classification task as an example to explore the extra-generalization of graph distribution based on the principle of causal invariance.

# In recent years, with the help of the principle of causal invariance, people have achieved certain success in the problem of out-of-distribution generalization of Euclidean data, but for graphs Research on the data remains limited. Unlike Euclidean data, the complexity of graphs poses unique challenges for using causal invariance principles and overcoming out-of-distribution generalization difficulties.
To address this challenge, we integrate causal invariance into graph machine learning in this work, and propose a causally inspired invariant graph learning framework to solve the problem of graph data. The problem of out-of-distribution generalization provides new theories and methods.
The paper has been published in NeurIPS 2022. This work was completed in cooperation with the Chinese University of Hong Kong, Hong Kong Baptist University, Tencent AI Lab and the University of Sydney.
- ##Paper title: Learning Causally Invariant Representations for Out-of-Distribution Generalization on Graphs
- Paper link: https://openreview.net/forum?id=A6AFK_JwrIW
- ##Project code: https: //github.com/LFhase/CIGA Out-of-distribution generalization of graph data
Out-of-distribution generalization of graph data What's the difficulty?
In recent years, graph neural networks have achieved great success in machine learning applications involving graph structures, such as recommendation systems, AI-assisted pharmaceuticals and other fields. However, because most existing graph machine learning algorithms rely on the assumption of independent and identical distribution of data, when the test data and training data have shifts (Distribution Shifts), the performance of the algorithm will be greatly reduced. At the same time, due to the complexity of the graph data structure, out-of-distribution generalization of graph data is more common and more challenging than that of European data.

Figure 1. Example of distribution shift on graph. First of all, the distribution shift of graph data can appear in the node feature distribution of the graph (Attribute-level Shifts). For example, in a recommendation system, the products involved in the training data may be from some popular categories, and the users involved may also come from certain specific regions. However, during the testing phase, the system needs to properly handle users from all categories and regions. and commodities [2,3,4]. In addition, distribution shifts of graph data can also appear in the structure distribution of the graph (Structure-level Shifts). As early as 2019, people noticed that graph neural networks trained on smaller graphs are difficult to learn effective attention (Attention) weights to generalize to larger graphs [5], which also promotes A series of related works were proposed [6,7]. In real-life scenarios, these two types of distribution shifts may often appear at the same time, and these distribution shifts at different levels may also have different false correlation patterns with the labels to be predicted. For example, in recommendation systems, products from specific categories and users from specific regions often exhibit unique topological structures on the product user interaction graph [4]. In the prediction of drug molecule attributes, the drug molecules involved in training may be too small, and the prediction results will also be affected by the experimental measurement environment [8]. In addition, out-of-distribution generalization in Euclidean space often assumes that the data comes from multiple environments (Environment) or domains (Domain), and further assumes that the model can obtain the training data during training. The environment to which each sample belongs to explore invariance across environments. However, obtaining environmental labels for data often requires some expert knowledge related to the data, and due to the abstract nature of graph data, obtaining environmental labels for graph data is more expensive. Therefore, most existing graph datasets such as OGB do not contain such environmental label information. Even if a small number of existing graph datasets such as DrugOOD exist environmental labels, there are varying degrees of noise. Can existing methods solve the problem of out-of-distribution generalization on graphs? In order to have an intuitive understanding of the challenge of out-of-distribution generalization on graph data, we construct new data based on the Spurious-Motif [9] dataset to further instantiate the above Several major challenges, and try to use existing methods such as the training target IRM [10] for out-of-distribution generalization on European data, or GNN [11] with stronger expressive capabilities, to analyze whether graph data can be solved by existing methods. The problem of out-of-distribution generalization. Figure 2. Spurious Motif dataset example. The Spurious Motif task is shown in Figure 2. It mainly labels the graph based on whether the input graph contains a subgraph with a specific structure (such as House or Cycle). Make a judgment, where the node color represents the attribute of the node. Using this data set can clearly test the impact of distribution shifts at different levels on the performance of graph neural networks. For an ordinary GNN model trained using ERM: In addition, the model cannot obtain any information related to the environment label during training, and the experimental results are shown in Figure 3 (more results can be found in Appendix D of the paper). Figure 3. Performance of existing methods under different graph distribution shifts. As shown in Figure 3, ordinary GCN cannot cope with the structural shift (Struc) of the graph, whether it is trained using ERM or IRM; while in After adding graph node attribute offset (Mixed) and graph size distribution offset (in Figure 3), the model performance will be further reduced; in addition, even if kGNN with stronger expressive ability is used, it is difficult to avoid serious performance loss (average performance lower, or greater variance). From this, we naturally lead to the question to be studied: How to obtain a GNN model that can cope with various graph distribution shifts? In order to solve the above problems, we need to learn the target, that is, the invariant graph neural network (Invariant GNN), Define it as a model that still performs well in the worst environment (see the paper for a rigorous definition): Definition 1 (Invariant graph neural network) Given a series of collected Graph classification dataset of different causally related environments , where Containing what are considered to be independent and identically distributed samples from the environment e, consider a graph neural network , where and are the graph space and sample space used as input respectively, f is the invariant graph neural network, if and only if , that is, minimizing the maximum of all environments Worst empirical risk, where is the experience loss of the model in the environment. The model can only obtain part of the data in the training environment during training. If no assumptions are made about the data process, the data will remain unchanged. The minmax optimality required by the definition of graph neural networks is difficult to achieve. Therefore, we use a Structural Causal Model to model the graph generation process from the perspective of Causal Inference and characterize the correlation between environments in an attempt to define causal invariance on graph data. Figure 4. Causal model of the graph data generation process. Without loss of generality, we incorporate all latent variables that affect graph generation into the latent space, and model the graph generation process as In addition, C has many types of interactions with Y, S and E in the latent space. It mainly follows whether the false latent variable S and the label Y have additional associations besides the constant latent variable C, that is Based on the above causal analysis, we can know that when the model only uses invariant subgraphs for prediction, that is, it only uses the subgraphs between Among them, . Under such conditions, consider maximizing , we will further seek more information about # from the causal model combines the above two properties, We can deduce Since it is difficult for us to observe directly in practice, we can use it as a proxy in formula (2). At the same time, when where, Notice that when maximizing ,
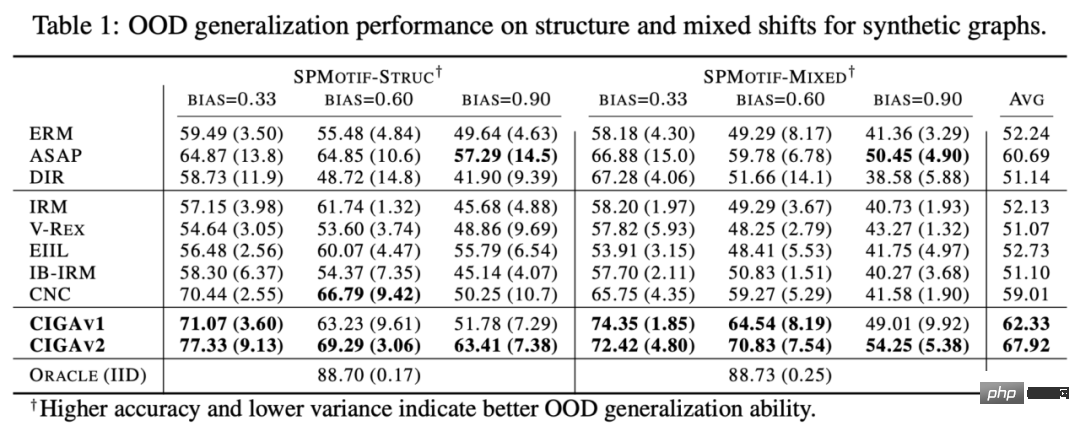
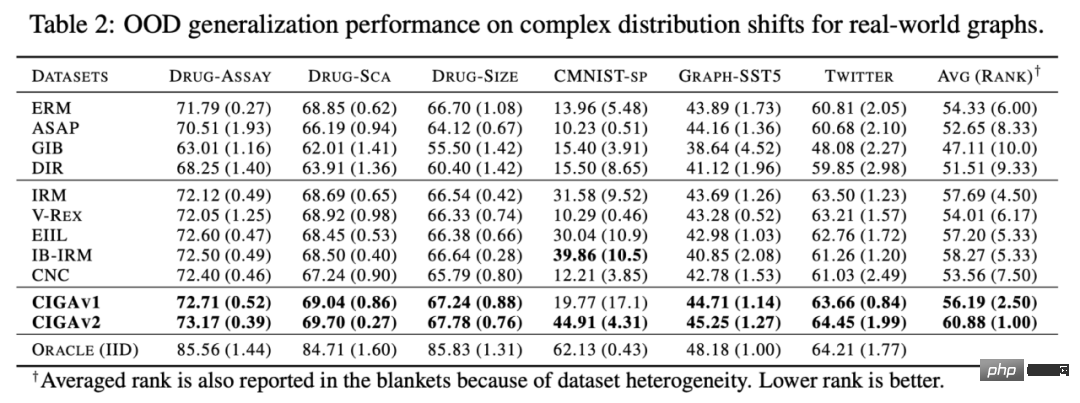
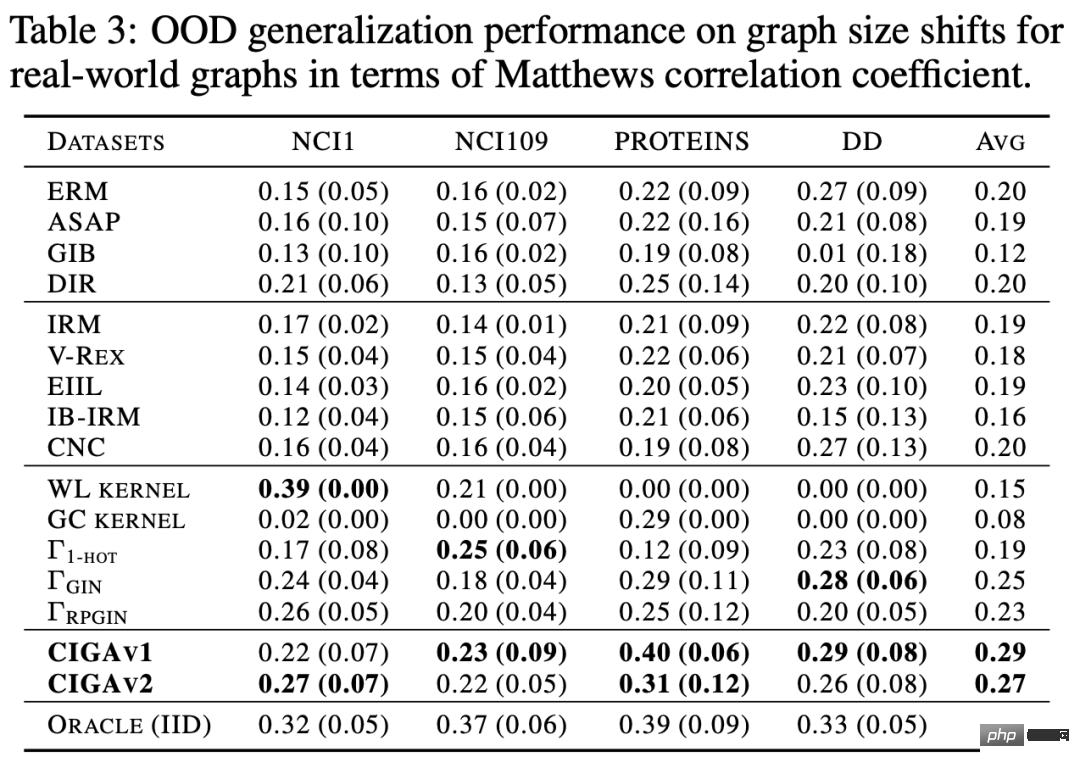
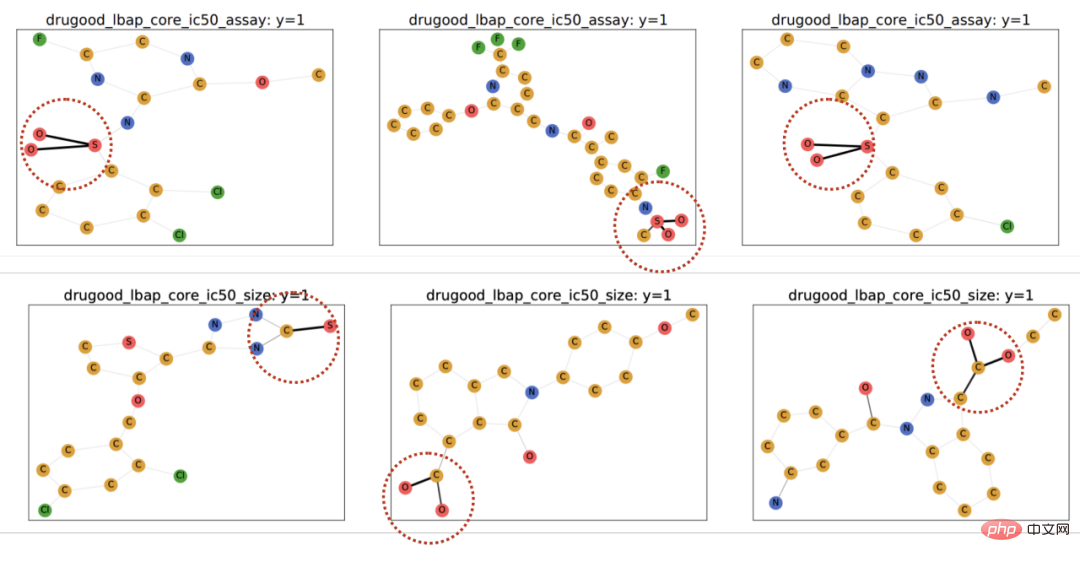
In the experiments, we used 16 synthetic or real-world data sets to conduct CIGA under different graph distribution shifts. Full verification. In the experiment, we implemented the prototype of CIGA using the interpretable GNN framework [9], but in fact CIGA has more ways to implement it. For specific data sets and experimental details, please see the experimental section of the article. Performance of structural distribution shift and mixed distribution shift on the synthetic data set We first based on SPMotif Dataset [9] constructed SPMotif-Struc and SPMotif-Mixed data sets, where SPMotif-Struc contains spurious correlations between specific subgraphs and other subgraph structures in the graph, as well as distribution shifts in graph size; while SPMotif-Mixed Based on SPMotif-Struc, a new distribution offset at the graph node attribute level is added. The first column in the table is the baseline of ERM and interpretable GNN, and the second column is the most advanced out-of-distribution generalization algorithm in Euclidean space. It can be found from the results that both the better GNN framework and the out-of-distribution generalization algorithm in Euclidean space are subject to the distribution shift on the graph, and when more distribution shifts occur, the performance loss (smaller average classification performance or greater variance) will be further enhanced. In contrast, CIGA maintains good performance under distribution shifts of different strengths and greatly exceeds the best baseline performance. Performance of various graph distribution shifts on real data sets We then further tested the performance of CIGA on real data sets and graph distribution shifts that exist in various real data, including three different environment divisions in DrugOOD (experimental environment Assay, molecule) from drug molecule attribute prediction in AI-assisted pharmaceuticals The three data sets (Scaffold, molecule size) contain graph distribution shifts of various real application scenarios; the CMNIST-SP converted based on the classic image data set ColoredMNIST [10] in Euclidean space mainly contains graph nodes. PIIF type distribution offset of attributes; based on the Graph-SST5 and Twitter [15] converted from the natural language emotion classification data set SST5 and Twitter, and an additional distribution offset of graph degree is added. In addition, we also used 4 previously studied molecular graph size distribution shift data sets [7], The test results are shown in the table above. It can be found that in real data, due to the increase in task difficulty, GNN with better architecture is used. Or the model performance obtained by training the out-of-distribution generalization optimization target in Euclidean space is even weaker than the ordinary GNN model trained using ERM. This phenomenon is also similar to the phenomenon observed in out-of-distribution generalization experiments under more difficult tasks in Euclidean space [16], reflecting the difficulty of out-of-distribution generalization on real data and the shortcomings of existing methods. In contrast, CIGA can improve on all real data and graph distribution shifts, and even reach the empirically optimal Oracle level in some data sets such as Twitter and PROTEINS. Preliminary tests on the latest graph out-of-distribution generalization test benchmark GOOD above on the graph classification data set also show that CIGA is currently the best graph out-of-distribution generalization algorithm that can cope with various graph distribution shifts. Since Interpretable GNN is used as the prototype implementation architecture of CIGA, we also visualized the DrugOOD identified by the model and found that CIGA did find some relatively consistent molecular bases. Clusters are used for molecular property prediction. This can provide a better basis for subsequent AI-assisted pharmaceuticals. Figure 6. Partially invariant subgraph recognized by CIGA in DrugOOD. Through the perspective of causal inference, this paper introduces causal invariance to graph distribution under various graph distribution shifts for the first time. In the external generalization problem, a new theoretically guaranteed solution framework CIGA is proposed. A large number of experiments have also fully verified CIGA's excellent out-of-distribution generalization performance. Looking to the future, based on CIGA, we can further explore better implementation frameworks [17], or introduce better theoretically guaranteed data enhancement methods for CIGA [3,18], and theoretically model the association on the graph. Variable Shift (Covariate Shift) [19] to further enhance CIGA's ability to identify invariant subgraphs and promote the real implementation of graph neural networks in real application scenarios such as AI-assisted pharmaceuticals. 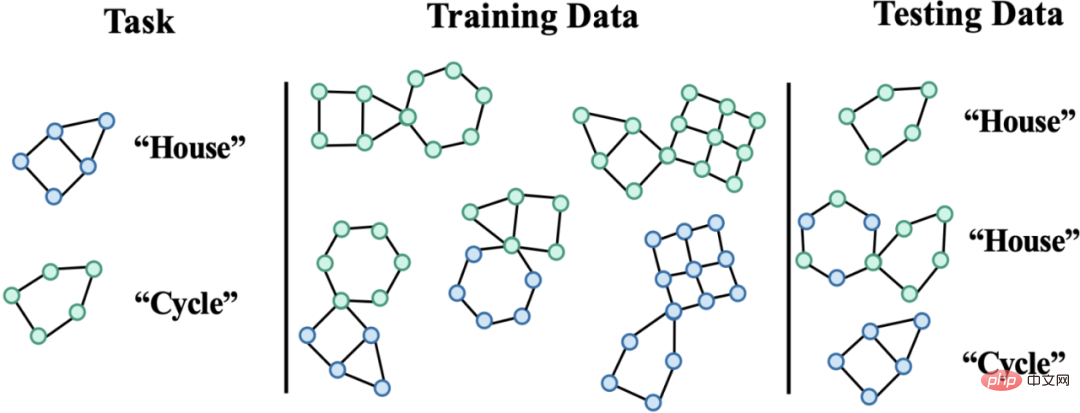

Causal model for generalization outside graph data distribution

 . In addition, for the latent variable
  , according to whether it is affected by the environment E, we divide it into an invariant latent variable
  and a false latent variable (spurious latent variable)
  . Correspondingly, the latent variables C and S will respectively affect the generation of a certain subgraph of G, which are respectively recorded as the invariant subgraph
  and the false subgraph
  , such as As shown in Figure 4 (a), and C mainly controls the label Y of the graph. This can also be further derived
  , that is, C and Y have higher mutual information than S. This generation process corresponds to many practical examples. For example, the medicinal properties of a molecule are usually determined by a certain key group (molecular subgraph) (such as the water solubility of hydroxyl-HO to the molecule).
  , can be summarized into two types: FIIF (Fully Informative Invariant Feature) as shown in Figure 4 (b) and PIIF (Partially Informative Invariant Feature) as shown in Figure 4 (c). Among them, FIIF means that the label is independent of the false correlation amount given the invariant information. PIIF is the opposite. It should be noted that in order to cover as many graph distribution shifts as possible, our causal model strives to broadly model various graph generation models. Given more knowledge about the graph generation process, the causal model shown in Figure 4 can be further generalized to more specific examples. As in Appendix C.1, we show how causal graphs can be generalized to previous work by Bevilacqua et al. [7] on analyzing graph size distribution shifts by adding the assumption of an additional graph limit (graphon).
  Correlation, the model's prediction will not be affected by changes in the environment E; on the contrary, if the model's prediction relies on any information related to S or
  , its prediction results will be affected by changes in E Significant changes occur, resulting in performance loss. Therefore, our goal can be further refined from learning an invariant graph neural network to: a) identifying potential invariant subgraphs; b) predicting Y using the identified subgraphs. In order to further correspond to the algorithm process of data generation, we further split the graph neural network into a subgraph recognition network (Featurizer GNN)
  and a classification network (Classifier GNN)
  , and
, and  , where
  is the subgraph space of
  . Then the learning objective of the model can be expressed as shown in formula (1):
 is the prediction of the invariant subgraph by the subgraph recognition network;
 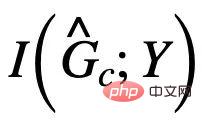 is
is  Mutual information with Y, in general, maximizing
 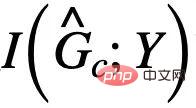 can be achieved by minimizing the empirical loss of using
  to predict Y. However, due to the lack of E, it is difficult for us to directly use E to verify the independence of
  . To this end, we must seek other equivalent conditions to identify the need The invariant subgraph of .
  Cause-inspired invariant graph learning
 In order to solve the problem of invariant subgraph identification when missing, based on the framework of formula (1), we hope to seek a Easily implementable equivalence conditions for formula (1). In particular, we first consider the simpler case where the underlying invariant subgraph size is fixed and known,
 , although
 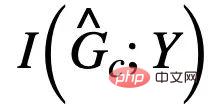 has the same size as
  , but because
  is also related to Y, so without any other constraints, maximizing
  may cause the estimated invariant subgraph to contain parts that have mutual information with Y false subgraph.
 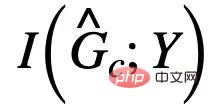 In order to "squeeze" out the possible false subgraphs in
  ##Unique attributes. Note that, regardless of the false correlation type of PIIF or FIIF, for the subgraph that maximizes the mutual information with label Y, we have:

 and
and  reach their maximum value at the same time,
  will Minimize automatically, otherwise the model's predictions will collapse to trivial solutions. From this, we obtained the invariant subgraph equivalence condition in a simple case. Combined with formula (1), we obtained the first version of the Causality-inspired Invariant Graph learning (Causality-inspired Invariant Graph leArning) framework. That is, CIGAv1:
 and
and  , that is,
  and G come from the same category Y. In our paper, we further demonstrate that CIGAv1 can successfully identify potential invariant subgraphs in the causal model corresponding to Figure 4 when the graph size is known. However, because the previous assumptions are too ideal, in practice, the size of the invariant subgraph may change and the corresponding size is often unknown. Under the assumption of no subgraph size, CIGAv1 requirements can be met by simply identifying the entire graph as an invariant subgraph. Therefore, we consider further seeking properties about invariant subgraphs to remove this assumption.
  may appear
  ### The false subgraph parts in ## share the same and relevant mutual information as the removed invariant subgraph parts. So, can we do the opposite and maximize to remove possible false subgraph parts of
  ? The answer is yes, we can use the correlation between
  and Y to make it compete with the estimate of
  . It should be noted that when maximizing
  , you need to ensure that
 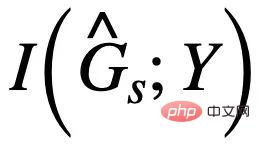 will not exceed
 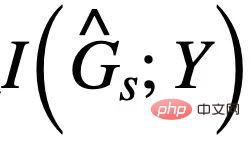 , otherwise
 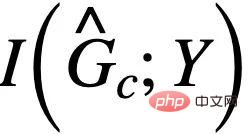 will The predicted will fall into the ordinary solution again. Combined with this additional condition, we can remove the assumption about the constant subgraph size from formula (3) and obtain the following CIGAv2:

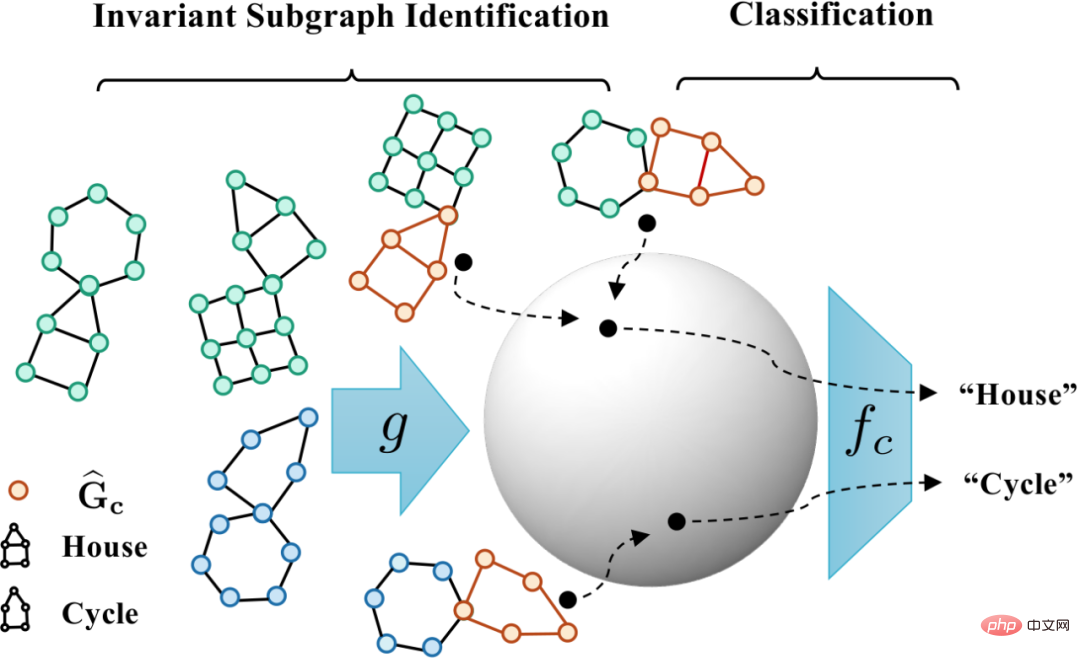 # Figure 5. Schematic of the causally inspired invariant graph learning framework.
  corresponds to the positive sample in formula (4), and
  corresponds to
 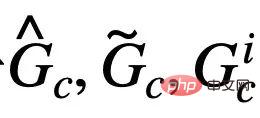 The diagram represents. When
  , formula (5) provides a nonparametric Resubstitution Entropy Estimator based on von Mises-Fisher kernel density for
 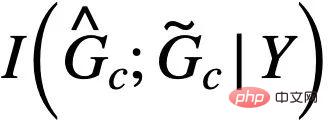 )[13,14]. The final implementation of the core part of CIGA is shown in Figure 5, that is, by bringing the graph representation of the same category of invariant subgraphs closer in the latent representation space, and at the same time maximizing the graph representation of different categories of invariant subgraphs to maximize
  . In addition, for another constraint in formula (4), we can implement it through the idea of hinge loss, that is,
  , only when optimizing the prediction, the empirical loss is greater than the corresponding invariant A false subgraph of a subgraph.
 Experiments and Discussion
Summary and Outlook
The above is the detailed content of The causal representation learning method proposed by Hong Kong et al. aims at the external generalization problem of complex orthograph data distribution.. For more information, please follow other related articles on the PHP Chinese website!

Hot AI Tools

Undresser.AI Undress
AI-powered app for creating realistic nude photos

AI Clothes Remover
Online AI tool for removing clothes from photos.

Undress AI Tool
Undress images for free

Clothoff.io
AI clothes remover

Video Face Swap
Swap faces in any video effortlessly with our completely free AI face swap tool!

Hot Article

Hot Tools

Notepad++7.3.1
Easy-to-use and free code editor

SublimeText3 Chinese version
Chinese version, very easy to use

Zend Studio 13.0.1
Powerful PHP integrated development environment

Dreamweaver CS6
Visual web development tools

SublimeText3 Mac version
God-level code editing software (SublimeText3)

Hot Topics
 1387
1387
 52
52
 No OpenAI data required, join the list of large code models! UIUC releases StarCoder-15B-Instruct
Jun 13, 2024 pm 01:59 PM
At the forefront of software technology, UIUC Zhang Lingming's group, together with researchers from the BigCode organization, recently announced the StarCoder2-15B-Instruct large code model. This innovative achievement achieved a significant breakthrough in code generation tasks, successfully surpassing CodeLlama-70B-Instruct and reaching the top of the code generation performance list. The unique feature of StarCoder2-15B-Instruct is its pure self-alignment strategy. The entire training process is open, transparent, and completely autonomous and controllable. The model generates thousands of instructions via StarCoder2-15B in response to fine-tuning the StarCoder-15B base model without relying on expensive manual annotation.
 Yolov10: Detailed explanation, deployment and application all in one place!
Jun 07, 2024 pm 12:05 PM
1. Introduction Over the past few years, YOLOs have become the dominant paradigm in the field of real-time object detection due to its effective balance between computational cost and detection performance. Researchers have explored YOLO's architectural design, optimization goals, data expansion strategies, etc., and have made significant progress. At the same time, relying on non-maximum suppression (NMS) for post-processing hinders end-to-end deployment of YOLO and adversely affects inference latency. In YOLOs, the design of various components lacks comprehensive and thorough inspection, resulting in significant computational redundancy and limiting the capabilities of the model. It offers suboptimal efficiency, and relatively large potential for performance improvement. In this work, the goal is to further improve the performance efficiency boundary of YOLO from both post-processing and model architecture. to this end
 Tsinghua University took over and YOLOv10 came out: the performance was greatly improved and it was on the GitHub hot list
Jun 06, 2024 pm 12:20 PM
The benchmark YOLO series of target detection systems has once again received a major upgrade. Since the release of YOLOv9 in February this year, the baton of the YOLO (YouOnlyLookOnce) series has been passed to the hands of researchers at Tsinghua University. Last weekend, the news of the launch of YOLOv10 attracted the attention of the AI community. It is considered a breakthrough framework in the field of computer vision and is known for its real-time end-to-end object detection capabilities, continuing the legacy of the YOLO series by providing a powerful solution that combines efficiency and accuracy. Paper address: https://arxiv.org/pdf/2405.14458 Project address: https://github.com/THU-MIG/yo
 How to evaluate the cost-effectiveness of commercial support for Java frameworks
Jun 05, 2024 pm 05:25 PM
Evaluating the cost/performance of commercial support for a Java framework involves the following steps: Determine the required level of assurance and service level agreement (SLA) guarantees. The experience and expertise of the research support team. Consider additional services such as upgrades, troubleshooting, and performance optimization. Weigh business support costs against risk mitigation and increased efficiency.
 Google Gemini 1.5 technical report: Easily prove Mathematical Olympiad questions, the Flash version is 5 times faster than GPT-4 Turbo
Jun 13, 2024 pm 01:52 PM
In February this year, Google launched the multi-modal large model Gemini 1.5, which greatly improved performance and speed through engineering and infrastructure optimization, MoE architecture and other strategies. With longer context, stronger reasoning capabilities, and better handling of cross-modal content. This Friday, Google DeepMind officially released the technical report of Gemini 1.5, which covers the Flash version and other recent upgrades. The document is 153 pages long. Technical report link: https://storage.googleapis.com/deepmind-media/gemini/gemini_v1_5_report.pdf In this report, Google introduces Gemini1
 Review! Comprehensively summarize the important role of basic models in promoting autonomous driving
Jun 11, 2024 pm 05:29 PM
Written above & the author’s personal understanding: Recently, with the development and breakthroughs of deep learning technology, large-scale foundation models (Foundation Models) have achieved significant results in the fields of natural language processing and computer vision. The application of basic models in autonomous driving also has great development prospects, which can improve the understanding and reasoning of scenarios. Through pre-training on rich language and visual data, the basic model can understand and interpret various elements in autonomous driving scenarios and perform reasoning, providing language and action commands for driving decision-making and planning. The base model can be data augmented with an understanding of the driving scenario to provide those rare feasible features in long-tail distributions that are unlikely to be encountered during routine driving and data collection.
 How does the learning curve of PHP frameworks compare to other language frameworks?
Jun 06, 2024 pm 12:41 PM
The learning curve of a PHP framework depends on language proficiency, framework complexity, documentation quality, and community support. The learning curve of PHP frameworks is higher when compared to Python frameworks and lower when compared to Ruby frameworks. Compared to Java frameworks, PHP frameworks have a moderate learning curve but a shorter time to get started.
 How do the lightweight options of PHP frameworks affect application performance?
Jun 06, 2024 am 10:53 AM
The lightweight PHP framework improves application performance through small size and low resource consumption. Its features include: small size, fast startup, low memory usage, improved response speed and throughput, and reduced resource consumption. Practical case: SlimFramework creates REST API, only 500KB, high responsiveness and high throughput


