

Generally, we use scatter plots for cluster visualization, but scatter plots are not ideal for visualizing certain clustering algorithms, so in this article, we introduce how to use dendrograms ( Dendrograms) to visualize our clustering results.
A treemap is a diagram that shows hierarchical relationships between objects, groups, or variables. A dendrogram consists of branches connected at nodes or clusters that represent groups of observations with similar characteristics. The height of a branch or the distance between nodes indicates how different or similar the groups are. That is, the longer the branches or the greater the distance between nodes, the less similar the groups are. The shorter the branches or the smaller the distance between nodes, the more similar the groups are.
Dendograms are useful for visualizing complex data structures and identifying subgroups or clusters of data with similar characteristics. They are commonly used in biology, genetics, ecology, social sciences, and other fields where data can be grouped based on similarity or correlation.
Background knowledge:
The word "dendrogram" comes from the Greek words "dendron" (tree) and "gramma" (drawing). In 1901, British mathematician and statistician Karl Pearson used tree diagrams to show the relationships between different plant species. He called this graph a "cluster graph." This can be considered the first use of dendrograms.
We will use the real stock prices of several companies for clustering. For easy access, data is collected using the free API provided by Alpha Vantage. Alpha Vantage provides both free API and premium API. Access through the API requires a key, please refer to his website.
import pandas as pd
 import requests

 companies={'Apple':'AAPL','Amazon':'AMZN','Facebook':'META','Tesla':'TSLA','Alphabet (Google)':'GOOGL','Shell':'SHEL','Suncor Energy':'SU',
'Exxon Mobil Corp':'XOM','Lululemon':'LULU','Walmart':'WMT','Carters':'CRI','Childrens Place':'PLCE','TJX Companies':'TJX',
'Victorias Secret':'VSCO','MACYs':'M','Wayfair':'W','Dollar Tree':'DLTR','CVS Caremark':'CVS','Walgreen':'WBA','Curaleaf':'CURLF'}Twenty companies were selected from technology, retail, oil and gas and other industries.
import time

 all_data={}
 for key,value in companies.items():
 # Replace YOUR_API_KEY with your Alpha Vantage API key
 url = f'https://www.alphavantage.co/query?function=TIME_SERIES_DAILY_ADJUSTED&symbol={value}&apikey=<YOUR_API_KEY>&outputsize=full'
 response = requests.get(url)
 data = response.json()
 time.sleep(15)
 if 'Time Series (Daily)' in data and data['Time Series (Daily)']:
 df = pd.DataFrame.from_dict(data['Time Series (Daily)'], orient='index')
 print(f'Received data for {key}')
 else:
 print("Time series data is empty or not available.")
 df.rename(columns = {'1. open':key}, inplace = True)
all_data[key]=df[key]The above code sets a 15-second pause between API calls to ensure that it will not be blocked too frequently.
# find common dates among all data frames
 common_dates = None
 for df_key, df in all_data.items():
 if common_dates is None:
 common_dates = set(df.index)
 else:
 common_dates = common_dates.intersection(df.index)

 common_dates = sorted(list(common_dates))

 # create new data frame with common dates as index
 df_combined = pd.DataFrame(index=common_dates)

 # reindex each data frame with common dates and concatenate horizontally
 for df_key, df in all_data.items():
 df_combined = pd.concat([df_combined, df.reindex(common_dates)], axis=1)
Integrate the above data into the DF we need, and then you can use it directly
Hierarchical clustering clustering) is a clustering algorithm used in machine learning and data analysis. It uses a hierarchy of nested clusters to group similar objects into clusters based on similarity. The algorithm can be either agglomerative, which starts with single objects and merges them into clusters, or divisive, which starts with a large cluster and recursively divides it into smaller clusters.
It should be noted that not all clustering methods are hierarchical clustering methods, and dendrograms can only be used on a few clustering algorithms.
Clustering Algorithm We will use hierarchical clustering provided in scipy module.
import numpy as np
 import scipy.cluster.hierarchy as sch
 import matplotlib.pyplot as plt

 # Convert correlation matrix to distance matrix
 dist_mat = 1 - df_combined.corr()

 # Perform top-down clustering
 clustering = sch.linkage(dist_mat, method='complete')
 cuts = sch.cut_tree(clustering, n_clusters=[3, 4])

 # Plot dendrogram
 plt.figure(figsize=(10, 5))
 sch.dendrogram(clustering, labels=list(df_combined.columns), leaf_rotation=90)
 plt.title('Dendrogram of Company Correlations (Top-Down Clustering)')
 plt.xlabel('Companies')
 plt.ylabel('Distance')
 plt.show()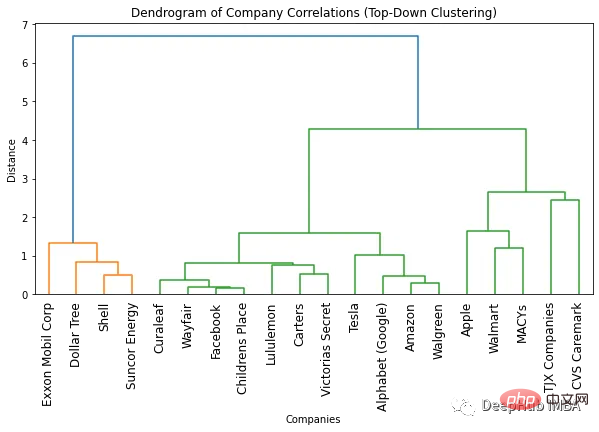
The easiest way to find the optimal number of clusters is to look at the number of colors used in the resulting dendrogram. The optimal number of clusters is one less than the number of colors. So according to the dendrogram above, the optimal number of clusters is two.
Another way to find the optimal number of clusters is to identify points where the distance between clusters suddenly changes. This is called the "inflection point" or "elbow point" and can be used to determine the number of clusters that best captures the variation in the data. We can see in the above figure that the maximum distance change between different numbers of clusters occurs between 1 and 2 clusters. So again, the optimal number of clusters is two.
One advantage of using a dendrogram is that you can cluster objects into any number of clusters by looking at the dendrogram. For example, if you need to find two clusters, you can look at the top vertical line on the dendrogram and decide on the clusters. For example, in this example, if two clusters are required, then there are four companies in the first cluster and 16 companies in the second cluster. If we need three clusters we can further split the second cluster into 11 and 5 companies. If you need more, you can follow this example.
import numpy as np
 import scipy.cluster.hierarchy as sch
 import matplotlib.pyplot as plt

 # Convert correlation matrix to distance matrix
 dist_mat = 1 - df_combined.corr()

 # Perform bottom-up clustering
 clustering = sch.linkage(dist_mat, method='ward')

 # Plot dendrogram
 plt.figure(figsize=(10, 5))
 sch.dendrogram(clustering, labels=list(df_combined.columns), leaf_rotation=90)
 plt.title('Dendrogram of Company Correlations (Bottom-Up Clustering)')
 plt.xlabel('Companies')
 plt.ylabel('Distance')
 plt.show()
We are doing bottom-up clustering The dendrogram obtained by the classes is similar to top-down clustering. The optimal number of clusters is still two (based on the number of colors and the "inflection point" method). But if we require more clusters, some subtle differences will be observed. This is normal because the methods used are different, resulting in slight differences in the results.
Dendrograms are a useful tool for visualizing complex data structures and identifying subgroups or clusters of data with similar characteristics. In this article, we use hierarchical clustering methods to demonstrate how to create a dendrogram and how to determine the optimal number of clusters. For our data tree diagrams are helpful in understanding the relationships between different companies, but they can also be used in a variety of other areas to understand the hierarchical structure of data.
The above is the detailed content of Visualizing clusters using dendrograms. For more information, please follow other related articles on the PHP Chinese website!


![[Web front-end] Node.js quick start](https://img.php.cn/upload/course/000/000/067/662b5d34ba7c0227.png)


