How to plot convex hull in Python?
ConvexHull
ConvexHull is a class in spatial. Its main function is to find the edges of a set of points and make a convex hull. The necessary initialization parameter is a point set, the point set format is an array of n×m dimensions, n is the number of points in the point set, and m is the dimension of the point.
from scipy.spatial import ConvexHull
import matplotlib.pyplot as plt
import numpy as np

pts = np.random.rand(30, 2)
hull = ConvexHull(pts)
plt.plot(pts[:,0], pts[:,1], 'o')
for i in hull.simplices:
    plt.plot(pts[i, 0], pts[i, 1], 'k-')

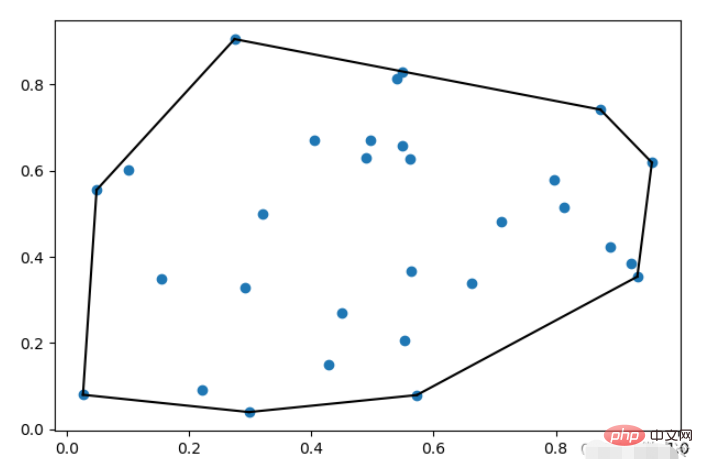
plt.show()simplex is the serial number of the index point. The effect after drawing is as follows

ConvexHull has two optional parameters, among which, incremental is a Boolean parameter. When it is True, new points are allowed to be added.
The specific parameters of qhull_options can be viewed in qhull. Only QG will be demonstrated below.
QG
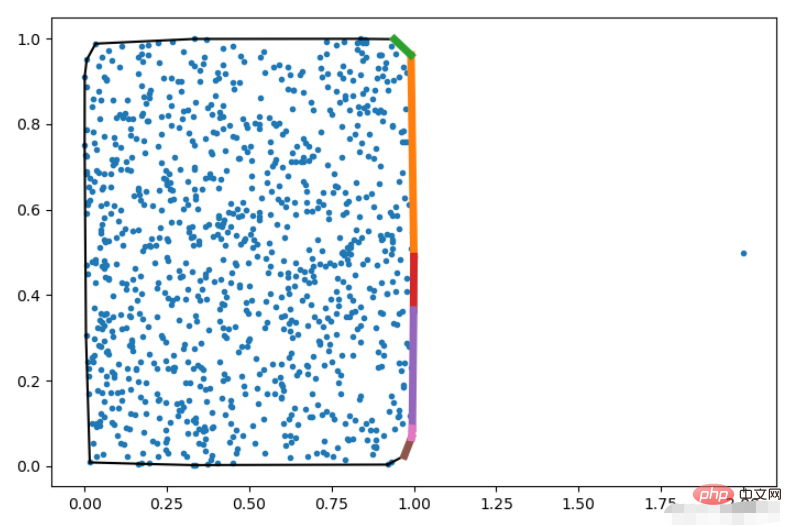
QGn means treating the nth point as an observation point. After dividing the point set by convex hull, if the vertices are connected and used as a wall, then the observation point can The points that can be seen are marked as good, and the effect is as follows
pts = np.random.rand(1000, 2)
# 添加一个观察点
pts = np.vstack([pts, np.array([[2,0.5]])])
hull = ConvexHull(pts, qhull_options='QG1000')
plt.plot(pts[:,0], pts[:,1], '.')
for i in hull.simplices:
    plt.plot(pts[i, 0], pts[i, 1], 'k-')

for i in hull.simplices[hull.good]:
    plt.plot(pts[i, 0],pts[i, 1], lw=5)

plt.show()The effect is as shown in the figure

Three-dimensional situation
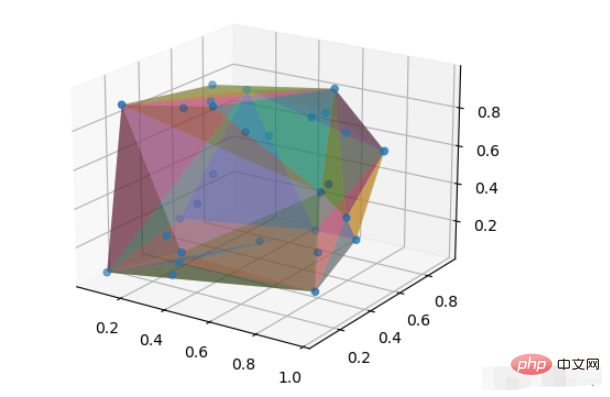
The convex hull in two dimensions is obviously a closed figure composed of lines, while the convex hull in three dimensions should naturally be a three-dimensional geometry. Expanded to any dimension, the convex hull is actually a simplex. The simplices in ConvexHull are the points that form the simplex and are indexed in the origin set. An example is as follows
pts = np.random.rand(30, 3)
hull = ConvexHull(pts)
ax = plt.subplot(projection='3d')
ax.scatter(pts[:,0], pts[:,1], pts[:,2])
for i in hull.simplices:
    ax.plot_trisurf(pts[i, 0], pts[i, 1], pts[i,2], alpha=0.5)

plt.show()The alpha parameter is used to adjust the transparency of the triangular surface, so that the points inside the convex hull can be seen through the convex hull.
The effect is as follows

ConvexHull attribute
The concept of a simplex has been introduced before, that is, the figure composed of the convex hull is a simplex . As a two-dimensional case, the convex hull is surrounded by line segments; in the three-dimensional case, the convex hull is surrounded by planes; extended to any dimension, it can be expressed as a simplex that constitutes the convex hull, surrounded by hypersurfaces. Since the concept of hypersurface has no boundaries, the convex hull surface with vertices and edges is referred to as a simplex hypersurface in the following.
The commonly used attributes in the ConvexHull class are as follows
points Point set surrounded by convex hull
vertices Simplex vertices at points Concentrated indexes
simplices Simplex metasurface vertices
neighbors Indexes of hypersurface adjacent hypersurfaces
equations Parameters of hypersurface equations
Examples of hypersurface equations in three dimensions are as follows, that is, each hypersurface has 4 parameters
>>> hull.equations
array([[-0.5509472 ,  0.72386104, -0.41530999, -0.36369123],
       [-0.26155355,  0.16210178, -0.95147925,  0.02022163],
       [-0.99132368, -0.0460725 ,  0.12310441,  0.045523  ],
       [-0.98526526, -0.07170442,  0.15527666,  0.04749854],
       [-0.15900968, -0.98529789, -0.06248198,  0.13294496],
# .......The above is the detailed content of How to plot convex hull in Python?. For more information, please follow other related articles on the PHP Chinese website!

Hot AI Tools

Undresser.AI Undress
AI-powered app for creating realistic nude photos

AI Clothes Remover
Online AI tool for removing clothes from photos.

Undress AI Tool
Undress images for free

Clothoff.io
AI clothes remover

AI Hentai Generator
Generate AI Hentai for free.

Hot Article

Hot Tools

Notepad++7.3.1
Easy-to-use and free code editor

SublimeText3 Chinese version
Chinese version, very easy to use

Zend Studio 13.0.1
Powerful PHP integrated development environment

Dreamweaver CS6
Visual web development tools

SublimeText3 Mac version
God-level code editing software (SublimeText3)

Hot Topics
 Is there any mobile app that can convert XML into PDF?
Apr 02, 2025 pm 08:54 PM
An application that converts XML directly to PDF cannot be found because they are two fundamentally different formats. XML is used to store data, while PDF is used to display documents. To complete the transformation, you can use programming languages and libraries such as Python and ReportLab to parse XML data and generate PDF documents.
 Is there a mobile app that can convert XML into PDF?
Apr 02, 2025 pm 09:45 PM
There is no APP that can convert all XML files into PDFs because the XML structure is flexible and diverse. The core of XML to PDF is to convert the data structure into a page layout, which requires parsing XML and generating PDF. Common methods include parsing XML using Python libraries such as ElementTree and generating PDFs using ReportLab library. For complex XML, it may be necessary to use XSLT transformation structures. When optimizing performance, consider using multithreaded or multiprocesses and select the appropriate library.
 What is the process of converting XML into images?
Apr 02, 2025 pm 08:24 PM
To convert XML images, you need to determine the XML data structure first, then select a suitable graphical library (such as Python's matplotlib) and method, select a visualization strategy based on the data structure, consider the data volume and image format, perform batch processing or use efficient libraries, and finally save it as PNG, JPEG, or SVG according to the needs.
 How to beautify the XML format
Apr 02, 2025 pm 09:57 PM
XML beautification is essentially improving its readability, including reasonable indentation, line breaks and tag organization. The principle is to traverse the XML tree, add indentation according to the level, and handle empty tags and tags containing text. Python's xml.etree.ElementTree library provides a convenient pretty_xml() function that can implement the above beautification process.
 How to convert XML files to PDF on your phone?
Apr 02, 2025 pm 10:12 PM
It is impossible to complete XML to PDF conversion directly on your phone with a single application. It is necessary to use cloud services, which can be achieved through two steps: 1. Convert XML to PDF in the cloud, 2. Access or download the converted PDF file on the mobile phone.
 How to open xml format
Apr 02, 2025 pm 09:00 PM
Use most text editors to open XML files; if you need a more intuitive tree display, you can use an XML editor, such as Oxygen XML Editor or XMLSpy; if you process XML data in a program, you need to use a programming language (such as Python) and XML libraries (such as xml.etree.ElementTree) to parse.
 Is the conversion speed fast when converting XML to PDF on mobile phone?
Apr 02, 2025 pm 10:09 PM
The speed of mobile XML to PDF depends on the following factors: the complexity of XML structure. Mobile hardware configuration conversion method (library, algorithm) code quality optimization methods (select efficient libraries, optimize algorithms, cache data, and utilize multi-threading). Overall, there is no absolute answer and it needs to be optimized according to the specific situation.
 How to convert XML to PDF on your phone?
Apr 02, 2025 pm 10:18 PM
It is not easy to convert XML to PDF directly on your phone, but it can be achieved with the help of cloud services. It is recommended to use a lightweight mobile app to upload XML files and receive generated PDFs, and convert them with cloud APIs. Cloud APIs use serverless computing services, and choosing the right platform is crucial. Complexity, error handling, security, and optimization strategies need to be considered when handling XML parsing and PDF generation. The entire process requires the front-end app and the back-end API to work together, and it requires some understanding of a variety of technologies.


