

How to use the Python visualization plotly framework

1. Introduction
Plotly is a very famous and powerful open source data visualization framework. It displays interactive charts in the form of web based on browser display. information and create dozens of beautiful charts and maps.
2. Drawing grammar rules
2.1 Offline drawing method
There are two ways to draw images in Plotly, online and offline. Drawing requires registering an account to obtain an API key, which is more troublesome, so this article only introduces the offline drawing method.
There are two methods for offline drawing: plotly.offline.plot() and plotly.offline.iplot(). The former generates image files in html format in the current working directory in an offline way. and automatically open;
The latter is a special method in jupyter notebook, which embeds the generated graphics into the ipynb file. This article adopts the latter method (note that plotly is used in jupyter notebook .offline.iplot(), you need to run plotly.offline.init_notebook_mode() before to complete the initialization of the drawing code, otherwise an error will be reported).
The main parameters of plotly.offline.iplot() are as follows:
figure_or_data: Pass in plotly.graph_objs.Figure, plotly Composed of .graph_objs.Data, dictionary or list, it can describe the data of a graph
show_link: bool type, used to adjust whether the output image has a plotly mark in the lower right corner
#link_text: str type input, used to set the description text content in the lower right corner of the image (when show_link=True), the default is 'Export to plot.ly'
image: str type or None, controls the download format of the generated image, including 'png', 'jpeg', 'svg', 'webp', the default is None, that is, it will not Set the download method for the generated image
filename: str type, controls the file name of the saved image, the default is 'plot'
image_height: int type, the pixel value that controls the image height, the default is 600
image_width: int type, the pixel value that controls the image width, the default is 800
The following is a simple example:
import plotly
import plotly.graph_objs as go
'''初始化jupyter notebook中的绘图模式'''
plotly.offline.init_notebook_mode()
'''绘制一个基本的折线图,控制其尺寸为1600x600'''
plotly.offline.iplot([{'x': [1, 2, 3], 'y': [5, 2, 7]}],
 image_height=600,
 image_width=1600)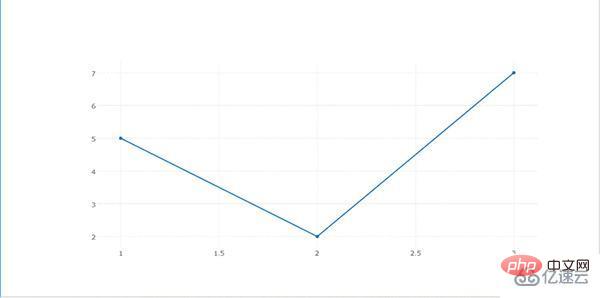
Help on package plotly.graph_objs in plotly:
NAME
 plotly.graph_objs
DESCRIPTION
 graph_objs
 ==========
 This package imports definitions for all of Plotly's graph objects. For more
 information, run help(Obj) on any of the following objects defined here.
 The reason for the package graph_objs and the module graph_objs is to provide
 a clearer API for users.
PACKAGE CONTENTS
 _area
 _bar
 _box
 _candlestick
 _carpet
 _choropleth
 _cone
 _contour
 _contourcarpet
 _deprecations
 _figure
 _figurewidget
 _frame
 _heatmap
 _heatmapgl
 _histogram
 _histogram2d
 _histogram2dcontour
 _layout
 _mesh4d
 _ohlc
 _parcoords
 _pie
 _pointcloud
 _sankey
 _scatter
 _scatter3d
 _scattercarpet
 _scattergeo
 _scattergl
 _scattermapbox
 _scatterpolar
 _scatterpolargl
 _scatterternary
 _splom
 _surface
 _table
 _violin
 area (package)
 bar (package)
 box (package)
 candlestick (package)
 carpet (package)
 choropleth (package)
 cone (package)
 contour (package)
 contourcarpet (package)
 graph_objs
 graph_objs_tools
 heatmap (package)
 heatmapgl (package)
 histogram (package)
 histogram2d (package)
 histogram2dcontour (package)
 layout (package)
 mesh4d (package)
 ohlc (package)
 parcoords (package)
 pie (package)
 pointcloud (package)
 sankey (package)
 scatter (package)
 scatter3d (package)
 scattercarpet (package)
 scattergeo (package)
 scattergl (package)
 scattermapbox (package)
 scatterpolar (package)
 scatterpolargl (package)
 scatterternary (package)
 splom (package)
 surface (package)
 table (package)
 violin (package)
DATA
 absolute_import = _Feature((2, 5, 0, 'alpha', 1), (3, 0, 0, 'alpha', 0...
FILE
 d:anacondalibsite-packagesplotlygraph_objs__init__.py
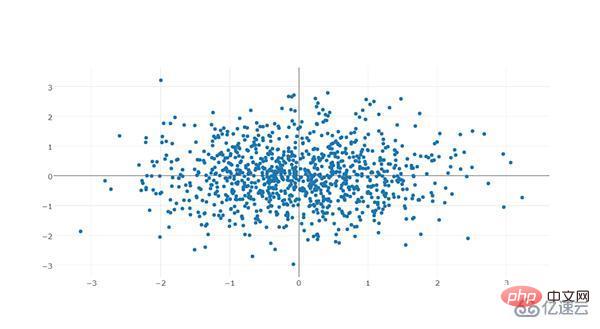
import plotly
import plotly.graph_objs as go
import numpy as np
'''构造1000个服从二维正态分布的模拟数据'''
N = 1000
random_x = np.random.randn(N)
random_y = np.random.randn(N)
'''构造trace,配置相关参数'''
trace = go.Scatter(
 x = random_x,
 y = random_y,
 mode = 'markers'
)
'''将trace保存于列表之中'''
data = [trace]
'''启动绘图'''
plotly.offline.init_notebook_mode()
plotly.offline.iplot(data, filename='basic-scatter')
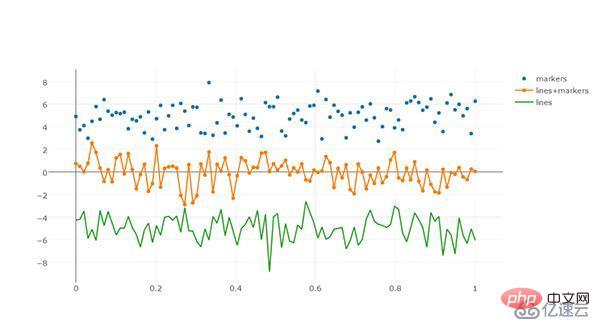
import numpy as np
import plotly
import plotly.graph_objs as go
'''创建仿真数据'''
N = 100
random_x = np.linspace(0, 1, N)
random_y0 = np.random.randn(N)+5
random_y1 = np.random.randn(N)
random_y2 = np.random.randn(N)-5
'''构造trace0'''
trace0 = go.Scatter(
 x = random_x,
 y = random_y0,
 mode = 'markers',
 name = 'markers'
)
'''构造trace1'''
trace1 = go.Scatter(
 x = random_x,
 y = random_y1,
 mode = 'lines+markers',
 name = 'lines+markers'
)
'''构造trace2'''
trace2 = go.Scatter(
 x = random_x,
 y = random_y2,
 mode = 'lines',
 name = 'lines'
)
'''将所有trace保存在列表中'''
data = [trace0, trace1, trace2]
'''启动绘图'''
plotly.offline.init_notebook_mode()
plotly.offline.iplot(data, filename='scatter-mode')
2.4.1 Text
Text is a very important part of a picture, and plotly is very powerful. The drawing mechanism of APP has carefully divided the text in a picture, and can personalize the font of a certain component part in a very targeted way:
- font: Font type, used to control the global font part of the image. Its common keys and functions are as follows:
- family: str type , used to control fonts, the default is 'Open Sans', the options are 'verdana', 'arial', 'sans-serif', etc., please refer to the official website documentation for details
- size: int type, used to control the font size, the default is 12
- color: str type, passed in hexadecimal color, the default is '# 444'
import plotly
import plotly.graph_objs as go
import numpy as np
'''构造1000个服从二维正态分布的模拟数据'''
N = 1000
random_x = np.random.randn(N)
random_y = np.random.randn(N)
'''构造trace,配置相关参数'''
trace = go.Scatter(
 x = random_x,
 y = random_y,
 mode = 'markers'
)
'''将trace保存于列表之中'''
data = [trace]
'''创建layout对象'''
layout = go.Layout(title='测试',
 font={
 'size':22,
 'family':'sans-serif',
 'color':'9ed900'#将全局字体颜色设置颜色为葱绿
 })
'''将graph部分和layout部分组合成figure对象'''
fig = go.Figure(data=data, layout=layout)
'''启动绘图直接绘制figure对象'''
plotly.offline.init_notebook_mode()
plotly.offline.iplot(fig,filename='basic-scatter')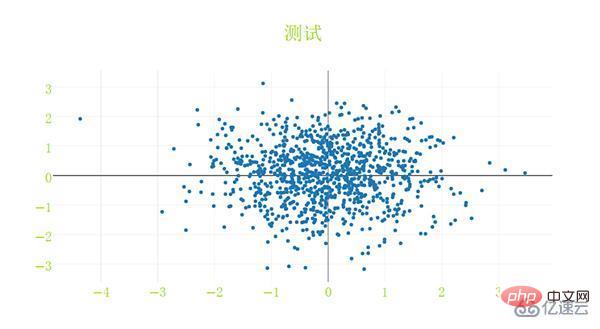
标题文字:
title:str型,用于控制图像的主标题
titlefont:字典型,用于独立控制标题字体的部分,其常用键如下:
family:同font中的family,用于单独控制标题字体
size:int型,控制标题的字体大小
color:同font中的color
下面是一个简单的例子:
import plotly
import plotly.graph_objs as go
import numpy as np
'''构造1000个服从二维正态分布的模拟数据'''
N = 1000
random_x = np.random.randn(N)
random_y = np.random.randn(N)
'''构造trace,配置相关参数'''
trace = go.Scatter(
x = random_x,
y = random_y,
mode = 'markers'
)
'''将trace保存于列表之中'''
data = [trace]
'''创建layout对象'''
layout = go.Layout(title='测试',
titlefont={
'size':20,
'color':'9ed900'#将标题字体颜色设置颜色为葱绿
})
'''将graph部分和layout部分组合成figure对象'''
fig = go.Figure(data=data, layout=layout)
'''启动绘图直接绘制figure对象'''
plotly.offline.init_notebook_mode()
plotly.offline.iplot(fig,filename='basic-scatter')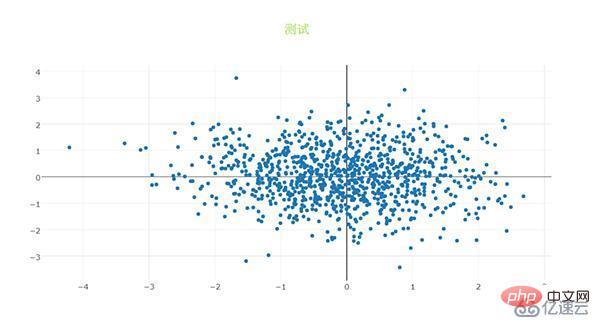
2.4.2 坐标轴
xaxis或yaxis:字典型,控制横坐标的各属性,其主要键如下:
color:str型,传入十六进制色彩,控制横坐标上所有元素的基础颜色(在未单独指定颜色之前,这些元素均采用此处color指定的颜色)
title:str型,设置横坐标轴上的标题
titlefont:字典型,同之前所有同名参数
type:str型,用于控制横坐标轴类型,'-'表示根据输入数据自适应调整,'linear'表示线性坐标轴,'log'表示对数坐标轴,'date'表示日期型坐标轴,'category'表示分类型坐标轴,默认为'-'
autorange:bool型或'reversed',控制是否根据横坐标对应的数据自动调整坐标轴范围,默认为True
range:list型,控制横坐标轴的区间范围,自行设置无默认项,取决于横坐标轴的数据类型,格式均为[左端点,右端点]
tickmode:str型,设置坐标轴刻度的格式,'auto'表示自动根据输入的数据来决定,'linear'表示线性的数值型,'array'表示由自定义的数组来表示(用数组来自定义刻度标签时必须选择此项)
tickvals:list、numpy array或pandas中的series,作为坐标轴刻度标签的替代(tickmode此时必须被设置为'array')
ticks:str型,控制刻度标签的书写位置,'outside'表示在外侧显示,'inside'表示在内侧显示,''表示不显示
ticklen:int型,设置刻度标签的像素长度
tickwidth:int型,设置刻度标签的像素宽度
tickcolor:str型,传入十六进制色彩,用于控制刻度标签的颜色
tickfont:字典型,同前面所有字典型字体控制参数,用于对刻度标签进行单独控制
tickangle:int型,设置刻度标签的旋转角度
showline:bool型,控制是否绘制出该坐标轴上的直线部分
linecolor:str型,十六进制色彩,控制坐标轴线条的色彩
linewidth:int型,设置坐标轴直线部分的像素宽度
showgrid:bool型,控制是否绘制网格线
gridcolor:str型,十六进制色彩,控制网格线的颜色
gridwidth:int型,控制网格线的像素宽度
zeroline:bool型,控制是否在0值处绘制0刻度线
side:str型,控制x(y)轴放置于作图区域的位置,'top'、'bottom'控制横轴放置于顶部亦或是底部;'left'、'right'控制纵轴放置于左侧亦或是右侧
下面是几个简单的示例。
1. 对横纵坐标轴标题字体进行修改。
import plotly
import plotly.graph_objs as go
import numpy as np
'''构造1000个服从二维正态分布的模拟数据'''
N = 1000
random_x = np.random.randn(N)
random_y = np.random.randn(N)
'''构造trace,配置相关参数'''
trace = go.Scatter(
 x = random_x,
 y = random_y,
 mode = 'markers'
)
'''将trace保存于列表之中'''
data = [trace]
'''创建layout对象,对横纵坐标轴的标题进行一定的设置'''
layout = go.Layout(xaxis={
 'title':'这是横坐标轴',
 'titlefont':{
 'size':30
 }
},yaxis={
 'title':'这是纵坐标轴',
 'titlefont':{
 'size':40
 }
})
'''将graph部分和layout部分组合成figure对象'''
fig = go.Figure(data=data, layout=layout)
'''启动绘图直接绘制figure对象'''
plotly.offline.init_notebook_mode()
plotly.offline.iplot(fig,filename='basic-scatter')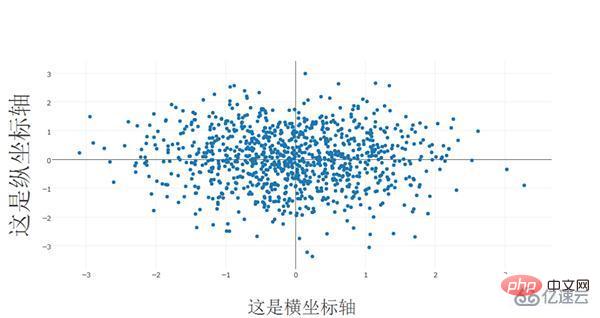
2. 对横纵方向的坐标轴线条及网格进行设置
import plotly
import plotly.graph_objs as go
import numpy as np
'''构造1000个服从二维正态分布的模拟数据'''
N = 1000
random_x = np.random.randn(N)
random_y = np.random.randn(N)
'''构造trace,配置相关参数'''
trace = go.Scatter(
 x = random_x,
 y = random_y,
 mode = 'markers'
)
'''将trace保存于列表之中'''
data = [trace]
'''创建layout对象,对横纵坐标轴的线条及网格颜色进行一定的设置'''
layout = go.Layout(xaxis={
 'showline':False,
 'showgrid':True,
 'zeroline':False,
 'showgrid':True,
 'gridcolor':'7fecad'
 },yaxis={
'showline':False,
 'showgrid':True,
 'gridcolor':'#3d3b4f',
 'zeroline':False
})
'''将graph部分和layout部分组合成figure对象'''
fig = go.Figure(data=data, layout=layout)
'''启动绘图直接绘制figure对象'''
plotly.offline.init_notebook_mode()
plotly.offline.iplot(fig,filename='basic-scatter')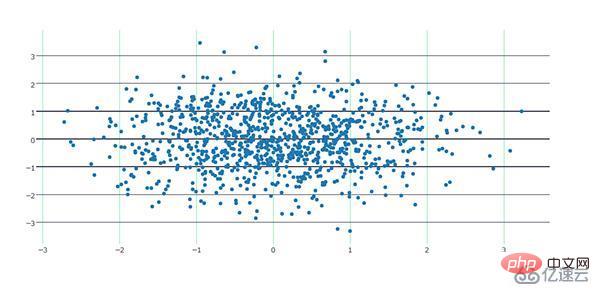
2.4.3 图例
showlegend:bool型,控制是否绘制图例
legend:字典型,用于控制用图例相关的所有属性的设置,主要键如下:
bgcolor:str型,十六进制设置图例背景颜色
bordercolor:设置图例边框的颜色
borderwidth:int型,设置图例边框的颜色
font:字典型,设置图例文字部分的字体,同前面所有font设置规则
orientation:str型,设置图例各元素的堆叠方向,'v'表示竖直,'h'表示水平堆叠
x:数值型,-2到3之间,用于设置图例在水平方向上的位置,默认为1.02
xanchor:str型,用于直接设置图例水平位置的固定位置,有'left'、'center'、'right'和'auto'几个可选项
y:数值型,-2到3之间,用于设置图例在竖直方向上的位置,默认为1
yanchor:str型,用于直接设置图例竖直方向上的固定位置,有'top'、'middle'、'bottom'和'auto'几个选项
下面是一个简单的例子。
将图例的位置挪动到图像中心,即百分比上(0.5,0.5)的位置:
import numpy as np
import plotly
import plotly.graph_objs as go
'''创建仿真数据'''
N = 100
random_x = np.linspace(0, 1, N)
random_y0 = np.random.randn(N)+5
random_y1 = np.random.randn(N)
random_y2 = np.random.randn(N)-5
'''构造trace0'''
trace0 = go.Scatter(
 x = random_x,
 y = random_y0,
 mode = 'markers',
 name = 'markers'
)
'''构造trace1'''
trace1 = go.Scatter(
 x = random_x,
 y = random_y1,
 mode = 'lines+markers',
 name = 'lines+markers'
)
'''构造trace2'''
trace2 = go.Scatter(
 x = random_x,
 y = random_y2,
 mode = 'lines',
 name = 'lines'
)
'''将所有trace保存在列表中'''
data = [trace0, trace1, trace2]
'''构造layout对象,对图例位置进行一定的设置'''
layout = go.Layout(legend={
 'x':0.5,
 'y':0.5
})
'''构造figure对象'''
fig = go.Figure(data=data,layout=layout)
'''启动绘图'''
plotly.offline.init_notebook_mode()
plotly.offline.iplot(fig, filename='scatter-mode')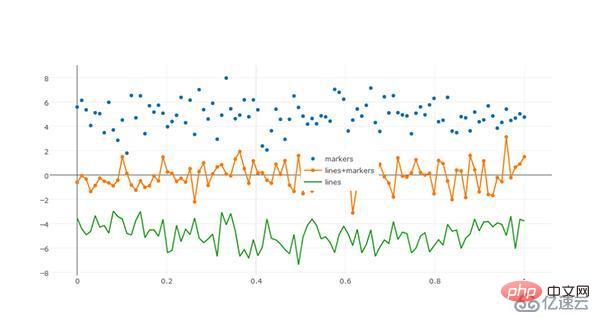
2.4.4 其它杂项
width:int型,控制图像的像素宽度,默认为700
height:int型,控制图像的像素高度,默认为450
margin:字典型输入,控制图像边界的宽度,其主要键如下:
l:int型,控制图像距离左边界的留白区域像素宽度,默认为80
r:int型,控制图像距离右边界的留白区域像素宽度,默认为80
t:int型,控制图像距离上边界的留白区域像素宽度,默认为100
b:int型,控制图像距离下边界的留白区域像素宽度,默认为80
pad:int型,控制坐标轴与图像区域的像素距离,默认为0
paper_bgcolor:str型,传入十六进制色彩,控制图床的颜色
plot_bgcolor:str型,传入十六进制色彩,控制绘图区域的颜色
hidesources:bool型,控制是否在图像的右下角标记来源link
hovermode:str型或False,用于设置悬停交互的方式,有'x'、'y'、'closest'和False这几个可选项,False表示无悬停交互方式
hoverlabel:字典型输入,用于控制悬停时出现的信息框的各属性,主要键如下:
bgcolor:str型,传入十六进制色彩,控制信息框的背景色
bordercolor:str型,传入十六进制色彩,控制信息框边框的颜色
font:字典型,控制信息框中字体的各属性,其主要键如下:
family:同之前,控制字体
size:int型,控制字体大小,默认13
color:str型,传入十六进制色彩,控制字体颜色
namelength:int型,控制对信息框中显示的对应trace的名字的长度限制,建议设置为-1,即全部显示,默认为15,即对于长于15的trace只显示前15个字符
grid:字典型,控制一页多图(subplots)时的规划多个图的网格的属性,其常用键如下:
rows:int型,控制网格中的行数(放置笛卡尔坐标系类型的子图),也可以设置多于实际绘图需求的行数以达到留白的目的
roworder:str型,设置子图按行,是从下往上叠加还是从上往下叠加,对应'top to bottom'和'bottom to top',默认为'top to bottm',注意,只可以设置行的叠加顺序,列方向上的叠加顺序始终为从左往右
columns:int型,同rows,控制网格的列数
pattern:str型,用于控制一页多图中子图之间坐标轴的共享情况,'coupled'表示每一列共享同一个x轴,每一行共享一个y轴,'independent'表示每个子图xy轴独立(这在进行量纲相差较大的子图的绘制尤为有用)
xgap:float型,0.0-1.0之间,用于控制子图之间的水平空白区域宽度占一个子图宽度的百分比
ygap:同xgap,控制竖直方向上子图之间的宽度
domain:字典型,设置一页多图时,子图占据的区域距离上下左右边界的宽度情况,其主要键如下:
x:list型,格式为[x1,x2],x1控制子图区域左端与图床左端的距离,x2控制子图区域右端与图床左端的距离,x1、x2都代表百分比,在0.0-1.0之间取值
y:同x,控制子图区域上下端分别与图床上端的距离百分比
The above is the detailed content of How to use the Python visualization plotly framework. For more information, please follow other related articles on the PHP Chinese website!

Hot AI Tools

Undresser.AI Undress
AI-powered app for creating realistic nude photos

AI Clothes Remover
Online AI tool for removing clothes from photos.

Undress AI Tool
Undress images for free

Clothoff.io
AI clothes remover

AI Hentai Generator
Generate AI Hentai for free.

Hot Article
Hot Tools

Notepad++7.3.1
Easy-to-use and free code editor

SublimeText3 Chinese version
Chinese version, very easy to use

Zend Studio 13.0.1
Powerful PHP integrated development environment

Dreamweaver CS6
Visual web development tools

SublimeText3 Mac version
God-level code editing software (SublimeText3)
Hot Topics


 Google AI announces Gemini 1.5 Pro and Gemma 2 for developers
Jul 01, 2024 am 07:22 AM
Google AI announces Gemini 1.5 Pro and Gemma 2 for developers
Jul 01, 2024 am 07:22 AM
Google AI has started to provide developers with access to extended context windows and cost-saving features, starting with the Gemini 1.5 Pro large language model (LLM). Previously available through a waitlist, the full 2 million token context windo
 How to download deepseek Xiaomi
Feb 19, 2025 pm 05:27 PM
How to download deepseek Xiaomi
Feb 19, 2025 pm 05:27 PM
How to download DeepSeek Xiaomi? Search for "DeepSeek" in the Xiaomi App Store. If it is not found, continue to step 2. Identify your needs (search files, data analysis), and find the corresponding tools (such as file managers, data analysis software) that include DeepSeek functions.
 How do you ask him deepseek
Feb 19, 2025 pm 04:42 PM
How do you ask him deepseek
Feb 19, 2025 pm 04:42 PM
The key to using DeepSeek effectively is to ask questions clearly: express the questions directly and specifically. Provide specific details and background information. For complex inquiries, multiple angles and refute opinions are included. Focus on specific aspects, such as performance bottlenecks in code. Keep a critical thinking about the answers you get and make judgments based on your expertise.
 What software is NET40?
May 10, 2024 am 01:12 AM
What software is NET40?
May 10, 2024 am 01:12 AM
.NET 4.0 is Microsoft's software development platform that provides a framework and toolset for building a variety of applications, including web, desktop, and mobile applications. Its features include: Parallel Programming Library (TPL) Parallel LINQ (PLINQ) Dynamic Language Runtime (DLR) Silverlight 5Windows Communication Foundation (WCF) 4.0. Benefits include: Performance improvements Code reusability Cross-platform support Developer-friendliness Security.
 How to search deepseek
Feb 19, 2025 pm 05:18 PM
How to search deepseek
Feb 19, 2025 pm 05:18 PM
Just use the search function that comes with DeepSeek. Its powerful semantic analysis algorithm can accurately understand the search intention and provide relevant information. However, for searches that are unpopular, latest information or problems that need to be considered, it is necessary to adjust keywords or use more specific descriptions, combine them with other real-time information sources, and understand that DeepSeek is just a tool that requires active, clear and refined search strategies.
 How to program deepseek
Feb 19, 2025 pm 05:36 PM
How to program deepseek
Feb 19, 2025 pm 05:36 PM
DeepSeek is not a programming language, but a deep search concept. Implementing DeepSeek requires selection based on existing languages. For different application scenarios, it is necessary to choose the appropriate language and algorithms, and combine machine learning technology. Code quality, maintainability, and testing are crucial. Only by choosing the right programming language, algorithms and tools according to your needs and writing high-quality code can DeepSeek be successfully implemented.
 How to use deepseek to settle accounts
Feb 19, 2025 pm 04:36 PM
How to use deepseek to settle accounts
Feb 19, 2025 pm 04:36 PM
Question: Is DeepSeek available for accounting? Answer: No, it is a data mining and analysis tool that can be used to analyze financial data, but it does not have the accounting record and report generation functions of accounting software. Using DeepSeek to analyze financial data requires writing code to process data with knowledge of data structures, algorithms, and DeepSeek APIs to consider potential problems (e.g. programming knowledge, learning curves, data quality)
 The Key to Coding: Unlocking the Power of Python for Beginners
Oct 11, 2024 pm 12:17 PM
The Key to Coding: Unlocking the Power of Python for Beginners
Oct 11, 2024 pm 12:17 PM
Python is an ideal programming introduction language for beginners through its ease of learning and powerful features. Its basics include: Variables: used to store data (numbers, strings, lists, etc.). Data type: Defines the type of data in the variable (integer, floating point, etc.). Operators: used for mathematical operations and comparisons. Control flow: Control the flow of code execution (conditional statements, loops).
