

Powerful open source Python drawing library


The reason why I have been using matplotlib before is to learn its complex syntax, and the hundreds of hours of time cost have been "sinked" in it. This also resulted in me spending countless late nights searching on StackOverflow for how to “format dates” or “add a second Y-axis”.
But we now have a better choice - such as the easy-to-use, well-documented, and powerful open source Python plotting library Plotly. Today I will give you an in-depth experience and learn how it can draw better charts with super simple (even just one line!) code.
All the code in this article has been open sourced on Github, and all charts are interactive. Please use Jupyter notebook to view.
(Github source code address: https://github.com/WillKoehrsen/Data-Analysis/blob/master/plotly/Plotly Whirlwind Introduction.ipynb)
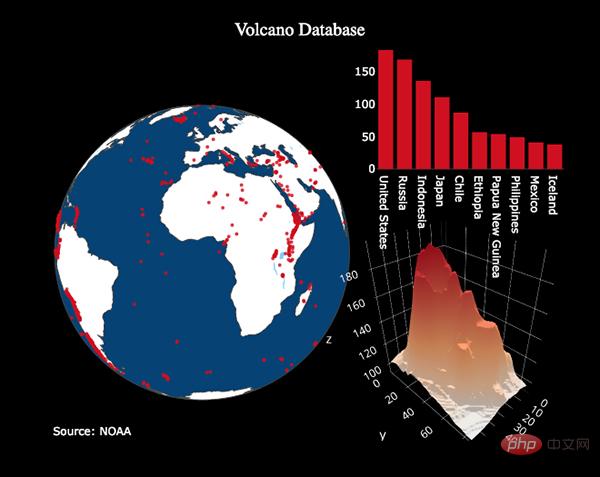
(Example chart drawn by plotly. Image source: plot.ly)
Plotly Overview
plotly's Python package is an open source code library based on plot.js, and then It is based on d3.js. What we actually use is a library that encapsulates plotly, called cufflinks, which makes it easier for you to use plotly and Pandas data tables to work together.
*Note: Plotly itself is a visualization technology company with several different products and open source toolsets. Plotly's Python library is free to use. In offline mode, you can create an unlimited number of charts. In online mode, because Plotly's sharing service is used, you can only generate and share 25 charts.
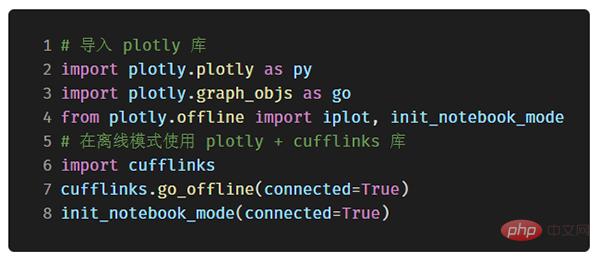
All visualization charts in this article were completed in Jupyter Notebook using the plotly cufflinks library in offline mode. After completing the installation using pip install cufflinks plotly, you can use the following code to complete the import in Jupyter:
Single variable distribution: histogram and box plot Chart
Univariate analysis charts are often the standard practice when starting data analysis, and histograms are basically one of the necessary charts for univariate distribution analysis (although it still has some shortcomings).
Take the total number of likes on blog posts as an example (see Github for the original data: https://github.com/WillKoehrsen/Data-Analysis/tree/master/medium) and make a simple interactive histogram :
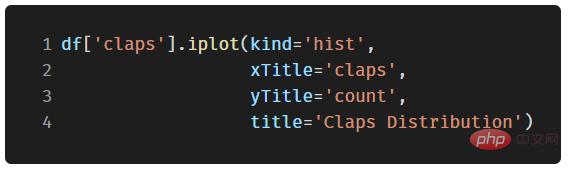
(df in the code is a standard Pandas dataframe object)
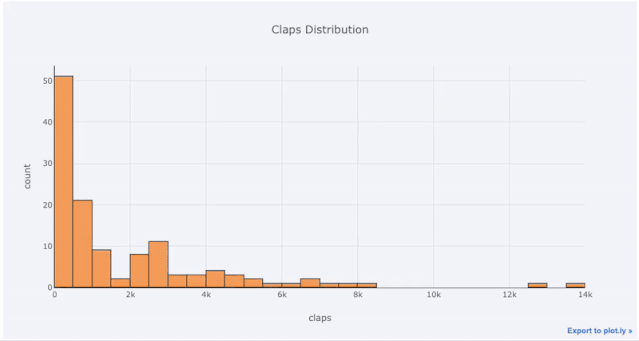
(Interaction created using plotly cufflinks Histogram)
For students who are already used to matplotlib, you only need to type one more letter (change .plot to .iplot) to get an interactive chart that looks more beautiful! Clicking on elements on the image reveals detailed information, zooms in and out, and (we’ll get to that next) highlights features like filtering certain parts of the image.
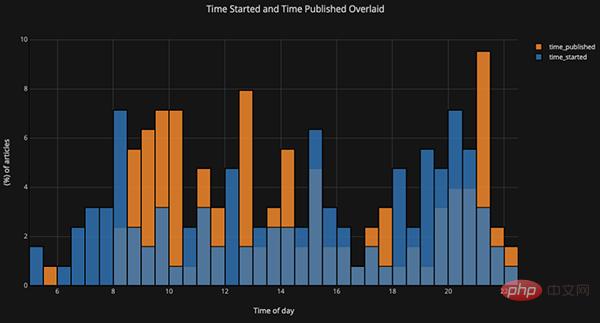
If you want to draw a stacked column chart, you only need to do this:
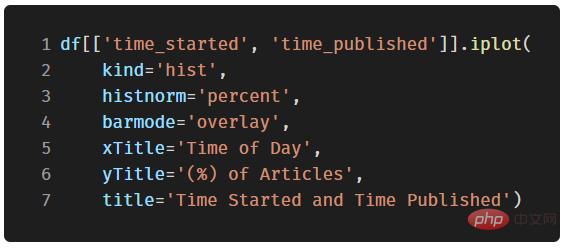
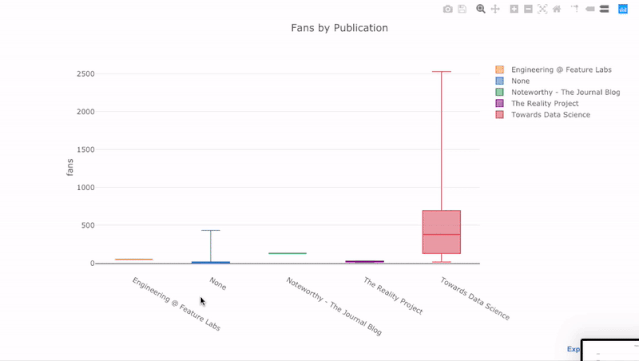
The benefit of interactive charts is that we can explore the data and split sub-items for analysis at will. Box plots can provide a lot of information, but if you can't see the specific values, you're likely to miss a lot of it!
Scatter plot
Scatter plot is the core content of most analysis. It allows us to see the change of one variable over time, or two (or more ) changes in the relationship between variables.
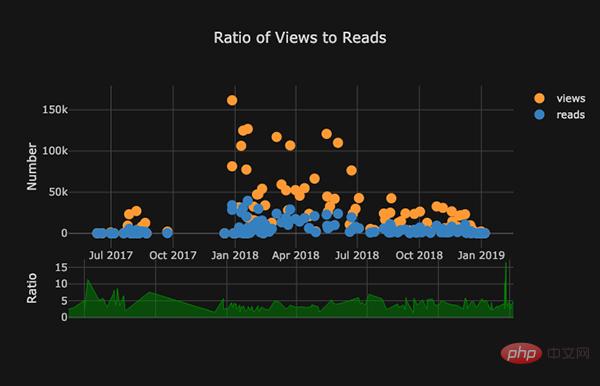
Time Series Analysis
In the real world, a considerable part of the data has time elements. Fortunately, plotly cufflinks comes with built-in functionality to support time series visual analysis.
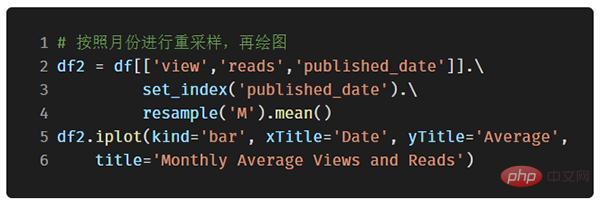
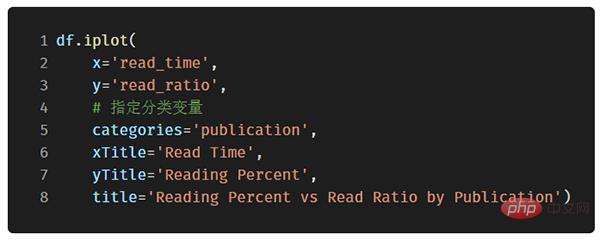
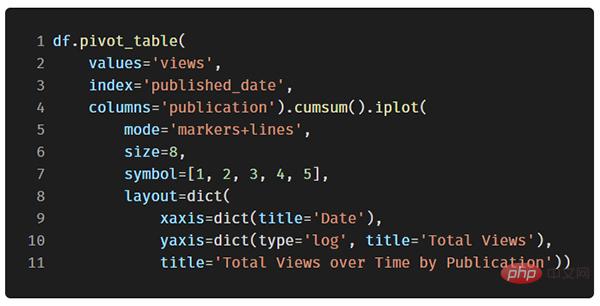
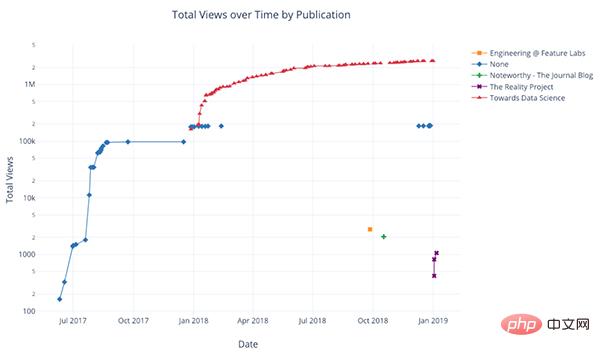
Taking the article data I published on the "Towards Data Science" website as an example, let us build a data set using the publication time as the index to see how the popularity of the article changes:

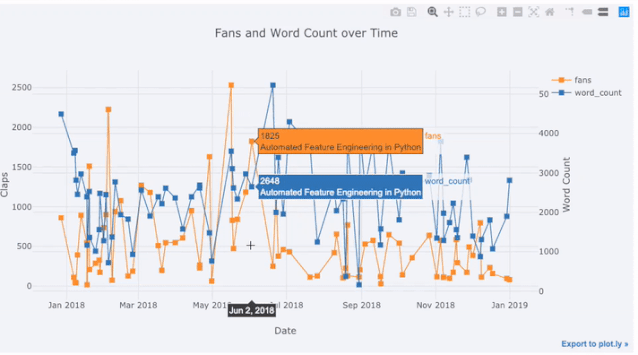
In the above picture, we have accomplished several things with one line of code:
- Automatically generate beautiful time series X-axis
- Add a second Y-axis because the ranges of the two variables are not consistent
- Put the article title in the label displayed when the mouse is hovered
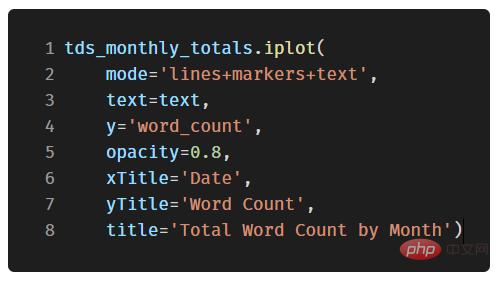
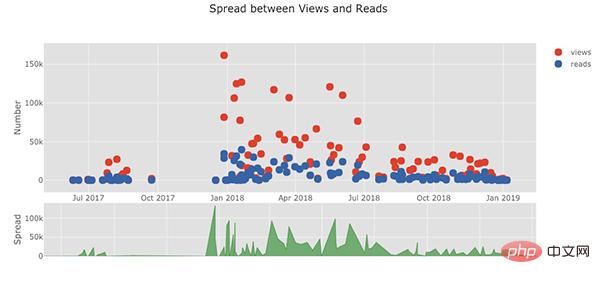
In order to display For more data, we can easily add text annotations:
(Scatter plot with text annotations)
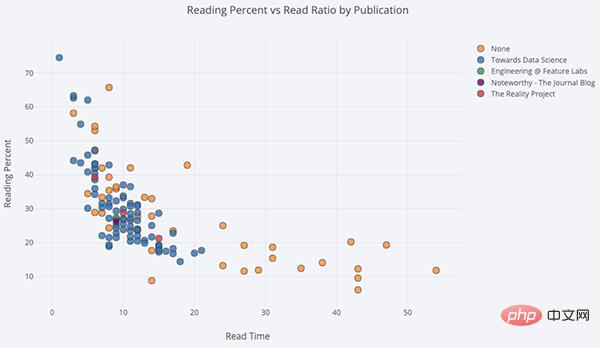
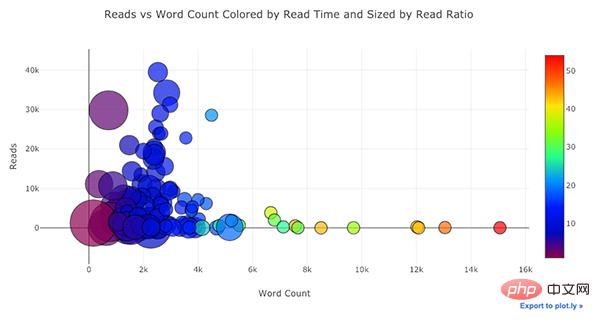
In the code below, we color a two-variable scatter plot by the third categorical variable:
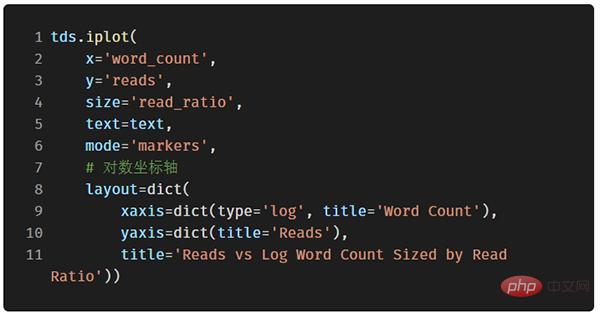
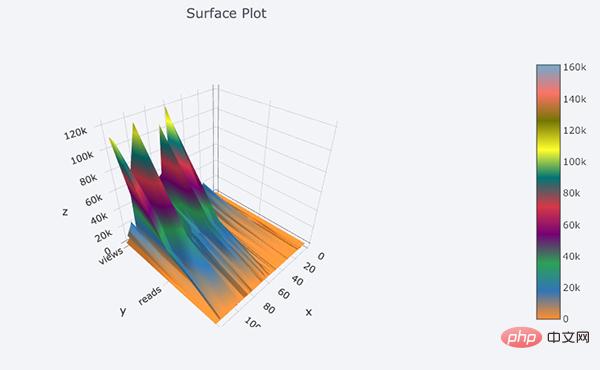
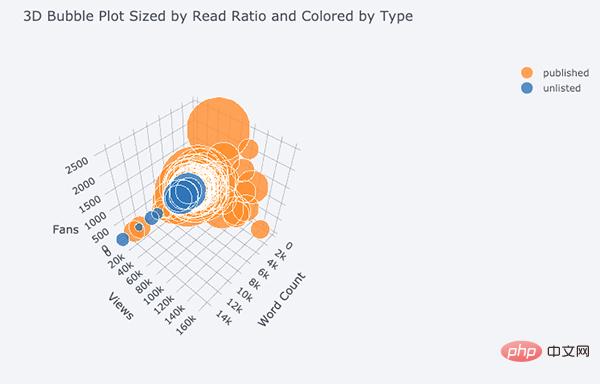
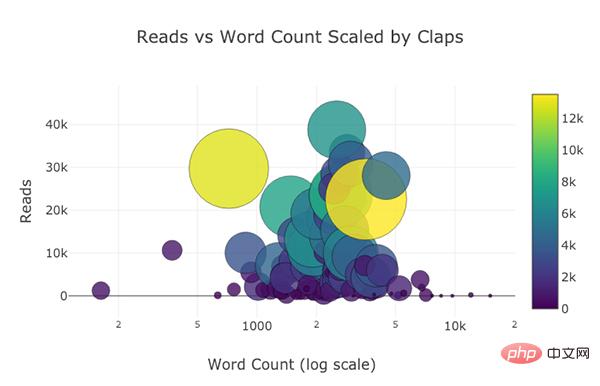
Next We're going to get a little more complicated: logarithmic axes. We achieve this by specifying the layout parameter of plotly (for different layouts, please refer to the official document https://plot.ly/python/reference/), and we combine the size of the point (size parameter) and a The numerical variable read_ratio (reading ratio) is bound. The larger the number, the larger the size of the bubble.
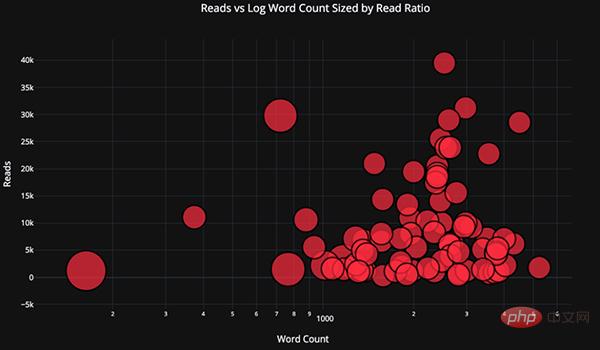
If we want to be more complicated (see Github source code for details), we can even stuff 4 into one picture A variable! (However, it is not recommended that you actually do this)
As before, we can combine pandas and plotly cufflinks to achieve many useful charts:
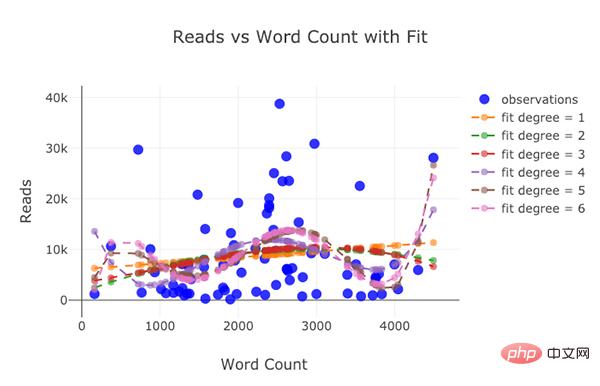
# It is recommended that you check the official documentation or source code, which contains more examples and function instances. With just one or two lines of code, you can add useful elements such as text annotations, auxiliary lines, and best-fit lines to your chart, while maintaining the original interactive functions.
Advanced drawing functions
Next, we will introduce several special charts in detail. You may not use them very often, but I guarantee that as long as you use them well, It will definitely impress people. We are going to use plotly’s figure_factory module, which can generate awesome charts with just one line of code!
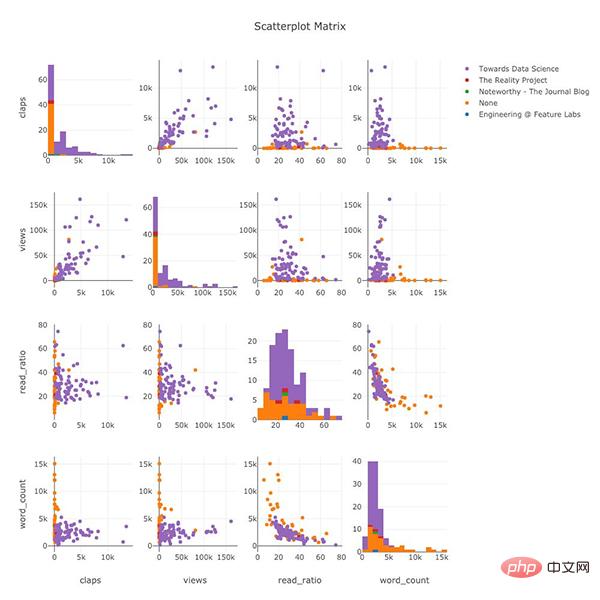
Scatter plot matrix
If we want to explore the relationship between many different variables, the scatter plot matrix (also known as SPLOM) is a great choice:
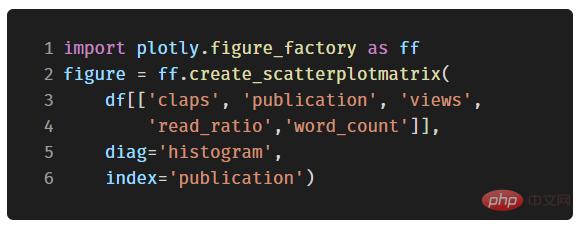
#Even such complex graphics are fully interactive, allowing us to explore the data in more detail.
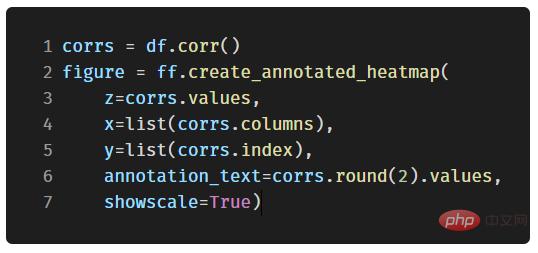
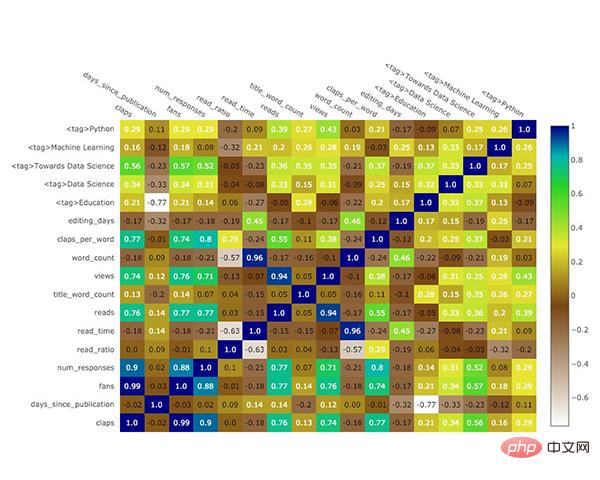
Relationship heat map
In order to reflect the relationship between multiple numerical variables, we can calculate their correlation and then visualize it in the form of a labeled heat map:
Customized Theme
In addition to the endless variety of charts, Cufflinks also provides many different coloring themes, allowing you to easily switch between different chart style. The following two pictures are the "space" theme and the "ggplot" theme respectively:

- Split /Interactive elements needed to study data
- Options to drill down into details when needed
- Easy to customize before final presentation
The above is the detailed content of Powerful open source Python drawing library. For more information, please follow other related articles on the PHP Chinese website!

Hot AI Tools

Undresser.AI Undress
AI-powered app for creating realistic nude photos

AI Clothes Remover
Online AI tool for removing clothes from photos.

Undress AI Tool
Undress images for free

Clothoff.io
AI clothes remover

AI Hentai Generator
Generate AI Hentai for free.

Hot Article
Hot Tools

Notepad++7.3.1
Easy-to-use and free code editor

SublimeText3 Chinese version
Chinese version, very easy to use

Zend Studio 13.0.1
Powerful PHP integrated development environment

Dreamweaver CS6
Visual web development tools

SublimeText3 Mac version
God-level code editing software (SublimeText3)
Hot Topics
 1377
1377
 52
52

 Do mysql need to pay
Apr 08, 2025 pm 05:36 PM
Do mysql need to pay
Apr 08, 2025 pm 05:36 PM
MySQL has a free community version and a paid enterprise version. The community version can be used and modified for free, but the support is limited and is suitable for applications with low stability requirements and strong technical capabilities. The Enterprise Edition provides comprehensive commercial support for applications that require a stable, reliable, high-performance database and willing to pay for support. Factors considered when choosing a version include application criticality, budgeting, and technical skills. There is no perfect option, only the most suitable option, and you need to choose carefully according to the specific situation.
 How to use mysql after installation
Apr 08, 2025 am 11:48 AM
How to use mysql after installation
Apr 08, 2025 am 11:48 AM
The article introduces the operation of MySQL database. First, you need to install a MySQL client, such as MySQLWorkbench or command line client. 1. Use the mysql-uroot-p command to connect to the server and log in with the root account password; 2. Use CREATEDATABASE to create a database, and USE select a database; 3. Use CREATETABLE to create a table, define fields and data types; 4. Use INSERTINTO to insert data, query data, update data by UPDATE, and delete data by DELETE. Only by mastering these steps, learning to deal with common problems and optimizing database performance can you use MySQL efficiently.
 MySQL can't be installed after downloading
Apr 08, 2025 am 11:24 AM
MySQL can't be installed after downloading
Apr 08, 2025 am 11:24 AM
The main reasons for MySQL installation failure are: 1. Permission issues, you need to run as an administrator or use the sudo command; 2. Dependencies are missing, and you need to install relevant development packages; 3. Port conflicts, you need to close the program that occupies port 3306 or modify the configuration file; 4. The installation package is corrupt, you need to download and verify the integrity; 5. The environment variable is incorrectly configured, and the environment variables must be correctly configured according to the operating system. Solve these problems and carefully check each step to successfully install MySQL.
 MySQL download file is damaged and cannot be installed. Repair solution
Apr 08, 2025 am 11:21 AM
MySQL download file is damaged and cannot be installed. Repair solution
Apr 08, 2025 am 11:21 AM
MySQL download file is corrupt, what should I do? Alas, if you download MySQL, you can encounter file corruption. It’s really not easy these days! This article will talk about how to solve this problem so that everyone can avoid detours. After reading it, you can not only repair the damaged MySQL installation package, but also have a deeper understanding of the download and installation process to avoid getting stuck in the future. Let’s first talk about why downloading files is damaged. There are many reasons for this. Network problems are the culprit. Interruption in the download process and instability in the network may lead to file corruption. There is also the problem with the download source itself. The server file itself is broken, and of course it is also broken when you download it. In addition, excessive "passionate" scanning of some antivirus software may also cause file corruption. Diagnostic problem: Determine if the file is really corrupt
 How to optimize MySQL performance for high-load applications?
Apr 08, 2025 pm 06:03 PM
How to optimize MySQL performance for high-load applications?
Apr 08, 2025 pm 06:03 PM
MySQL database performance optimization guide In resource-intensive applications, MySQL database plays a crucial role and is responsible for managing massive transactions. However, as the scale of application expands, database performance bottlenecks often become a constraint. This article will explore a series of effective MySQL performance optimization strategies to ensure that your application remains efficient and responsive under high loads. We will combine actual cases to explain in-depth key technologies such as indexing, query optimization, database design and caching. 1. Database architecture design and optimized database architecture is the cornerstone of MySQL performance optimization. Here are some core principles: Selecting the right data type and selecting the smallest data type that meets the needs can not only save storage space, but also improve data processing speed.
 Does mysql need the internet
Apr 08, 2025 pm 02:18 PM
Does mysql need the internet
Apr 08, 2025 pm 02:18 PM
MySQL can run without network connections for basic data storage and management. However, network connection is required for interaction with other systems, remote access, or using advanced features such as replication and clustering. Additionally, security measures (such as firewalls), performance optimization (choose the right network connection), and data backup are critical to connecting to the Internet.
 Solutions to the service that cannot be started after MySQL installation
Apr 08, 2025 am 11:18 AM
Solutions to the service that cannot be started after MySQL installation
Apr 08, 2025 am 11:18 AM
MySQL refused to start? Don’t panic, let’s check it out! Many friends found that the service could not be started after installing MySQL, and they were so anxious! Don’t worry, this article will take you to deal with it calmly and find out the mastermind behind it! After reading it, you can not only solve this problem, but also improve your understanding of MySQL services and your ideas for troubleshooting problems, and become a more powerful database administrator! The MySQL service failed to start, and there are many reasons, ranging from simple configuration errors to complex system problems. Let’s start with the most common aspects. Basic knowledge: A brief description of the service startup process MySQL service startup. Simply put, the operating system loads MySQL-related files and then starts the MySQL daemon. This involves configuration
 How to optimize database performance after mysql installation
Apr 08, 2025 am 11:36 AM
How to optimize database performance after mysql installation
Apr 08, 2025 am 11:36 AM
MySQL performance optimization needs to start from three aspects: installation configuration, indexing and query optimization, monitoring and tuning. 1. After installation, you need to adjust the my.cnf file according to the server configuration, such as the innodb_buffer_pool_size parameter, and close query_cache_size; 2. Create a suitable index to avoid excessive indexes, and optimize query statements, such as using the EXPLAIN command to analyze the execution plan; 3. Use MySQL's own monitoring tool (SHOWPROCESSLIST, SHOWSTATUS) to monitor the database health, and regularly back up and organize the database. Only by continuously optimizing these steps can the performance of MySQL database be improved.
