

How to customize monitoring indicators in Spring Boot

1. Create a project
pom.xml and introduce related dependencies
<project xmlns="http://maven.apache.org/POM/4.0.0" xmlns:xsi="http://www.w3.org/2001/XMLSchema-instance" xsi:schemaLocation="http://maven.apache.org/POM/4.0.0 https://maven.apache.org/xsd/maven-4.0.0.xsd">
	<modelVersion>4.0.0</modelVersion>
	<groupId>com.olive</groupId>
	<artifactId>prometheus-meter-demo</artifactId>
	<version>0.0.1-SNAPSHOT</version>
	<parent>
		<groupId>org.springframework.boot</groupId>
		<artifactId>spring-boot-starter-parent</artifactId>
		<version>2.3.7.RELEASE</version>
		<relativePath />
	</parent>
	<properties>
		<java.version>1.8</java.version>
		<project.build.sourceEncoding>UTF-8</project.build.sourceEncoding>
		<project.reporting.outputEncoding>UTF-8</project.reporting.outputEncoding>
		<spring-boot.version>2.3.7.RELEASE</spring-boot.version>
	</properties>
	<dependencies>
		<dependency>
			<groupId>org.springframework.boot</groupId>
			<artifactId>spring-boot-starter-aop</artifactId>
		</dependency>
		<dependency>
			<groupId>org.springframework.boot</groupId>
			<artifactId>spring-boot-starter-web</artifactId>
		</dependency>
		<dependency>
			<groupId>org.springframework.boot</groupId>
			<artifactId>spring-boot-starter-actuator</artifactId>
		</dependency>
		<!-- Micrometer Prometheus registry  -->
		<dependency>
			<groupId>io.micrometer</groupId>
			<artifactId>micrometer-registry-prometheus</artifactId>
		</dependency>
	</dependencies>
	<dependencyManagement>
		<dependencies>
			<dependency>
				<groupId>org.springframework.boot</groupId>
				<artifactId>spring-boot-dependencies</artifactId>
				<version>${spring-boot.version}</version>
				<type>pom</type>
				<scope>import</scope>
			</dependency>
		</dependencies>
	</dependencyManagement>
</project>2.Customize indicators
method One
Directly use the class of micrometercore package to define and register indicators
package com.olive.monitor;

import javax.annotation.PostConstruct;

import org.springframework.beans.factory.annotation.Autowired;
import org.springframework.stereotype.Component;

import io.micrometer.core.instrument.Counter;
import io.micrometer.core.instrument.DistributionSummary;
import io.micrometer.core.instrument.MeterRegistry;

@Component
public class NativeMetricsMontior {

	/**
	 * 支付次数
	 */
	private Counter payCount;

	/**
	 * 支付金额统计
	 */
	private DistributionSummary payAmountSum;

	@Autowired
	private MeterRegistry registry;

	@PostConstruct
	private void init() {
		payCount = registry.counter("pay_request_count", "payCount", "pay-count");
		payAmountSum = registry.summary("pay_amount_sum", "payAmountSum", "pay-amount-sum");
	}

	public Counter getPayCount() {
		return payCount;
	}

	public DistributionSummary getPayAmountSum() {
		return payAmountSum;
	}

}Method two
By introducingmicrometer-registry-prometheus Package, this package combines prometheus to encapsulate micrometer
<dependency>
			<groupId>io.micrometer</groupId>
			<artifactId>micrometer-registry-prometheus</artifactId>
		</dependency>
Also defines two metrics
package com.olive.monitor;

import javax.annotation.PostConstruct;

import org.springframework.beans.factory.annotation.Autowired;
import org.springframework.stereotype.Component;

import io.prometheus.client.CollectorRegistry;
import io.prometheus.client.Counter;

@Component
public class PrometheusMetricsMonitor {

	/**
	 * 订单发起次数
	 */
	private Counter orderCount;

	/**
	 * 金额统计
	 */
	private Counter orderAmountSum;

	@Autowired
	private CollectorRegistry registry;
	@PostConstruct
	private void init() {
		orderCount = Counter.build().name("order_request_count")
				.help("order request count.")
				.labelNames("orderCount")
				.register();
		orderAmountSum = Counter.build().name("order_amount_sum")
				.help("order amount sum.")
				.labelNames("orderAmountSum")
				.register();
		registry.register(orderCount);
		registry.register(orderAmountSum);
	}

	public Counter getOrderCount() {
		return orderCount;
	}

	public Counter getOrderAmountSum() {
		return orderAmountSum;
	}

}prometheus 4 commonly used Metrics
Counter
Counters that continuously increase but do not decrease can be used to record types that only increase but do not decrease, such as: the number of website visitors, system running time, etc.
For Counter type indicators, there is only one inc() method, which is used for counter 1.
Generally speaking, we use _total for Counter type metric indicators. End, such as http_requests_total.
Gauge
A dashboard that can be increased or decreased, and a curve graph
For this type of indicator that can be increased or decreased, it is used to reflect the current status of the application state.
For example, when monitoring the host, the host's current free memory size, available memory size, etc.
The Gauge indicator object contains two main methods inc() and dec(), which are used to increase and decrease the count.
Histogram
is mainly used to count the distribution of data. This is a special metrics data type, which represents an approximate percentage estimate value. It counts all discrete indicator data in The number of times in each value range. For example: We want to count the data distribution of http request responses less than 0.005 seconds, less than 0.01 seconds, and less than 0.025 seconds within a period of time. Then use Histogram to collect the time of each http request and set the bucket at the same time.
Summary
Summary and Histogram are very similar. They can both count the number or size of events and their distribution. They both provide a count of time and a summary of values. , also provide functions that can calculate statistical sample distribution. The difference is that Histogram can calculate quantiles on the server through the histogram_quantile function. Sumamry's quantile is defined directly on the client. Therefore, for the calculation of quantiles, Summary has better performance when querying through PromQL, while Histogram consumes more resources, but Histogram consumes fewer resources compared to the client. You can use any one, and you can adjust it freely according to the actual scene.
3. Test
Define two controllers and use NativeMetricsMontior and PrometheusMetricsMonitor
package com.olive.controller;

import java.util.Random;

import javax.annotation.Resource;

import org.springframework.web.bind.annotation.RequestMapping;
import org.springframework.web.bind.annotation.RequestParam;
import org.springframework.web.bind.annotation.RestController;

import com.olive.monitor.NativeMetricsMontior;

@RestController
public class PayController {

	@Resource
	private NativeMetricsMontior monitor;

	@RequestMapping("/pay")
	public String pay(@RequestParam("amount") Double amount) throws Exception {
		// 统计支付次数
		monitor.getPayCount().increment();

		Random random = new Random();
		//int amount = random.nextInt(100);
		if(amount==null) {
			amount = 0.0;
		}
		// 统计支付总金额
		monitor.getPayAmountSum().record(amount);
		return "支付成功, 支付金额: " + amount;
	}

}
package com.olive.controller;

import java.util.Random;

import javax.annotation.Resource;

import org.springframework.web.bind.annotation.RequestMapping;
import org.springframework.web.bind.annotation.RequestParam;
import org.springframework.web.bind.annotation.RestController;

import com.olive.monitor.PrometheusMetricsMonitor;

@RestController
public class OrderController {

	@Resource
	private PrometheusMetricsMonitor monitor;

	@RequestMapping("/order")
	public String order(@RequestParam("amount") Double amount) throws Exception {
		// 订单总数
		monitor.getOrderCount()
			.labels("orderCount")
			.inc();

		Random random = new Random();
		//int amount = random.nextInt(100);
		if(amount==null) {
			amount = 0.0;
		}
		// 统计订单总金额
		monitor.getOrderAmountSum()
			.labels("orderAmountSum")
			.inc(amount);
		return "下单成功, 订单金额: " + amount;
	}

}to start the service
Accesshttp://127.0.0.1:9595/actuator/prometheus; Normally see the monitoring data

Change the amount multiple times After http://127.0.0.1:8080/order?amount=100 and http://127.0.0.1:8080/pay?amount=10; then visit http:/ /127.0.0.1:9595/actuator/prometheus. Check the monitoring data

4. Application in the project
It is not practical to monitor the data buried points in the way mentioned above; in the spring project Basically, buried point monitoring is carried out through AOP. For example, write an aspectAspect; this method is very friendly. Data buried point monitoring can be done at the entrance without the need to write code in the controller.
package com.olive.aspect;

import java.time.LocalDate;
import java.util.concurrent.TimeUnit;

import javax.servlet.http.HttpServletRequest;

import org.aspectj.lang.ProceedingJoinPoint;
import org.aspectj.lang.annotation.Around;
import org.aspectj.lang.annotation.Aspect;
import org.aspectj.lang.annotation.Pointcut;
import org.springframework.stereotype.Component;
import org.springframework.util.StringUtils;
import org.springframework.web.context.request.RequestContextHolder;
import org.springframework.web.context.request.ServletRequestAttributes;

import io.micrometer.core.instrument.Metrics;

@Aspect
@Component
public class PrometheusMetricsAspect {

    // 切入所有controller包下的请求方法
    @Pointcut("execution(* com.olive.controller..*.*(..))")
    public void controllerPointcut() {
    }

    @Around("controllerPointcut()")
    public Object MetricsCollector(ProceedingJoinPoint joinPoint) throws Throwable {

        HttpServletRequest request = ((ServletRequestAttributes) RequestContextHolder.getRequestAttributes()).getRequest();
        String userId = StringUtils.hasText(request.getParameter("userId")) ?
        		request.getParameter("userId") : "no userId";

        // 获取api url
        String api = request.getServletPath();
        // 获取请求方法
        String method = request.getMethod();
        long startTs = System.currentTimeMillis();
        LocalDate now = LocalDate.now();
        String[] tags = new String[10];
        tags[0] = "api";
        tags[1] = api;
        tags[2] = "method";
        tags[3] = method;
        tags[4] = "day";
        tags[5] = now.toString();
        tags[6] = "userId";
        tags[7] = userId;

        String amount = StringUtils.hasText(request.getParameter("amount")) ?
        		request.getParameter("amount") : "0.0";

        tags[8] = "amount";
        tags[9] = amount;
        // 请求次数加1
        //自定义的指标名称:custom_http_request_all,指标包含数据
        Metrics.counter("custom_http_request_all", tags).increment();
        Object object = null;
        try {
            object = joinPoint.proceed();
        } catch (Exception e) {
            //请求失败次数加1
            Metrics.counter("custom_http_request_error", tags).increment();
            throw e;
        } finally {
            long endTs = System.currentTimeMillis() - startTs;
            //记录请求响应时间
           Metrics.timer("custom_http_request_time", tags).record(endTs, TimeUnit.MILLISECONDS);
        }
        return object;
    }
}After writing the aspect, restart the service; access the controller interface, and you can also bury custom monitoring indicators

The above is the detailed content of How to customize monitoring indicators in Spring Boot. For more information, please follow other related articles on the PHP Chinese website!

Hot AI Tools

Undresser.AI Undress
AI-powered app for creating realistic nude photos

AI Clothes Remover
Online AI tool for removing clothes from photos.

Undress AI Tool
Undress images for free

Clothoff.io
AI clothes remover

Video Face Swap
Swap faces in any video effortlessly with our completely free AI face swap tool!

Hot Article
Hot Tools

Notepad++7.3.1
Easy-to-use and free code editor

SublimeText3 Chinese version
Chinese version, very easy to use

Zend Studio 13.0.1
Powerful PHP integrated development environment

Dreamweaver CS6
Visual web development tools

SublimeText3 Mac version
God-level code editing software (SublimeText3)
Hot Topics
 1386
1386
 52
52

 How Springboot integrates Jasypt to implement configuration file encryption
Jun 01, 2023 am 08:55 AM
How Springboot integrates Jasypt to implement configuration file encryption
Jun 01, 2023 am 08:55 AM
Introduction to Jasypt Jasypt is a java library that allows a developer to add basic encryption functionality to his/her project with minimal effort and does not require a deep understanding of how encryption works. High security for one-way and two-way encryption. , standards-based encryption technology. Encrypt passwords, text, numbers, binaries... Suitable for integration into Spring-based applications, open API, for use with any JCE provider... Add the following dependency: com.github.ulisesbocchiojasypt-spring-boot-starter2. 1.1Jasypt benefits protect our system security. Even if the code is leaked, the data source can be guaranteed.
 How SpringBoot integrates Redisson to implement delay queue
May 30, 2023 pm 02:40 PM
How SpringBoot integrates Redisson to implement delay queue
May 30, 2023 pm 02:40 PM
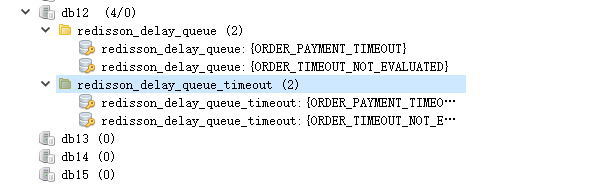
Usage scenario 1. The order was placed successfully but the payment was not made within 30 minutes. The payment timed out and the order was automatically canceled. 2. The order was signed and no evaluation was conducted for 7 days after signing. If the order times out and is not evaluated, the system defaults to a positive rating. 3. The order is placed successfully. If the merchant does not receive the order for 5 minutes, the order is cancelled. 4. The delivery times out, and push SMS reminder... For scenarios with long delays and low real-time performance, we can Use task scheduling to perform regular polling processing. For example: xxl-job Today we will pick
 How to use Redis to implement distributed locks in SpringBoot
Jun 03, 2023 am 08:16 AM
How to use Redis to implement distributed locks in SpringBoot
Jun 03, 2023 am 08:16 AM
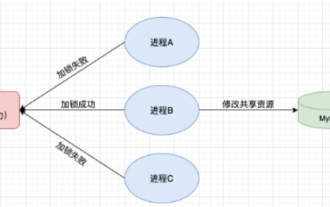
1. Redis implements distributed lock principle and why distributed locks are needed. Before talking about distributed locks, it is necessary to explain why distributed locks are needed. The opposite of distributed locks is stand-alone locks. When we write multi-threaded programs, we avoid data problems caused by operating a shared variable at the same time. We usually use a lock to mutually exclude the shared variables to ensure the correctness of the shared variables. Its scope of use is in the same process. If there are multiple processes that need to operate a shared resource at the same time, how can they be mutually exclusive? Today's business applications are usually microservice architecture, which also means that one application will deploy multiple processes. If multiple processes need to modify the same row of records in MySQL, in order to avoid dirty data caused by out-of-order operations, distribution needs to be introduced at this time. The style is locked. Want to achieve points
 How to solve the problem that springboot cannot access the file after reading it into a jar package
Jun 03, 2023 pm 04:38 PM
How to solve the problem that springboot cannot access the file after reading it into a jar package
Jun 03, 2023 pm 04:38 PM
Springboot reads the file, but cannot access the latest development after packaging it into a jar package. There is a situation where springboot cannot read the file after packaging it into a jar package. The reason is that after packaging, the virtual path of the file is invalid and can only be accessed through the stream. Read. The file is under resources publicvoidtest(){Listnames=newArrayList();InputStreamReaderread=null;try{ClassPathResourceresource=newClassPathResource("name.txt");Input
 Comparison and difference analysis between SpringBoot and SpringMVC
Dec 29, 2023 am 11:02 AM
Comparison and difference analysis between SpringBoot and SpringMVC
Dec 29, 2023 am 11:02 AM
SpringBoot and SpringMVC are both commonly used frameworks in Java development, but there are some obvious differences between them. This article will explore the features and uses of these two frameworks and compare their differences. First, let's learn about SpringBoot. SpringBoot was developed by the Pivotal team to simplify the creation and deployment of applications based on the Spring framework. It provides a fast, lightweight way to build stand-alone, executable
 How to implement Springboot+Mybatis-plus without using SQL statements to add multiple tables
Jun 02, 2023 am 11:07 AM
How to implement Springboot+Mybatis-plus without using SQL statements to add multiple tables
Jun 02, 2023 am 11:07 AM
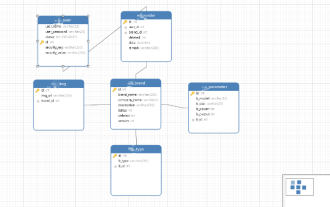
When Springboot+Mybatis-plus does not use SQL statements to perform multi-table adding operations, the problems I encountered are decomposed by simulating thinking in the test environment: Create a BrandDTO object with parameters to simulate passing parameters to the background. We all know that it is extremely difficult to perform multi-table operations in Mybatis-plus. If you do not use tools such as Mybatis-plus-join, you can only configure the corresponding Mapper.xml file and configure The smelly and long ResultMap, and then write the corresponding sql statement. Although this method seems cumbersome, it is highly flexible and allows us to
 How SpringBoot customizes Redis to implement cache serialization
Jun 03, 2023 am 11:32 AM
How SpringBoot customizes Redis to implement cache serialization
Jun 03, 2023 am 11:32 AM
1. Customize RedisTemplate1.1, RedisAPI default serialization mechanism. The API-based Redis cache implementation uses the RedisTemplate template for data caching operations. Here, open the RedisTemplate class and view the source code information of the class. publicclassRedisTemplateextendsRedisAccessorimplementsRedisOperations, BeanClassLoaderAware{//Declare key, Various serialization methods of value, the initial value is empty @NullableprivateRedisSe
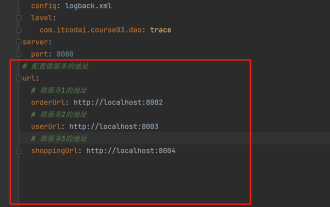 How to get the value in application.yml in springboot
Jun 03, 2023 pm 06:43 PM
How to get the value in application.yml in springboot
Jun 03, 2023 pm 06:43 PM
In projects, some configuration information is often needed. This information may have different configurations in the test environment and the production environment, and may need to be modified later based on actual business conditions. We cannot hard-code these configurations in the code. It is best to write them in the configuration file. For example, you can write this information in the application.yml file. So, how to get or use this address in the code? There are 2 methods. Method 1: We can get the value corresponding to the key in the configuration file (application.yml) through the ${key} annotated with @Value. This method is suitable for situations where there are relatively few microservices. Method 2: In actual projects, When business is complicated, logic
