How to use Pyecharts for Python data visualization
1. Install Pyecharts
pip install pyecharts
2. Chart basics
2.1 Theme style
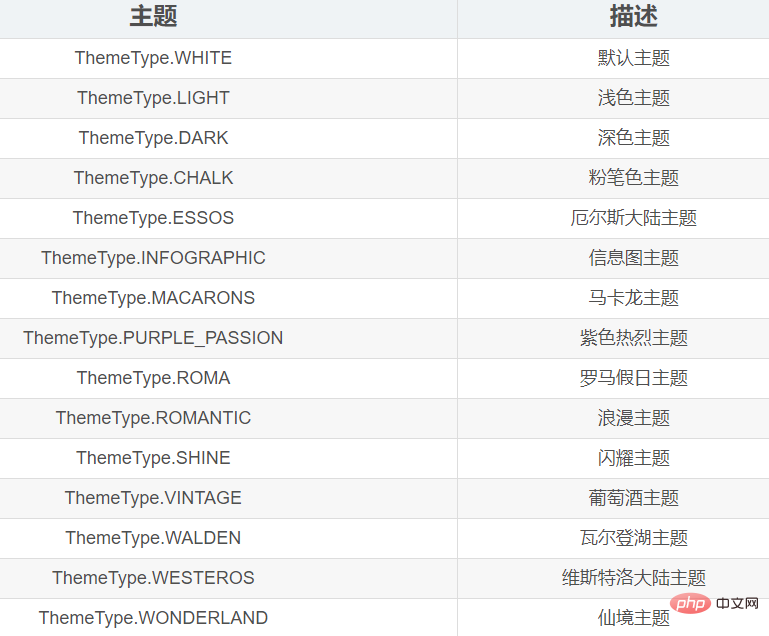
Add theme style to use It is the InitOpts() method.
The main parameters of this method are:
| Parameters | Description |
|---|---|
| width | Canvas width, requires string format, such as width="500px" |
| height | Canvas height, requires string Format, such as width="500px" |
| chart_id | Chart ID, as the unique identifier of the chart. Used to distinguish different charts when there are multiple charts |
| page_title | Web page title, string format |
| theme | Chart theme. Provided by ThemeType module |
| bg_color | Chart background color, string format |
The styles that can be selected are :
2.2 Chart title
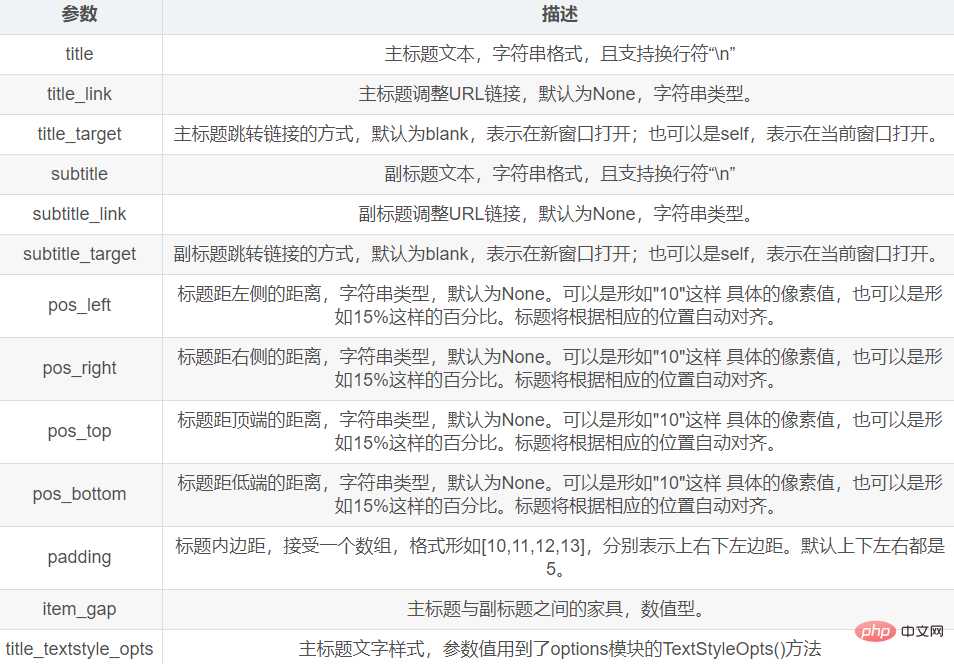
To add a title to the chart, you need to pass the title_opts parameter of the set_global_options() method.
The value of this parameter is passed The TitleOpts() method of the opts module is generated,
and the main parameter syntax of the TitleOpts() method is as follows:
2.3 Legend
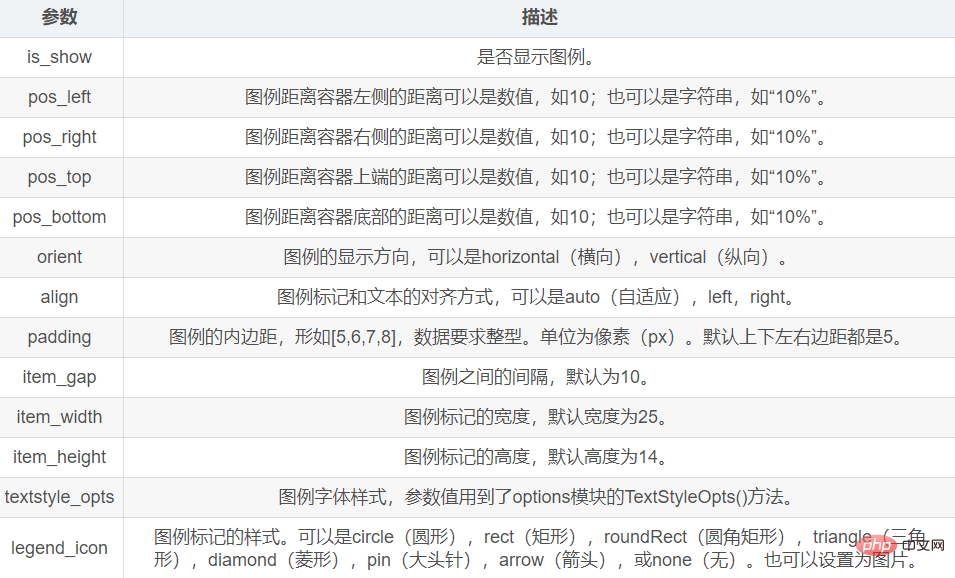
Set the legend You need to pass the legend_opts parameter of the set_global_opts() method.
The parameter value of this parameter refers to the LegendOpts() method of the options module.
The main parameters of the LegendOpts() method are as follows:
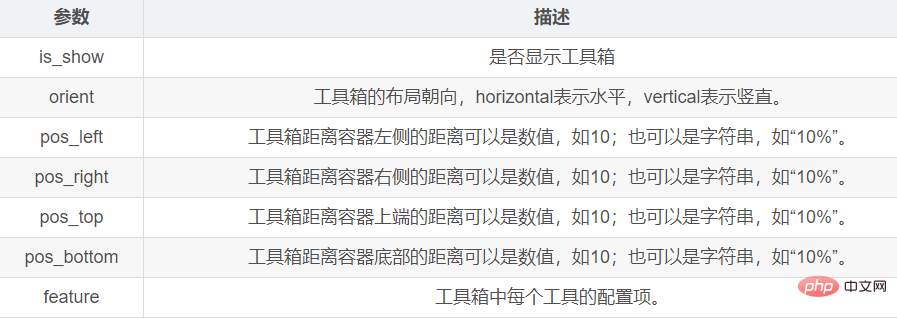
2.4 Prompt box
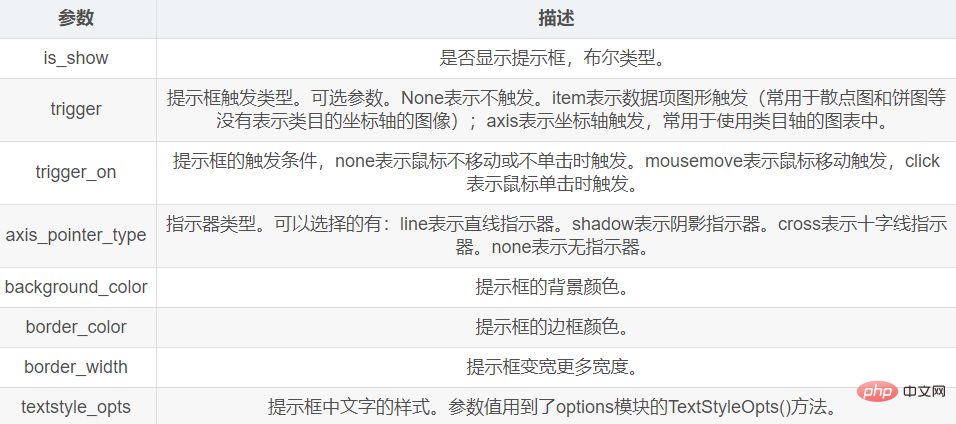
Setting the prompt box is mainly through the set_global_opts() method The tooltip_opts parameter is set.
The parameter value of this parameter refers to the TooltipOpts() method of the options module.
The main parameters of the TooltipOpts() method are as follows:
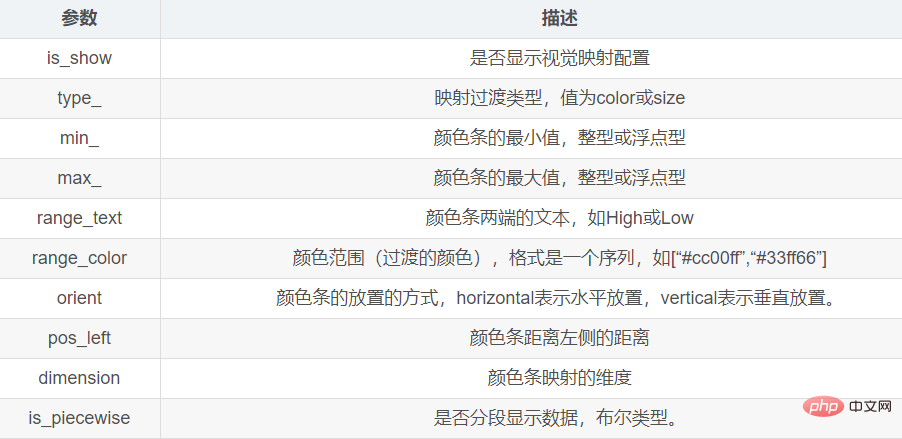
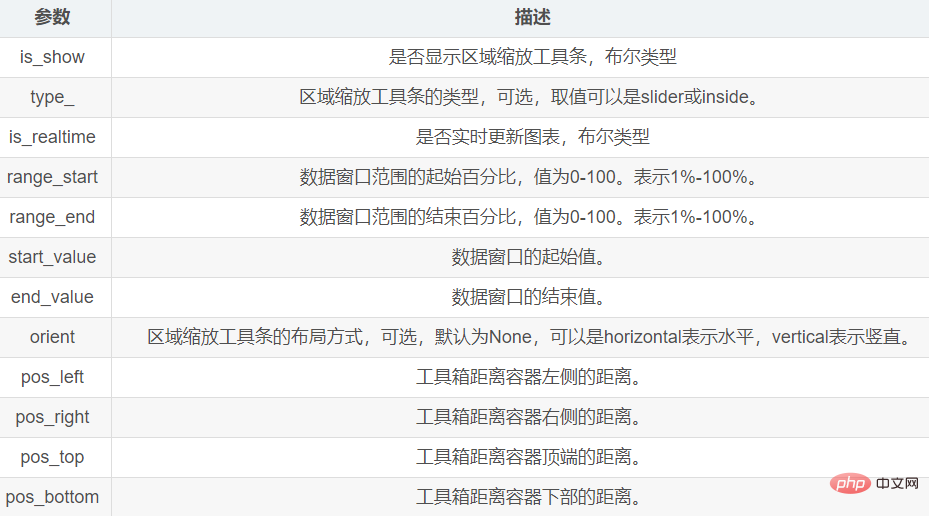
2.5 Visual mapping
Visual mapping passes the visualmap_opts parameter in the set_global_opts() method Make settings.
For the value of this parameter, refer to the VisualMapOpts() method of the options module.
The main parameters are as follows:
 ##3. Histogram Bar module
The histogram is drawn through the Bar module,
The main methods of this module are:
| ##add_xaxis() | |||||||||||||
|---|---|---|---|---|---|---|---|---|---|---|---|---|---|
| add_yaxis() | |||||||||||||
| reversal_axis() | |||||||||||||
| add_dataset() | |||||||||||||
下边展示一个简单的示例,先不使用过多复杂的样式: import numpy as np
from pyecharts.charts import Bar
from pyecharts import options as opts
from pyecharts.globals import ThemeType
# 生成数据
years = [2011, 2012, 2013, 2014, 2015]
y1 = [1, 3, 5, 7, 9]
y2 = [2, 4, 6, 4, 2]
y3 = [9, 7, 5, 3, 1]
y4 = list(np.random.randint(1, 10, 10))
bar = Bar(init_opts=opts.InitOpts(theme=ThemeType.LIGHT))
# 为柱状图添加x轴和y轴数据
bar.add_xaxis(years)
bar.add_yaxis('A型', y1)
bar.add_yaxis('B型', y2)
bar.add_yaxis('C型', y3)
bar.add_yaxis('D型', y4)
# 渲染图表到HTML文件,并保存在当前目录下
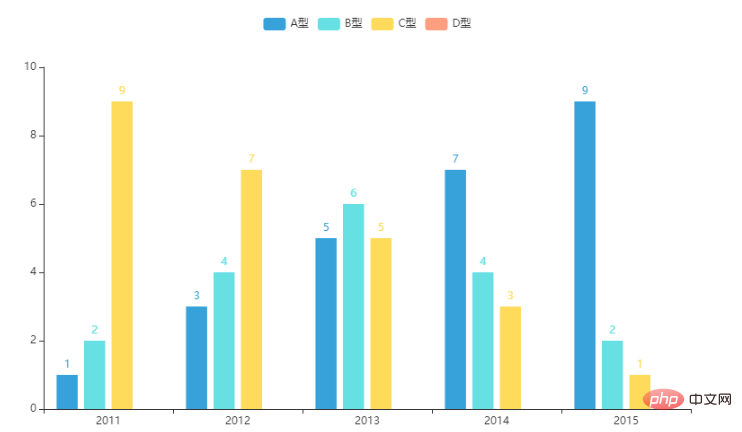
bar.render("bar.html")Copy after login 生成图像效果如下:
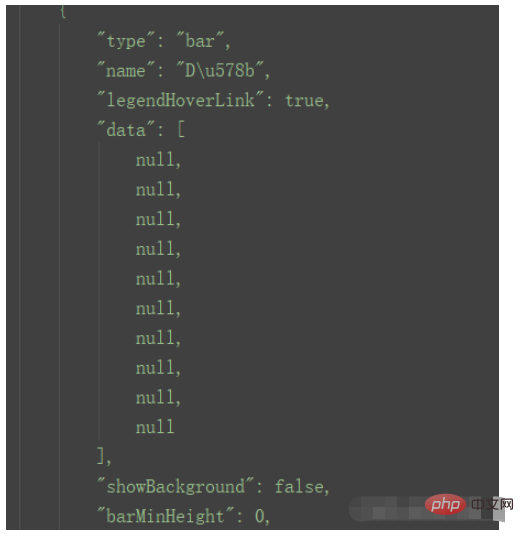
这里有一个无法解释的细节,就是可以看到y4数据,即D型,在图像中没有显示出来。经过小啾的反复尝试,发现凡是使用随机数产生的数据再转化成列表,这部分随机数不会被写入到html文件中:
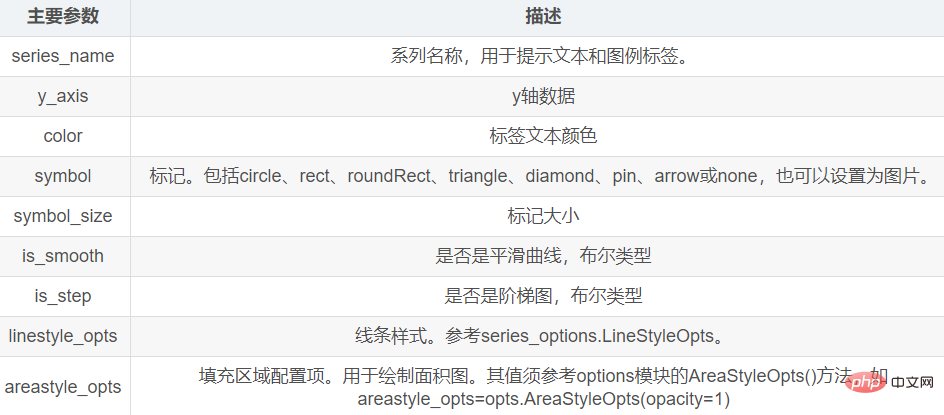
既然不会解释,那就避免。 4. 折线图/面积图 Line模块Line模块的主要方法有add_xaxis() 和 add_yaxis(),分别用来添加x轴数据和y轴数据。 add_yaxis()的主要参数如下:
4.1 折线图绘制折线图时,x轴的数据必须是字符串,图线方可正常显示。 from pyecharts.charts import Line
from pyecharts import options as opts
from pyecharts.globals import ThemeType
# 准备数据
x = [2011, 2012, 2013, 2014, 2015]
x_data = [str(i) for i in x]
y1 = [1, 3, 2, 5, 8]
y2 = [2, 6, 5, 6, 7]
y3 = [5, 7, 4, 3, 1]
line = Line(init_opts=opts.InitOpts(theme=ThemeType.ESSOS))
line.add_xaxis(xaxis_data=x_data)
line.add_yaxis(series_name="A类", y_axis=y1)
line.add_yaxis(series_name="B类", y_axis=y2)
line.add_yaxis(series_name="C类", y_axis=y3)
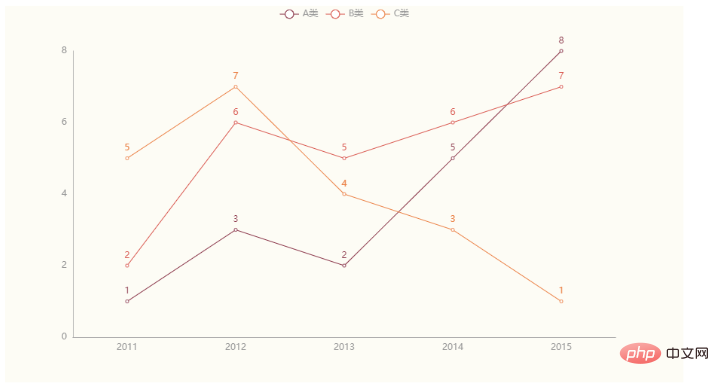
line.render("line.html")Copy after login 生成图像效果如下:
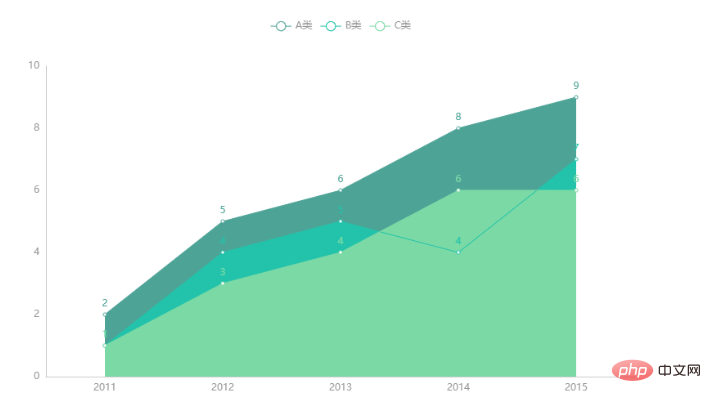
4.2 面积图绘制面积图时需要在add_yaxis()方法中指定areastyle_opts参数。其值由options模块的AreaStyleOpts()方法提供。 from pyecharts.charts import Line
from pyecharts import options as opts
from pyecharts.globals import ThemeType
x = [2011, 2012, 2013, 2014, 2015]
x_data = [str(i) for i in x]
y1 = [2, 5, 6, 8, 9]
y2 = [1, 4, 5, 4, 7]
y3 = [1, 3, 4, 6, 6]
line = Line(init_opts=opts.InitOpts(theme=ThemeType.WONDERLAND))
line.add_xaxis(xaxis_data=x_data)
line.add_yaxis(series_name="A类", y_axis=y1, areastyle_opts=opts.AreaStyleOpts(opacity=1))
line.add_yaxis(series_name="B类", y_axis=y2, areastyle_opts=opts.AreaStyleOpts(opacity=1))
line.add_yaxis(series_name="C类", y_axis=y3, areastyle_opts=opts.AreaStyleOpts(opacity=1))
line.render("line2.html")Copy after login 图像效果如下:
5.饼形图5.1 饼形图绘制饼形图使用的是Pie模块,该模块中需要使用的主要方法是add()方法 该方法主要参数如下:
from pyecharts.charts import Pie
from pyecharts import options as opts
from pyecharts.globals import ThemeType

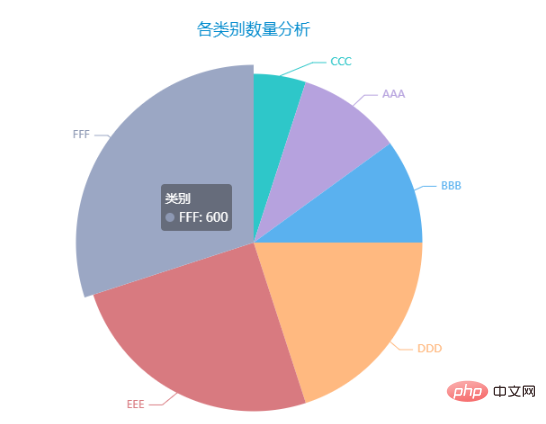
x_data = ['AAA', 'BBB', 'CCC', 'DDD', 'EEE', 'FFF']
y_data = [200, 200, 100, 400, 500, 600]
# 将数据转换为目标格式
data = [list(z) for z in zip(x_data, y_data)]
# 数据排序
data.sort(key=lambda x: x[1])

pie = Pie(init_opts=opts.InitOpts(theme=ThemeType.MACARONS))

pie.add(
        series_name="类别",    # 序列名称
        data_pair=data,     # 数据
    )
pie.set_global_opts(
        # 饼形图标题
        title_opts=opts.TitleOpts(
            title="各类别数量分析",
            pos_left="center"),
        # 不显示图例
        legend_opts=opts.LegendOpts(is_show=False),
    )
pie.set_series_opts(
        # 序列标签
        label_opts=opts.LabelOpts(),
    )

pie.render("pie.html")
Copy after login 图像效果如下:
5.2 南丁格尔玫瑰图from pyecharts.charts import Pie
from pyecharts import options as opts
from pyecharts.globals import ThemeType
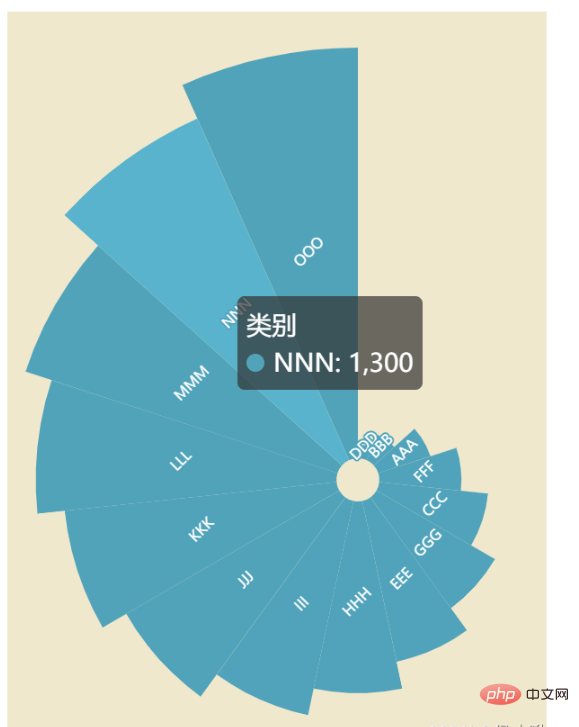
x_data = ['AAA', 'BBB', 'CCC', 'DDD', 'EEE', 'FFF', 'GGG', 'HHH', 'III', 'JJJ', 'KKK', 'LLL', 'MMM', 'NNN', 'OOO']
y_data = [200, 100, 400, 50, 600, 300, 500, 700, 800, 900, 1000, 1100, 1200, 1300, 1500]
# 将数据转换为目标格式
data = [list(z) for z in zip(x_data, y_data)]
# 数据排序
data.sort(key=lambda x: x[1])
# 创建饼形图并设置画布大小
pie = Pie(init_opts=opts.InitOpts(theme=ThemeType.ROMANTIC, width='300px', height='400px'))
# 为饼形图添加数据
pie.add(
series_name="类别",
data_pair=data,
radius=["8%", "160%"], # 内外半径
center=["65%", "65%"], # 位置
rosetype='area', # 玫瑰图,圆心角相同,按半径大小绘制
color='auto' # 颜色自动渐变
)
pie.set_global_opts(
# 不显示图例
legend_opts=opts.LegendOpts(is_show=False),
# 视觉映射
visualmap_opts=opts.VisualMapOpts(is_show=False,
min_=100, # 颜色条最小值
max_=450000, # 颜色条最大值
)
)
pie.set_series_opts(
# 序列标签
label_opts=opts.LabelOpts(position='inside', # 标签位置
rotate=45,
font_size=8) # 字体大小
)
pie.render("pie2.html")Copy after login 图像效果如下:
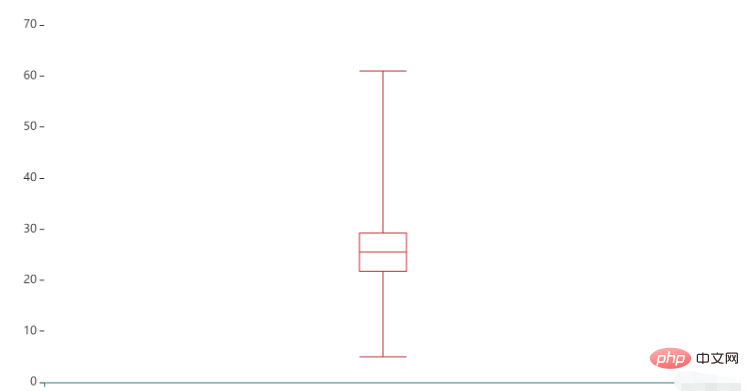
6. 箱线图 Boxplot模块绘制箱线图使用的是Boxplot类。 这里有一个细节,准备y轴数据y_data时需要在列表外再套一层列表,否则图线不会被显示。 绘制箱线图使用的是Boxplot模块, 主要的方法有 add_xaxis()和add_yaxis() from pyecharts.charts import Boxplot
from pyecharts.globals import ThemeType
from pyecharts import options as opts
y_data = [[5, 20, 22, 21, 23, 26, 25, 24, 28, 26, 29, 30, 50, 61]]
boxplot = Boxplot(init_opts=opts.InitOpts(theme=ThemeType.INFOGRAPHIC))
boxplot.add_xaxis([""])
boxplot.add_yaxis('', y_axis=boxplot.prepare_data(y_data))
boxplot.render("boxplot.html")Copy after login 图像效果如下:
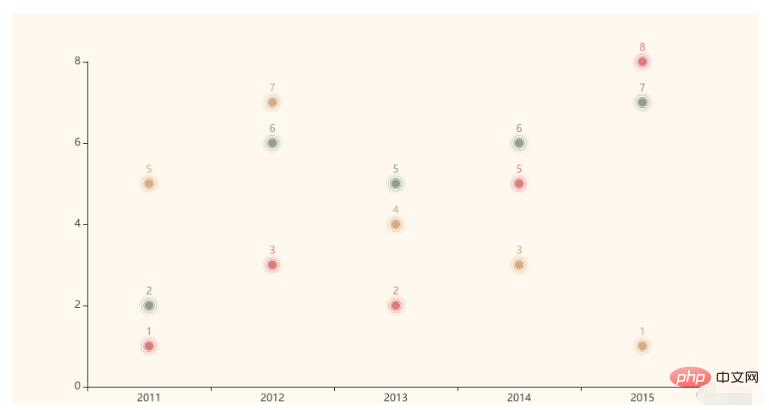
7. 涟漪特效散点图 EffectScatter模块绘制涟漪图使用的是EffectScatter模块,代码示例如下: from pyecharts.charts import EffectScatter
from pyecharts import options as opts
from pyecharts.globals import ThemeType
x = [2011, 2012, 2013, 2014, 2015]
x_data = [str(i) for i in x]
y1 = [1, 3, 2, 5, 8]
y2 = [2, 6, 5, 6, 7]
y3 = [5, 7, 4, 3, 1]
scatter = EffectScatter(init_opts=opts.InitOpts(theme=ThemeType.VINTAGE))
scatter.add_xaxis(x_data)
scatter.add_yaxis("", y1)
scatter.add_yaxis("", y2)
scatter.add_yaxis("", y3)
# 渲染图表到HTML文件,存放在程序所在目录下
scatter.render("EffectScatter.html")Copy after login 图像效果如下:
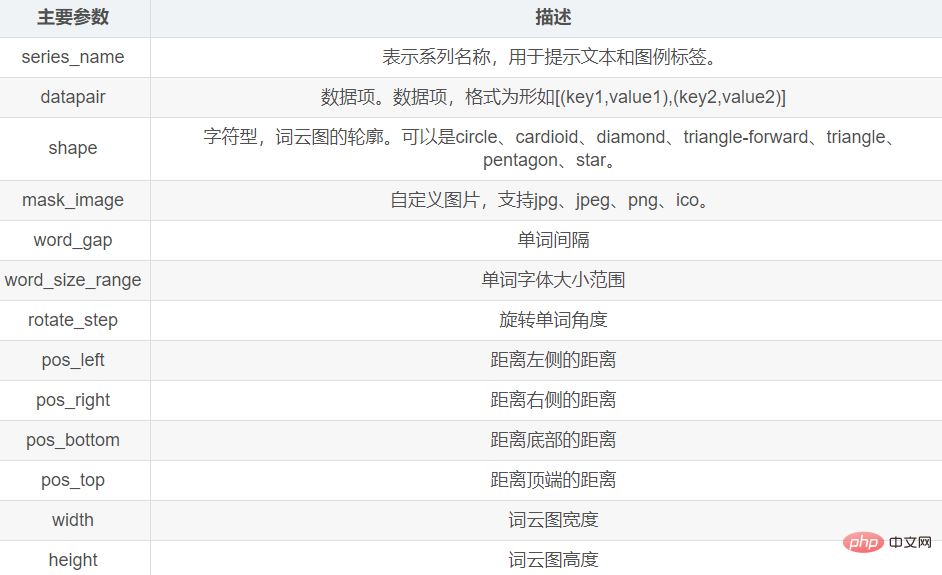
8. 词云图 WordCloud模块绘制词云图使用的是WordCloud模块, 主要的方法有add()方法。 add()方法的主要参数如下: add()方法主要的参数有
准备一个txt文件(001.txt),文本内容以《兰亭集序》为例:
代码示例如下: from pyecharts.charts import WordCloud
from jieba import analyse
# 基于TextRank算法从文本中提取关键词
textrank = analyse.textrank
text = open('001.txt', 'r', encoding='UTF-8').read()
keywords = textrank(text, topK=30)
list1 = []
tup1 = ()
# 关键词列表
for keyword, weight in textrank(text, topK=30, withWeight=True):
# print('%s %s' % (keyword, weight))
tup1 = (keyword, weight) # 关键词权重
list1.append(tup1) # 添加到列表中
# 绘制词云图
mywordcloud = WordCloud()
mywordcloud.add('', list1, word_size_range=[20, 100])
mywordcloud.render('wordclound.html')Copy after login 词云图效果如下:
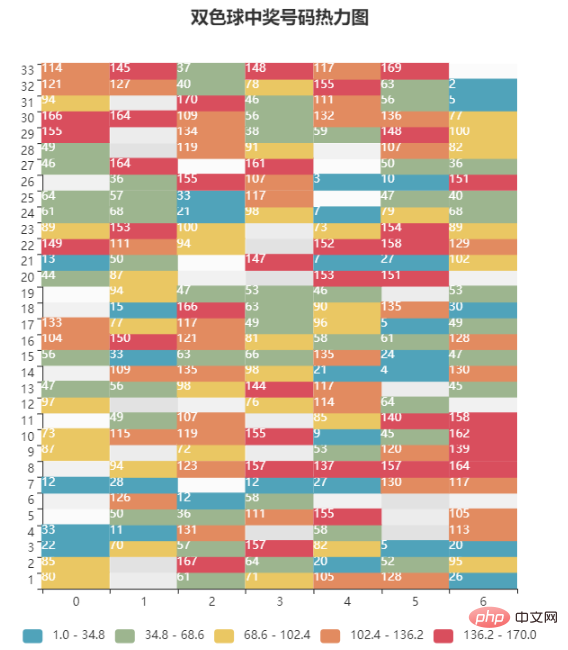
9. 热力图 HeatMap模块绘制热力图使用的是HeatMap模块。 下边以双色球案例为例,数据使用生成的随机数,绘制出热力图: import pyecharts.options as opts
from pyecharts.charts import HeatMap
import pandas as pd
import numpy as np
# 创建一个33行7列的DataFrame,数据使用随机数生成。每个数据表示该位置上该数字出现的次数
s1 = np.random.randint(0, 200, 33)
s2 = np.random.randint(0, 200, 33)
s3 = np.random.randint(0, 200, 33)
s4 = np.random.randint(0, 200, 33)
s5 = np.random.randint(0, 200, 33)
s6 = np.random.randint(0, 200, 33)
s7 = np.random.randint(0, 200, 33)
data = pd.DataFrame(
{'位置一': s1,
'位置二': s2,
'位置三': s3,
'位置四': s4,
'位置五': s5,
'位置六': s6,
'位置七': s7
},
index=range(1, 34)
)
# 数据转换为HeatMap支持的列表格式
value1 = []
for i in range(7):
for j in range(33):
value1.append([i, j, int(data.iloc[j, i])])
# 绘制热力图
x = data.columns
heatmap=HeatMap(init_opts=opts.InitOpts(width='600px' ,height='650px'))
heatmap.add_xaxis(x)
heatmap.add_yaxis("aa", list(data.index), value=value1, # y轴数据
# y轴标签
label_opts=opts.LabelOpts(is_show=True, color='white', position="center"))
heatmap.set_global_opts(title_opts=opts.TitleOpts(title="双色球中奖号码热力图", pos_left="center"),
legend_opts=opts.LegendOpts(is_show=False), # 不显示图例
# 坐标轴配置项
xaxis_opts=opts.AxisOpts(
type_="category", # 类目轴
# 分隔区域配置项
splitarea_opts=opts.SplitAreaOpts(
is_show=True, # 区域填充样式
areastyle_opts=opts.AreaStyleOpts(opacity=1)
),
),
# 坐标轴配置项
yaxis_opts=opts.AxisOpts(
type_="category", # 类目轴
# 分隔区域配置项
splitarea_opts=opts.SplitAreaOpts(
is_show=True,
# 区域填充样式
areastyle_opts=opts.AreaStyleOpts(opacity=1)
),
),
# 视觉映射配置项
visualmap_opts=opts.VisualMapOpts(is_piecewise=True, # 分段显示
min_=1, max_=170, # 最小值、最大值
orient='horizontal', # 水平方向
pos_left="center") # 居中
)
heatmap.render("heatmap.html")Copy after login 热力图效果如下:
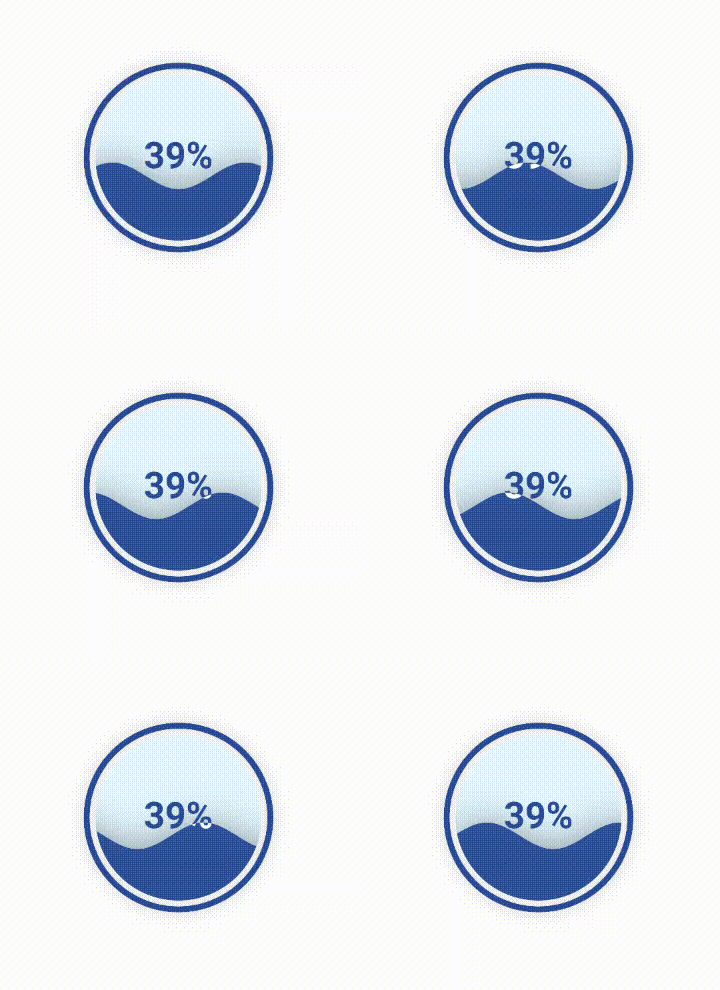
10. 水球图 Liquid模块绘制水球图使用的是Liquid模块。 from pyecharts.charts import Liquid
liquid = Liquid()
liquid.add('', [0.39])
liquid.render("liquid.html")Copy after login 水球图效果如下:
11. 日历图 Calendar模块绘制日历图使用的是Calendar模块 主要使用的方法是add()方法 import pandas as pd
import numpy as np
from pyecharts import options as opts
from pyecharts.charts import Calendar
data = list(np.random.random(30))
# 求最大值和最小值
mymax = round(max(data), 2)
mymin = round(min(data), 2)
# 生成日期
index = pd.date_range('20220401', '20220430')
# 合并列表
data_list = list(zip(index, data))
# 生成日历图
calendar = Calendar()
calendar.add("",
data_list,
calendar_opts=opts.CalendarOpts(range_=['2022-04-01', '2022-04-30']))
calendar.set_global_opts(
title_opts=opts.TitleOpts(title="2022年4月某指标情况", pos_left='center'),
visualmap_opts=opts.VisualMapOpts(
max_=mymax,
min_=mymin+0.1,
orient="horizontal",
is_piecewise=True,
pos_top="230px",
pos_left="70px",
),
)
calendar.render("calendar.html")Copy after login 日历图效果如下:
The above is the detailed content of How to use Pyecharts for Python data visualization. For more information, please follow other related articles on the PHP Chinese website! Statement of this Website
The content of this article is voluntarily contributed by netizens, and the copyright belongs to the original author. This site does not assume corresponding legal responsibility. If you find any content suspected of plagiarism or infringement, please contact admin@php.cn

Hot AI Tools
Undresser.AI UndressAI-powered app for creating realistic nude photos 
AI Clothes RemoverOnline AI tool for removing clothes from photos. 
Undress AI ToolUndress images for free 
Clothoff.ioAI clothes remover 
Video Face SwapSwap faces in any video effortlessly with our completely free AI face swap tool! 
Hot Article
Assassin's Creed Shadows: Seashell Riddle Solution
3 weeks ago
By DDD
What's New in Windows 11 KB5054979 & How to Fix Update Issues
2 weeks ago
By DDD
Where to find the Crane Control Keycard in Atomfall
3 weeks ago
By DDD
Assassin's Creed Shadows - How To Find The Blacksmith And Unlock Weapon And Armour Customisation
4 weeks ago
By DDD
Roblox: Dead Rails - How To Complete Every Challenge
3 weeks ago
By DDD

Hot Tools
Notepad++7.3.1Easy-to-use and free code editor 
SublimeText3 Chinese versionChinese version, very easy to use 
Zend Studio 13.0.1Powerful PHP integrated development environment 
Dreamweaver CS6Visual web development tools 
SublimeText3 Mac versionGod-level code editing software (SublimeText3) 
Hot Topics
CakePHP Tutorial
 1386
1386
 52
52
 Can vs code run in Windows 8
Apr 15, 2025 pm 07:24 PM
VS Code can run on Windows 8, but the experience may not be great. First make sure the system has been updated to the latest patch, then download the VS Code installation package that matches the system architecture and install it as prompted. After installation, be aware that some extensions may be incompatible with Windows 8 and need to look for alternative extensions or use newer Windows systems in a virtual machine. Install the necessary extensions to check whether they work properly. Although VS Code is feasible on Windows 8, it is recommended to upgrade to a newer Windows system for a better development experience and security.  How to run programs in terminal vscode
Apr 15, 2025 pm 06:42 PM
In VS Code, you can run the program in the terminal through the following steps: Prepare the code and open the integrated terminal to ensure that the code directory is consistent with the terminal working directory. Select the run command according to the programming language (such as Python's python your_file_name.py) to check whether it runs successfully and resolve errors. Use the debugger to improve debugging efficiency.  Can visual studio code be used in python
Apr 15, 2025 pm 08:18 PM
VS Code can be used to write Python and provides many features that make it an ideal tool for developing Python applications. It allows users to: install Python extensions to get functions such as code completion, syntax highlighting, and debugging. Use the debugger to track code step by step, find and fix errors. Integrate Git for version control. Use code formatting tools to maintain code consistency. Use the Linting tool to spot potential problems ahead of time.  Is the vscode extension malicious?
Apr 15, 2025 pm 07:57 PM
VS Code extensions pose malicious risks, such as hiding malicious code, exploiting vulnerabilities, and masturbating as legitimate extensions. Methods to identify malicious extensions include: checking publishers, reading comments, checking code, and installing with caution. Security measures also include: security awareness, good habits, regular updates and antivirus software.  Python: Automation, Scripting, and Task Management
Apr 16, 2025 am 12:14 AM
Python excels in automation, scripting, and task management. 1) Automation: File backup is realized through standard libraries such as os and shutil. 2) Script writing: Use the psutil library to monitor system resources. 3) Task management: Use the schedule library to schedule tasks. Python's ease of use and rich library support makes it the preferred tool in these areas.  Golang vs. Python: Concurrency and Multithreading
Apr 17, 2025 am 12:20 AM
Golang is more suitable for high concurrency tasks, while Python has more advantages in flexibility. 1.Golang efficiently handles concurrency through goroutine and channel. 2. Python relies on threading and asyncio, which is affected by GIL, but provides multiple concurrency methods. The choice should be based on specific needs.  What is vscode What is vscode for?
Apr 15, 2025 pm 06:45 PM
VS Code is the full name Visual Studio Code, which is a free and open source cross-platform code editor and development environment developed by Microsoft. It supports a wide range of programming languages and provides syntax highlighting, code automatic completion, code snippets and smart prompts to improve development efficiency. Through a rich extension ecosystem, users can add extensions to specific needs and languages, such as debuggers, code formatting tools, and Git integrations. VS Code also includes an intuitive debugger that helps quickly find and resolve bugs in your code.  Can visual studio code run python
Apr 15, 2025 pm 08:00 PM
VS Code not only can run Python, but also provides powerful functions, including: automatically identifying Python files after installing Python extensions, providing functions such as code completion, syntax highlighting, and debugging. Relying on the installed Python environment, extensions act as bridge connection editing and Python environment. The debugging functions include setting breakpoints, step-by-step debugging, viewing variable values, and improving debugging efficiency. The integrated terminal supports running complex commands such as unit testing and package management. Supports extended configuration and enhances features such as code formatting, analysis and version control. 
|


