

How to add labels to Matplotlib images in Python

1. Add text label plt.text()
is used to add text at the specified coordinate position on the image during the drawing process. What needs to be used is the plt.text() method.
Its main parameters are three:
plt.text(x, y, s)
where x and y represent the x and y axis coordinates of the incoming point. s represents a string.
It should be noted that the coordinates here, if xticks and yticks labels are set, do not refer to the labels, but the original values of the x and axes when drawing.
Because there are too many parameters, I will not explain them one by one. Learn their usage based on the code.
ha = 'center’ means the vertical alignment is centered, fontsize = 30 means the font size is 30, rotation = -25 means rotation The angle is -25 degrees. c Set the color, alpha set the transparency. va represents horizontal alignment.
1. Example
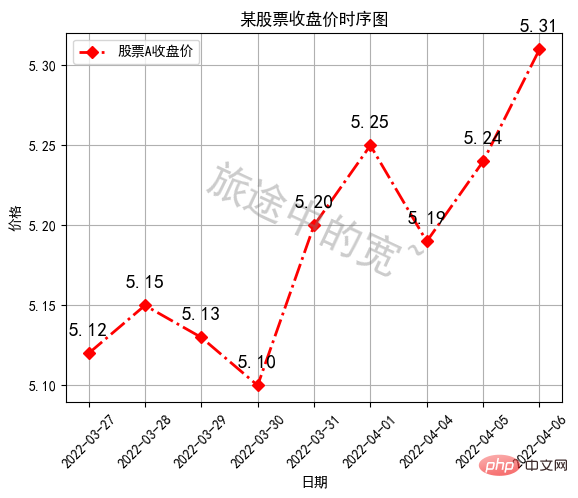
The code adds two pieces of text to the image, one is an italic watermark of "Wide on the Journey~" with an transparency of 0.4.
The other section is to mark the closing price of the day near each vertex of the polyline.
import matplotlib.pyplot as plt
plt.rcParams['font.sans-serif'] = ['SimHei']
plt.rcParams['axes.unicode_minus'] = False
x = range(9)
y = [5.12, 5.15, 5.13, 5.10, 5.2, 5.25, 5.19, 5.24, 5.31]
c = 0.5 * (min(x) + max(x))
d = min(y) + 0.3 * (max(y) - min(y))
# 水印效果
plt.text(c, d, '旅途中的宽~', ha = 'center', fontsize = 30, rotation = -25, c = 'gray', alpha = 0.4)
plt.plot(x, y, label = '股票A收盘价', c = 'r', ls = '-.', marker = 'D', lw = 2)
plt.xticks(x, [
	'2022-03-27', '2022-03-28', '2022-03-29', '2022-03-30',
	'2022-03-31', '2022-04-01', '2022-04-04', '2022-04-05',
	'2022-04-06'], rotation = 45)
plt.title('某股票收盘价时序图')
plt.xlabel('日期')
plt.ylabel('价格')
plt.grid(True)
plt.legend()
# 标出每天的收盘价
for a, b in zip(x, y):
	plt.text(a, b + 0.01, '%.2f' % b, ha = 'center', va = 'bottom', fontsize = 14)
plt.show()
2. Add comments plt.annotate()
Based on the above example code, add comments. An annotation is an explanation of a certain location in the image, which can be pointed to with an arrow.
Add annotations using plt.annotate()method
The common parameters in its syntax are as follows
plt.annotate(str,xy,xytext,xycoords,arrowcoords)
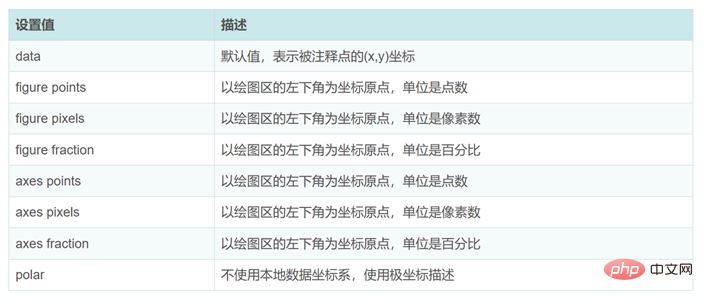
wherestr is the string to be used in the comment, that is, the comment text; xy refers to the coordinate point being commented; xytext refers to the position where the comment text is to be written; xycoords It is the coordinate system attribute of the annotated point, that is, how to describe the coordinates of the point. The setting value defaults to "data", which is described by (x, y) coordinates. Other optional setting values are as follows, where figure refers to the entire canvas as a reference system. And axes means only for one of the axes object areas.
arrowprops is a dictionary used to set the properties of arrows. Parameters written outside this dictionary represent attributes of the annotation text.
The values that can be set in the dictionary are:
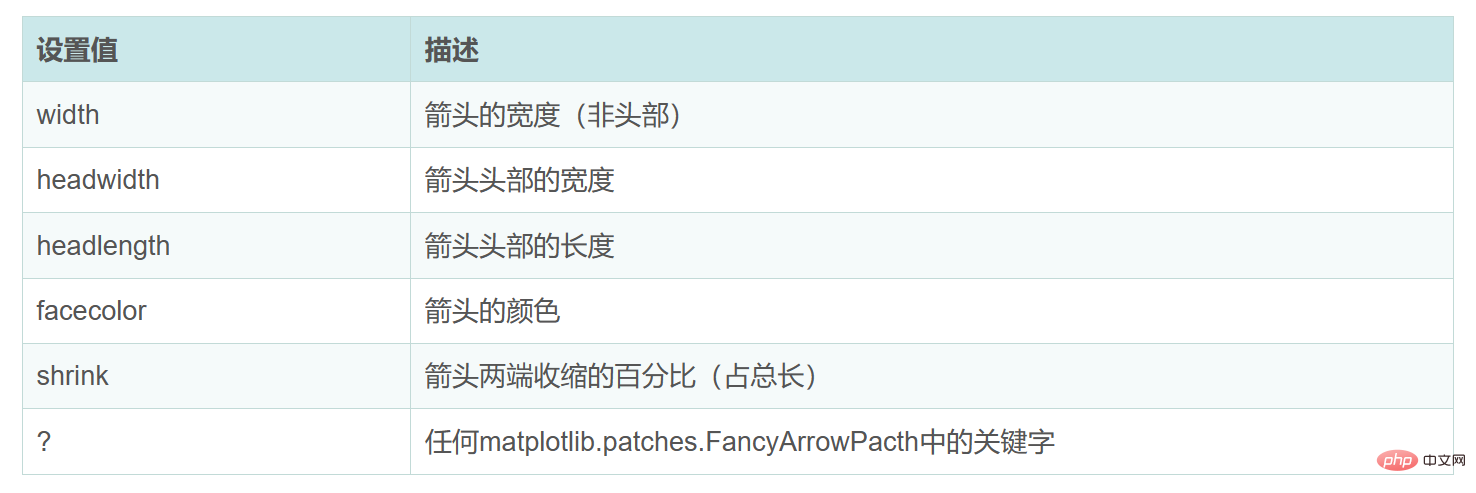
#Further explanation of these parameters: The total length of the arrow is first determined by the position coordinates of the annotated point and the annotation The length of the arrow is determined by the text position coordinates. You can further adjust the length of the arrow by adjusting the shrink key in the parameter arrowprops. shrink represents the percentage of the shortened length of the arrow to the total length (the length determined by the position coordinates of the annotated point and the annotation text position coordinates). . When shrink is not set, shrink defaults to 0, that is, no shortening. When shrink is very large, close to 1, its effect is equivalent to no shortening.
1. Example
Take marking the lowest price point on the chart as an example. Add a red arrow and the words "lowest price" at the target position.
Other parameters, such as setting the font of the annotation text, c or color represents the color, and fontsize represents the font size. Learn more about the properties and try them yourself.
import matplotlib.pyplot as plt
plt.rcParams['font.sans-serif'] = ['SimHei']
plt.rcParams['axes.unicode_minus'] = False
x = range(9)
y = [5.12, 5.15, 5.13, 5.10, 5.2, 5.25, 5.19, 5.24, 5.31]
c = 0.5 * (min(x) + max(x))
d = min(y) + 0.3 * (max(y) - min(y))
# 仿水印效果
plt.text(c, d, '旅途中的宽', ha = 'center', fontsize = 30, rotation = -25, c = 'gray', alpha = 0.4)
plt.plot(x, y, label = '股票A收盘价', c = 'r', ls = '-.', marker = 'D', lw = 2)
# plt.plot([5.09, 5.13, 5.16, 5.12, 5.09, 5.25, 5.16, 5.20, 5.25], label='股票B收盘价', c='g', ls=':', marker='H', lw=4)
plt.xticks(x, [
    '2022-03-27', '2022-03-28', '2022-03-29', '2022-03-30',
    '2022-03-31', '2022-04-01', '2022-04-04', '2022-04-05',
    '2022-04-06'], rotation = 45)
plt.title('某股票收盘价时序图')
plt.xlabel('日期')
plt.ylabel('价格')
plt.grid(True)
plt.legend()
# 标出每天的收盘价
for a, b in zip(x, y):
    plt.text(a, b + 0.01, '%.3f'% b, ha = 'center', va = 'bottom', fontsize = 9)
# 添加注释
plt.annotate('最低价', (x[y.index(min(y))], min(y)), (x[y.index(min(y))] + 0.5, min(y)), xycoords = 'data',
             arrowprops = dict(facecolor = 'r', shrink = 0.1), c = 'r',fontsize = 15)
plt.show()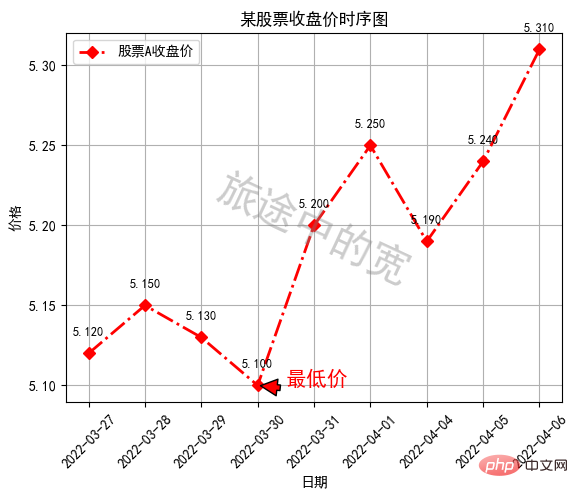
The following is a different effect. The added annotation arrow width is 3, the head width of the arrow is 10, the length is 20, shortened by 0.05, and the arrow is green , the annotation font is red. The code example is as follows:
import matplotlib.pyplot as plt
plt.rcParams['font.sans-serif'] = ['SimHei']
plt.rcParams['axes.unicode_minus'] = False
x = range(9)
y = [5.12, 5.15, 5.13, 5.10, 5.2, 5.25, 5.19, 5.24, 5.31]
c = 0.5 * (min(x) + max(x))
d = min(y) + 0.3 * (max(y)-min(y))
plt.plot(x, y, label = '股票A收盘价', c = 'k', ls = '-.', marker = 'D', lw = 2)
plt.xticks(x, [
    '2022-03-27', '2022-03-28', '2022-03-29', '2022-03-30',
    '2022-03-31', '2022-04-01', '2022-04-04', '2022-04-05',
    '2022-04-06'], rotation = 45)
plt.title('某股票收盘价时序图')
plt.xlabel('日期')
plt.ylabel('价格')
plt.grid(True)
plt.legend()
# 标出每天的收盘价
for a, b in zip(x, y):
    plt.text(a, b+0.01, '%.1f'%b, ha='center', va='bottom', fontsize=9)
plt.text(c, d, '旅途中的宽', ha = 'center', fontsize = 50, rotation = -25, c = 'r')
plt.annotate('最低价', (x[y.index(min(y))], min(y)), (x[y.index(min(y))] + 2, min(y)), xycoords = 'data',
             arrowprops = dict(width = 3, headwidth = 10, headlength = 20, facecolor = 'g', shrink = 0.05), c = 'r',fontsize = 20)
plt.show()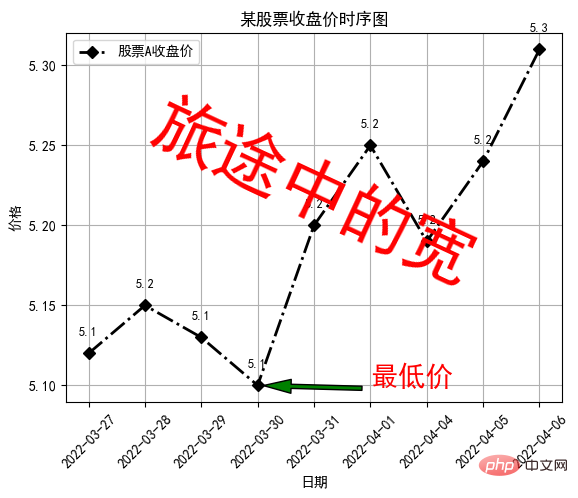
The above is the detailed content of How to add labels to Matplotlib images in Python. For more information, please follow other related articles on the PHP Chinese website!

Hot AI Tools

Undresser.AI Undress
AI-powered app for creating realistic nude photos

AI Clothes Remover
Online AI tool for removing clothes from photos.

Undress AI Tool
Undress images for free

Clothoff.io
AI clothes remover

AI Hentai Generator
Generate AI Hentai for free.

Hot Article
Hot Tools

Notepad++7.3.1
Easy-to-use and free code editor

SublimeText3 Chinese version
Chinese version, very easy to use

Zend Studio 13.0.1
Powerful PHP integrated development environment

Dreamweaver CS6
Visual web development tools

SublimeText3 Mac version
God-level code editing software (SublimeText3)
Hot Topics
 1358
1358
 52
1196
24
52
1196
24

 Is the conversion speed fast when converting XML to PDF on mobile phone?
Apr 02, 2025 pm 10:09 PM
Is the conversion speed fast when converting XML to PDF on mobile phone?
Apr 02, 2025 pm 10:09 PM
The speed of mobile XML to PDF depends on the following factors: the complexity of XML structure. Mobile hardware configuration conversion method (library, algorithm) code quality optimization methods (select efficient libraries, optimize algorithms, cache data, and utilize multi-threading). Overall, there is no absolute answer and it needs to be optimized according to the specific situation.
 How to convert XML files to PDF on your phone?
Apr 02, 2025 pm 10:12 PM
How to convert XML files to PDF on your phone?
Apr 02, 2025 pm 10:12 PM
It is impossible to complete XML to PDF conversion directly on your phone with a single application. It is necessary to use cloud services, which can be achieved through two steps: 1. Convert XML to PDF in the cloud, 2. Access or download the converted PDF file on the mobile phone.
 What is the function of C language sum?
Apr 03, 2025 pm 02:21 PM
What is the function of C language sum?
Apr 03, 2025 pm 02:21 PM
There is no built-in sum function in C language, so it needs to be written by yourself. Sum can be achieved by traversing the array and accumulating elements: Loop version: Sum is calculated using for loop and array length. Pointer version: Use pointers to point to array elements, and efficient summing is achieved through self-increment pointers. Dynamically allocate array version: Dynamically allocate arrays and manage memory yourself, ensuring that allocated memory is freed to prevent memory leaks.
 Recommended XML formatting tool
Apr 02, 2025 pm 09:03 PM
Recommended XML formatting tool
Apr 02, 2025 pm 09:03 PM
XML formatting tools can type code according to rules to improve readability and understanding. When selecting a tool, pay attention to customization capabilities, handling of special circumstances, performance and ease of use. Commonly used tool types include online tools, IDE plug-ins, and command-line tools.
 Is there a mobile app that can convert XML into PDF?
Apr 02, 2025 pm 09:45 PM
Is there a mobile app that can convert XML into PDF?
Apr 02, 2025 pm 09:45 PM
There is no APP that can convert all XML files into PDFs because the XML structure is flexible and diverse. The core of XML to PDF is to convert the data structure into a page layout, which requires parsing XML and generating PDF. Common methods include parsing XML using Python libraries such as ElementTree and generating PDFs using ReportLab library. For complex XML, it may be necessary to use XSLT transformation structures. When optimizing performance, consider using multithreaded or multiprocesses and select the appropriate library.
 How to convert xml into pictures
Apr 03, 2025 am 07:39 AM
How to convert xml into pictures
Apr 03, 2025 am 07:39 AM
XML can be converted to images by using an XSLT converter or image library. XSLT Converter: Use an XSLT processor and stylesheet to convert XML to images. Image Library: Use libraries such as PIL or ImageMagick to create images from XML data, such as drawing shapes and text.
 How to convert XML to PDF on your phone with high quality?
Apr 02, 2025 pm 09:48 PM
How to convert XML to PDF on your phone with high quality?
Apr 02, 2025 pm 09:48 PM
Convert XML to PDF with high quality on your mobile phone requires: parsing XML in the cloud and generating PDFs using a serverless computing platform. Choose efficient XML parser and PDF generation library. Handle errors correctly. Make full use of cloud computing power to avoid heavy tasks on your phone. Adjust complexity according to requirements, including processing complex XML structures, generating multi-page PDFs, and adding images. Print log information to help debug. Optimize performance, select efficient parsers and PDF libraries, and may use asynchronous programming or preprocessing XML data. Ensure good code quality and maintainability.
 Is there any mobile app that can convert XML into PDF?
Apr 02, 2025 pm 08:54 PM
Is there any mobile app that can convert XML into PDF?
Apr 02, 2025 pm 08:54 PM
An application that converts XML directly to PDF cannot be found because they are two fundamentally different formats. XML is used to store data, while PDF is used to display documents. To complete the transformation, you can use programming languages and libraries such as Python and ReportLab to parse XML data and generate PDF documents.
