

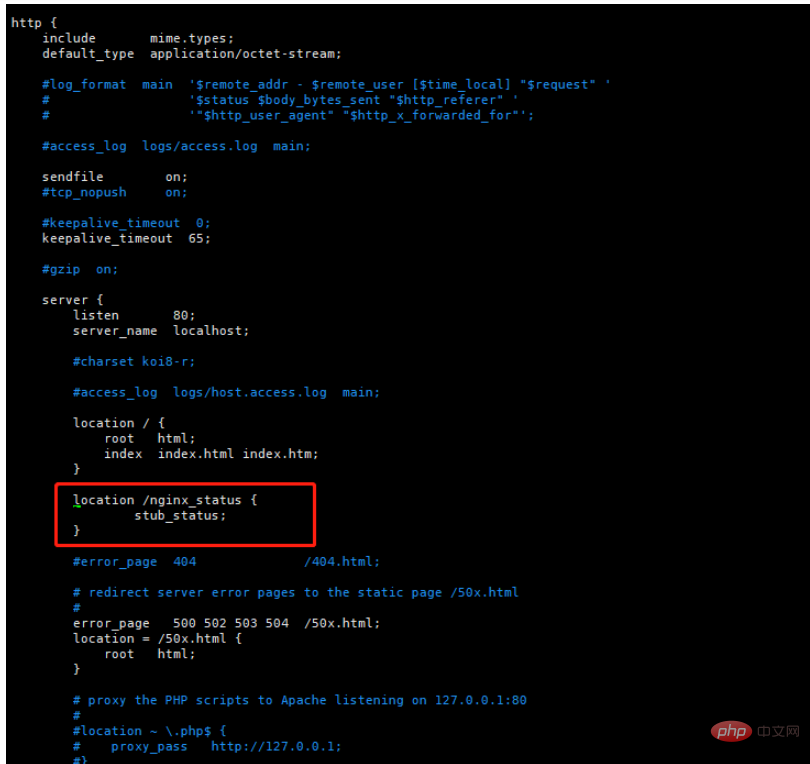
vim /usr/local/nginx/conf/nginx.conf

 location /nginx_status {
                stub_status;
        }
说明:
	nginx_status	自定义字段,访问地址(例:192.168.169.131/nginx_status)
	stub_status		固定参数


# 重启 nginx
./nginx reload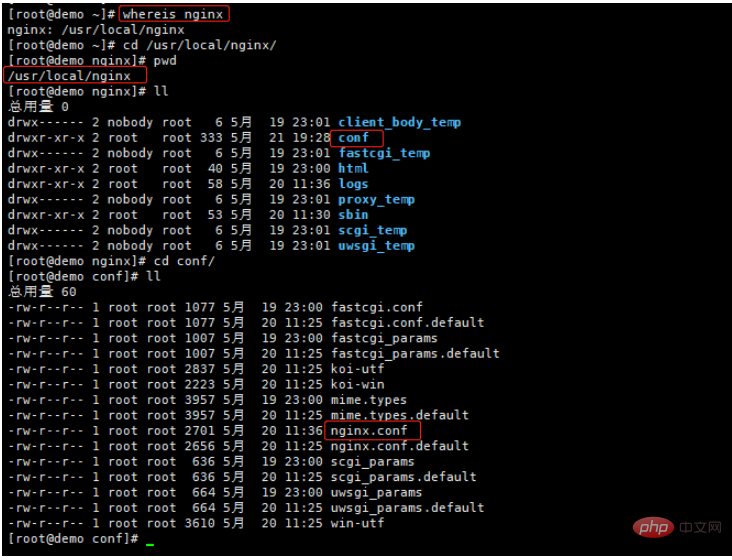
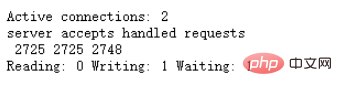
浏览器访问状态说明:
		Active connections  Nginx正处理的活动链接数个数;重要

		server              Nginx启动到现在共处理了多少个连接。

		accepts             Nginx启动到现在共成功创建几次握手。

		handled requests    Nginx总共处理了几次请求。

		Reading             Nginx读取到客户端的 Header 信息数。

		Writing             Nginx返回给客户端的 Header 信息数。

		Waiting             Nginx已经处理完正在等候下一次请求指令的驻留链接,开启。

		Keep-alive的情况下,Waiting这个值等于active-(reading + writing)。

		请求丢失数=(握手数-连接数)可以看出,本次状态显示没有丢失请求
#/bin/bash
#Description:Automated monitoring nginx performance and process nginx_status scripts

NGINX_PORT=80
NGINX_COMMAND=$1

nginx_ping(){
    /sbin/pidof nginx |wc -l
    }

nginx_active(){
    /usr/bin/curl -s "http://127.0.0.1:"$NGINX_PORT"/nginx_status/" |awk '/Active/ {print $NF}'
    }

nginx_reading(){
    /usr/bin/curl -s "http://127.0.0.1:"$NGINX_PORT"/nginx_status/" |awk '/Reading/ {print $2}'
    }

nginx_writing(){
    /usr/bin/curl -s "http://127.0.0.1:"$NGINX_PORT"/nginx_status/" |awk '/Writing/ {print $4}'
    }

nginx_waiting(){
    /usr/bin/curl -s "http://127.0.0.1:"$NGINX_PORT"/nginx_status/" |awk '/Waiting/ {print $6}'
    }

nginx_accepts(){
    /usr/bin/curl -s "http://127.0.0.1:"$NGINX_PORT"/nginx_status/" |awk 'NR==3 {print $1}'
    }

nginx_handled(){
    /usr/bin/curl -s "http://127.0.0.1:"$NGINX_PORT"/nginx_status/" |awk 'NR==3 {print $2}'
    }

nginx_requests(){
    /usr/bin/curl -s "http://127.0.0.1:"$NGINX_PORT"/nginx_status/" |awk 'NR==3 {print $3}'
    }

case $NGINX_COMMAND in
    ping)
        nginx_ping
        ;;
    active)
        nginx_active
        ;;
    reading)
        nginx_reading
        ;;
    writing)
        nginx_writing
        ;;
    waiting)
        nginx_waiting
        ;;
    accepts)
        nginx_accepts
        ;;
    handled)
        nginx_handled
        ;;
    requests)
        nginx_requests
        ;;
    *)
        echo $"USAGE:$0 {ping|active|reading|writing|waiting|accepts|handled|requests}"
esac# 修改文件权限 chmod u+x /etc/zabbix/zabbix_agentd.d/zabbix_nginx.sh
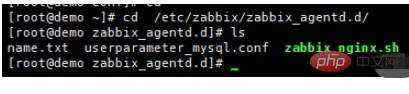
vim /etc/zabbix/zabbix_agentd.d/userparameter_mysql.conf

# 增加
UserParameter=nginx_status[*],/bin/bash /etc/zabbix/zabbix_agentd.d/zabbix_nginx.sh \$1
# 修改完成重启 zabbix-agent
systemctl restart zabbix-agent.service
[root@zabbix ~]# zabbix_get -s 192.168.169.131 -k nginx_status[active]
模块名称:Template Nginx Web Status Monitor(自定义)
可见名称:NGINX STATUS MONITOR(自定义)
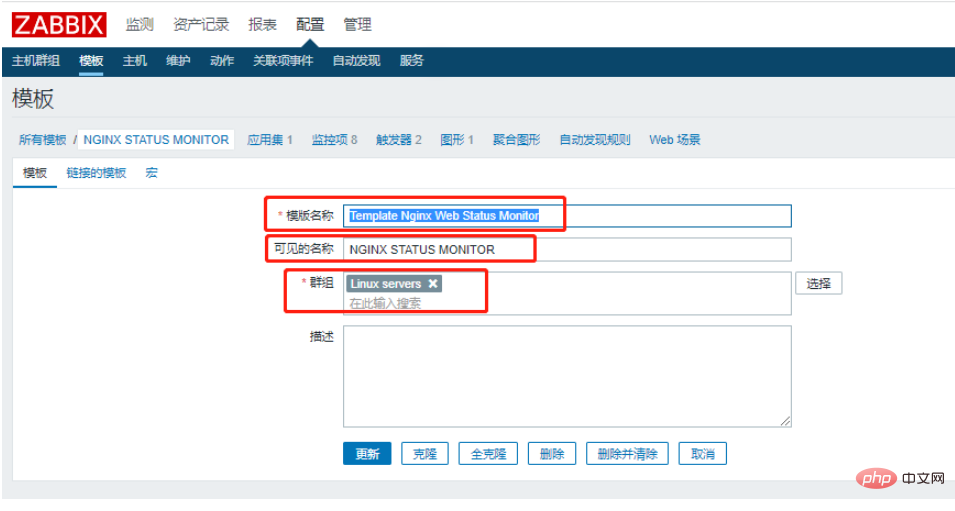
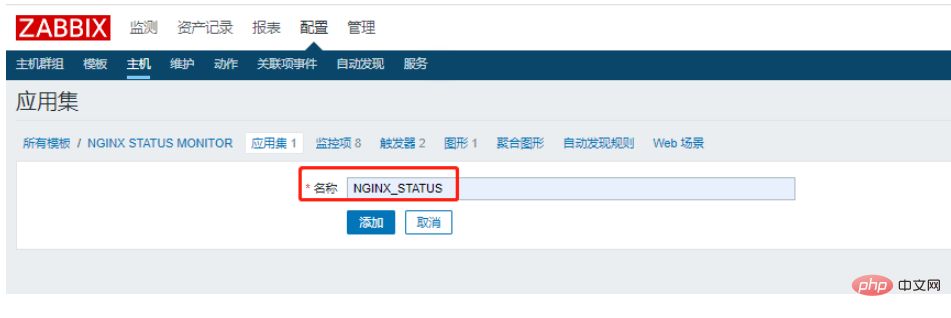
名称:NGINX_STATUS
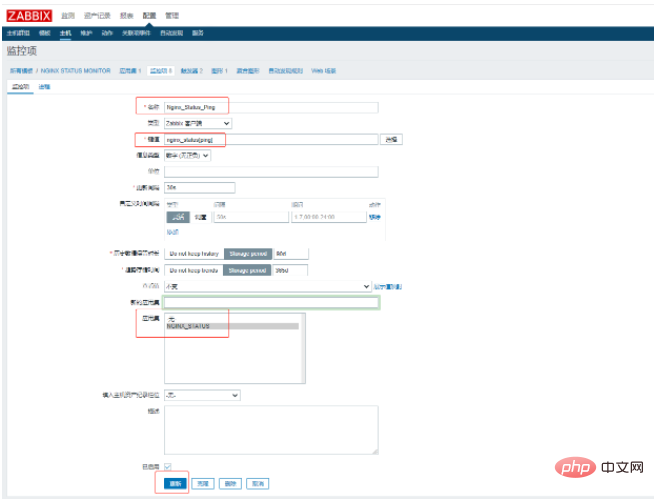
名称:Nginx_Status_Ping
键值:nginx_status[ping]
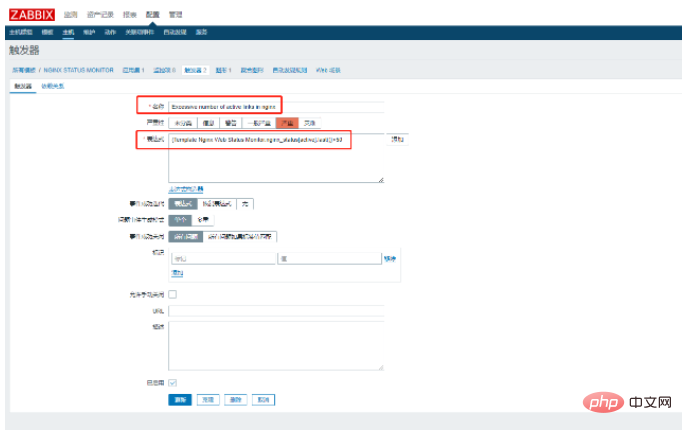
超过50个并发连接就执行报警
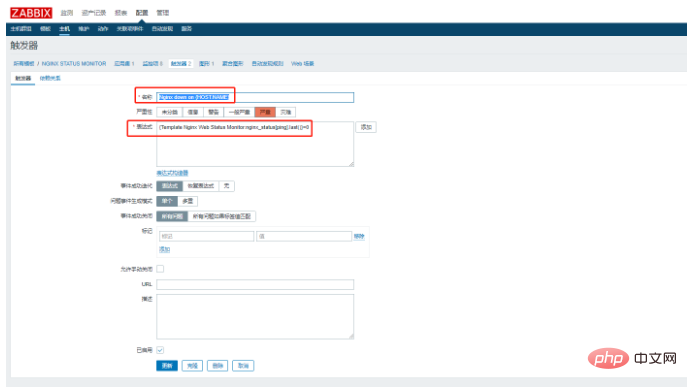
nginx 服务down了执行报警
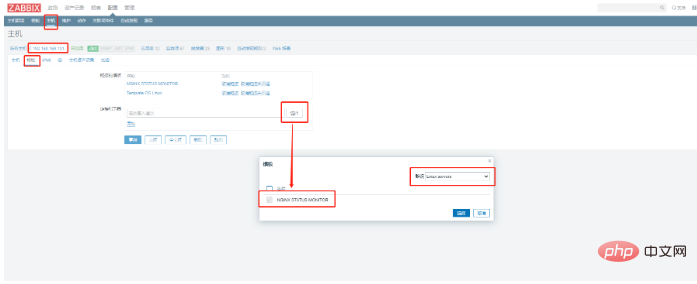
将需要监控的主机添加上此模板
zbx_export_templates.xml
<?xml version="1.0" encoding="UTF-8"?>
<zabbix_export>
<version>4.0</version>
<date>2022-05-21T12:29:43Z</date>
<groups>
<group>
<name>Linux servers</name>
</group>
</groups>
<templates>
<template>
<template>Template Nginx Web Status Monitor</template>
<name>NGINX STATUS MONITOR</name>
<description/>
<groups>
<group>
<name>Linux servers</name>
</group>
</groups>
<applications>
<application>
<name>NGINX_STATUS</name>
</application>
</applications>
<items>
<item>
<name>Nginx_Status_accepts</name>
<type>0</type>
<snmp_community/>
<snmp_oid/>
<key>nginx_status[accepts]</key>
<delay>30s</delay>
<history>90d</history>
<trends>365d</trends>
<status>0</status>
<value_type>3</value_type>
<allowed_hosts/>
<units/>
<snmpv3_contextname/>
<snmpv3_securityname/>
<snmpv3_securitylevel>0</snmpv3_securitylevel>
<snmpv3_authprotocol>0</snmpv3_authprotocol>
<snmpv3_authpassphrase/>
<snmpv3_privprotocol>0</snmpv3_privprotocol>
<snmpv3_privpassphrase/>
<params/>
<ipmi_sensor/>
<authtype>0</authtype>
<username/>
<password/>
<publickey/>
<privatekey/>
<port/>
<description/>
<inventory_link>0</inventory_link>
<applications>
<application>
<name>NGINX_STATUS</name>
</application>
</applications>
<valuemap/>
<logtimefmt/>
<preprocessing/>
<jmx_endpoint/>
<timeout>3s</timeout>
<url/>
<query_fields/>
<posts/>
<status_codes>200</status_codes>
<follow_redirects>1</follow_redirects>
<post_type>0</post_type>
<http_proxy/>
<headers/>
<retrieve_mode>0</retrieve_mode>
<request_method>0</request_method>
<output_format>0</output_format>
<allow_traps>0</allow_traps>
<ssl_cert_file/>
<ssl_key_file/>
<ssl_key_password/>
<verify_peer>0</verify_peer>
<verify_host>0</verify_host>
<master_item/>
</item>
<item>
<name>Nginx_Status_active</name>
<type>0</type>
<snmp_community/>
<snmp_oid/>
<key>nginx_status[active]</key>
<delay>30s</delay>
<history>90d</history>
<trends>365d</trends>
<status>0</status>
<value_type>3</value_type>
<allowed_hosts/>
<units/>
<snmpv3_contextname/>
<snmpv3_securityname/>
<snmpv3_securitylevel>0</snmpv3_securitylevel>
<snmpv3_authprotocol>0</snmpv3_authprotocol>
<snmpv3_authpassphrase/>
<snmpv3_privprotocol>0</snmpv3_privprotocol>
<snmpv3_privpassphrase/>
<params/>
<ipmi_sensor/>
<authtype>0</authtype>
<username/>
<password/>
<publickey/>
<privatekey/>
<port/>
<description/>
<inventory_link>0</inventory_link>
<applications>
<application>
<name>NGINX_STATUS</name>
</application>
</applications>
<valuemap/>
<logtimefmt/>
<preprocessing/>
<jmx_endpoint/>
<timeout>3s</timeout>
<url/>
<query_fields/>
<posts/>
<status_codes>200</status_codes>
<follow_redirects>1</follow_redirects>
<post_type>0</post_type>
<http_proxy/>
<headers/>
<retrieve_mode>0</retrieve_mode>
<request_method>0</request_method>
<output_format>0</output_format>
<allow_traps>0</allow_traps>
<ssl_cert_file/>
<ssl_key_file/>
<ssl_key_password/>
<verify_peer>0</verify_peer>
<verify_host>0</verify_host>
<master_item/>
</item>
<item>
<name>Nginx_Status_handled</name>
<type>0</type>
<snmp_community/>
<snmp_oid/>
<key>nginx_status[handled]</key>
<delay>30s</delay>
<history>90d</history>
<trends>365d</trends>
<status>0</status>
<value_type>3</value_type>
<allowed_hosts/>
<units/>
<snmpv3_contextname/>
<snmpv3_securityname/>
<snmpv3_securitylevel>0</snmpv3_securitylevel>
<snmpv3_authprotocol>0</snmpv3_authprotocol>
<snmpv3_authpassphrase/>
<snmpv3_privprotocol>0</snmpv3_privprotocol>
<snmpv3_privpassphrase/>
<params/>
<ipmi_sensor/>
<authtype>0</authtype>
<username/>
<password/>
<publickey/>
<privatekey/>
<port/>
<description/>
<inventory_link>0</inventory_link>
<applications>
<application>
<name>NGINX_STATUS</name>
</application>
</applications>
<valuemap/>
<logtimefmt/>
<preprocessing/>
<jmx_endpoint/>
<timeout>3s</timeout>
<url/>
<query_fields/>
<posts/>
<status_codes>200</status_codes>
<follow_redirects>1</follow_redirects>
<post_type>0</post_type>
<http_proxy/>
<headers/>
<retrieve_mode>0</retrieve_mode>
<request_method>0</request_method>
<output_format>0</output_format>
<allow_traps>0</allow_traps>
<ssl_cert_file/>
<ssl_key_file/>
<ssl_key_password/>
<verify_peer>0</verify_peer>
<verify_host>0</verify_host>
<master_item/>
</item>
<item>
<name>Nginx_Status_Ping</name>
<type>0</type>
<snmp_community/>
<snmp_oid/>
<key>nginx_status[ping]</key>
<delay>30s</delay>
<history>90d</history>
<trends>365d</trends>
<status>0</status>
<value_type>3</value_type>
<allowed_hosts/>
<units/>
<snmpv3_contextname/>
<snmpv3_securityname/>
<snmpv3_securitylevel>0</snmpv3_securitylevel>
<snmpv3_authprotocol>0</snmpv3_authprotocol>
<snmpv3_authpassphrase/>
<snmpv3_privprotocol>0</snmpv3_privprotocol>
<snmpv3_privpassphrase/>
<params/>
<ipmi_sensor/>
<authtype>0</authtype>
<username/>
<password/>
<publickey/>
<privatekey/>
<port/>
<description/>
<inventory_link>0</inventory_link>
<applications>
<application>
<name>NGINX_STATUS</name>
</application>
</applications>
<valuemap/>
<logtimefmt/>
<preprocessing/>
<jmx_endpoint/>
<timeout>3s</timeout>
<url/>
<query_fields/>
<posts/>
<status_codes>200</status_codes>
<follow_redirects>1</follow_redirects>
<post_type>0</post_type>
<http_proxy/>
<headers/>
<retrieve_mode>0</retrieve_mode>
<request_method>0</request_method>
<output_format>0</output_format>
<allow_traps>0</allow_traps>
<ssl_cert_file/>
<ssl_key_file/>
<ssl_key_password/>
<verify_peer>0</verify_peer>
<verify_host>0</verify_host>
<master_item/>
</item>
<item>
<name>Nginx_Status_reading</name>
<type>0</type>
<snmp_community/>
<snmp_oid/>
<key>nginx_status[reading]</key>
<delay>30s</delay>
<history>90d</history>
<trends>365d</trends>
<status>0</status>
<value_type>3</value_type>
<allowed_hosts/>
<units/>
<snmpv3_contextname/>
<snmpv3_securityname/>
<snmpv3_securitylevel>0</snmpv3_securitylevel>
<snmpv3_authprotocol>0</snmpv3_authprotocol>
<snmpv3_authpassphrase/>
<snmpv3_privprotocol>0</snmpv3_privprotocol>
<snmpv3_privpassphrase/>
<params/>
<ipmi_sensor/>
<authtype>0</authtype>
<username/>
<password/>
<publickey/>
<privatekey/>
<port/>
<description/>
<inventory_link>0</inventory_link>
<applications>
<application>
<name>NGINX_STATUS</name>
</application>
</applications>
<valuemap/>
<logtimefmt/>
<preprocessing/>
<jmx_endpoint/>
<timeout>3s</timeout>
<url/>
<query_fields/>
<posts/>
<status_codes>200</status_codes>
<follow_redirects>1</follow_redirects>
<post_type>0</post_type>
<http_proxy/>
<headers/>
<retrieve_mode>0</retrieve_mode>
<request_method>0</request_method>
<output_format>0</output_format>
<allow_traps>0</allow_traps>
<ssl_cert_file/>
<ssl_key_file/>
<ssl_key_password/>
<verify_peer>0</verify_peer>
<verify_host>0</verify_host>
<master_item/>
</item>
<item>
<name>Nginx_Status_requests</name>
<type>0</type>
<snmp_community/>
<snmp_oid/>
<key>nginx_status[requests]</key>
<delay>30s</delay>
<history>90d</history>
<trends>365d</trends>
<status>0</status>
<value_type>3</value_type>
<allowed_hosts/>
<units/>
<snmpv3_contextname/>
<snmpv3_securityname/>
<snmpv3_securitylevel>0</snmpv3_securitylevel>
<snmpv3_authprotocol>0</snmpv3_authprotocol>
<snmpv3_authpassphrase/>
<snmpv3_privprotocol>0</snmpv3_privprotocol>
<snmpv3_privpassphrase/>
<params/>
<ipmi_sensor/>
<authtype>0</authtype>
<username/>
<password/>
<publickey/>
<privatekey/>
<port/>
<description/>
<inventory_link>0</inventory_link>
<applications>
<application>
<name>NGINX_STATUS</name>
</application>
</applications>
<valuemap/>
<logtimefmt/>
<preprocessing/>
<jmx_endpoint/>
<timeout>3s</timeout>
<url/>
<query_fields/>
<posts/>
<status_codes>200</status_codes>
<follow_redirects>1</follow_redirects>
<post_type>0</post_type>
<http_proxy/>
<headers/>
<retrieve_mode>0</retrieve_mode>
<request_method>0</request_method>
<output_format>0</output_format>
<allow_traps>0</allow_traps>
<ssl_cert_file/>
<ssl_key_file/>
<ssl_key_password/>
<verify_peer>0</verify_peer>
<verify_host>0</verify_host>
<master_item/>
</item>
<item>
<name>Nginx_Status_waiting</name>
<type>0</type>
<snmp_community/>
<snmp_oid/>
<key>nginx_status[waiting]</key>
<delay>30s</delay>
<history>90d</history>
<trends>365d</trends>
<status>0</status>
<value_type>3</value_type>
<allowed_hosts/>
<units/>
<snmpv3_contextname/>
<snmpv3_securityname/>
<snmpv3_securitylevel>0</snmpv3_securitylevel>
<snmpv3_authprotocol>0</snmpv3_authprotocol>
<snmpv3_authpassphrase/>
<snmpv3_privprotocol>0</snmpv3_privprotocol>
<snmpv3_privpassphrase/>
<params/>
<ipmi_sensor/>
<authtype>0</authtype>
<username/>
<password/>
<publickey/>
<privatekey/>
<port/>
<description/>
<inventory_link>0</inventory_link>
<applications>
<application>
<name>NGINX_STATUS</name>
</application>
</applications>
<valuemap/>
<logtimefmt/>
<preprocessing/>
<jmx_endpoint/>
<timeout>3s</timeout>
<url/>
<query_fields/>
<posts/>
<status_codes>200</status_codes>
<follow_redirects>1</follow_redirects>
<post_type>0</post_type>
<http_proxy/>
<headers/>
<retrieve_mode>0</retrieve_mode>
<request_method>0</request_method>
<output_format>0</output_format>
<allow_traps>0</allow_traps>
<ssl_cert_file/>
<ssl_key_file/>
<ssl_key_password/>
<verify_peer>0</verify_peer>
<verify_host>0</verify_host>
<master_item/>
</item>
<item>
<name>Nginx_Status_writing</name>
<type>0</type>
<snmp_community/>
<snmp_oid/>
<key>nginx_status[writing]</key>
<delay>30s</delay>
<history>90d</history>
<trends>365d</trends>
<status>0</status>
<value_type>3</value_type>
<allowed_hosts/>
<units/>
<snmpv3_contextname/>
<snmpv3_securityname/>
<snmpv3_securitylevel>0</snmpv3_securitylevel>
<snmpv3_authprotocol>0</snmpv3_authprotocol>
<snmpv3_authpassphrase/>
<snmpv3_privprotocol>0</snmpv3_privprotocol>
<snmpv3_privpassphrase/>
<params/>
<ipmi_sensor/>
<authtype>0</authtype>
<username/>
<password/>
<publickey/>
<privatekey/>
<port/>
<description/>
<inventory_link>0</inventory_link>
<applications>
<application>
<name>NGINX_STATUS</name>
</application>
</applications>
<valuemap/>
<logtimefmt/>
<preprocessing/>
<jmx_endpoint/>
<timeout>3s</timeout>
<url/>
<query_fields/>
<posts/>
<status_codes>200</status_codes>
<follow_redirects>1</follow_redirects>
<post_type>0</post_type>
<http_proxy/>
<headers/>
<retrieve_mode>0</retrieve_mode>
<request_method>0</request_method>
<output_format>0</output_format>
<allow_traps>0</allow_traps>
<ssl_cert_file/>
<ssl_key_file/>
<ssl_key_password/>
<verify_peer>0</verify_peer>
<verify_host>0</verify_host>
<master_item/>
</item>
</items>
<discovery_rules/>
<httptests/>
<macros/>
<templates/>
<screens/>
</template>
</templates>
<triggers>
<trigger>
<expression>{Template Nginx Web Status Monitor:nginx_status[active].last()}>50</expression>
<recovery_mode>0</recovery_mode>
<recovery_expression/>
<name>Excessive number of active links in nginx</name>
<correlation_mode>0</correlation_mode>
<correlation_tag/>
<url/>
<status>0</status>
<priority>4</priority>
<description/>
<type>0</type>
<manual_close>0</manual_close>
<dependencies/>
<tags/>
</trigger>
<trigger>
<expression>{Template Nginx Web Status Monitor:nginx_status[ping].last()}=0</expression>
<recovery_mode>0</recovery_mode>
<recovery_expression/>
<name>Nginx down on {HOST.NAME}</name>
<correlation_mode>0</correlation_mode>
<correlation_tag/>
<url/>
<status>0</status>
<priority>4</priority>
<description/>
<type>0</type>
<manual_close>0</manual_close>
<dependencies/>
<tags/>
</trigger>
</triggers>
<graphs>
<graph>
<name>Nginx_Status</name>
<width>900</width>
<height>200</height>
<yaxismin>0.0000</yaxismin>
<yaxismax>100.0000</yaxismax>
<show_work_period>1</show_work_period>
<show_triggers>1</show_triggers>
<type>0</type>
<show_legend>1</show_legend>
<show_3d>0</show_3d>
<percent_left>0.0000</percent_left>
<percent_right>0.0000</percent_right>
<ymin_type_1>0</ymin_type_1>
<ymax_type_1>0</ymax_type_1>
<ymin_item_1>0</ymin_item_1>
<ymax_item_1>0</ymax_item_1>
<graph_items>
<graph_item>
<sortorder>1</sortorder>
<drawtype>0</drawtype>
<color>1A7C11</color>
<yaxisside>0</yaxisside>
<calc_fnc>2</calc_fnc>
<type>0</type>
<item>
<host>Template Nginx Web Status Monitor</host>
<key>nginx_status[accepts]</key>
</item>
</graph_item>
<graph_item>
<sortorder>2</sortorder>
<drawtype>0</drawtype>
<color>F63100</color>
<yaxisside>0</yaxisside>
<calc_fnc>2</calc_fnc>
<type>0</type>
<item>
<host>Template Nginx Web Status Monitor</host>
<key>nginx_status[active]</key>
</item>
</graph_item>
<graph_item>
<sortorder>3</sortorder>
<drawtype>0</drawtype>
<color>2774A4</color>
<yaxisside>0</yaxisside>
<calc_fnc>2</calc_fnc>
<type>0</type>
<item>
<host>Template Nginx Web Status Monitor</host>
<key>nginx_status[handled]</key>
</item>
</graph_item>
<graph_item>
<sortorder>4</sortorder>
<drawtype>0</drawtype>
<color>A54F10</color>
<yaxisside>0</yaxisside>
<calc_fnc>2</calc_fnc>
<type>0</type>
<item>
<host>Template Nginx Web Status Monitor</host>
<key>nginx_status[ping]</key>
</item>
</graph_item>
<graph_item>
<sortorder>5</sortorder>
<drawtype>0</drawtype>
<color>FC6EA3</color>
<yaxisside>0</yaxisside>
<calc_fnc>2</calc_fnc>
<type>0</type>
<item>
<host>Template Nginx Web Status Monitor</host>
<key>nginx_status[reading]</key>
</item>
</graph_item>
<graph_item>
<sortorder>6</sortorder>
<drawtype>0</drawtype>
<color>6C59DC</color>
<yaxisside>0</yaxisside>
<calc_fnc>2</calc_fnc>
<type>0</type>
<item>
<host>Template Nginx Web Status Monitor</host>
<key>nginx_status[requests]</key>
</item>
</graph_item>
<graph_item>
<sortorder>7</sortorder>
<drawtype>0</drawtype>
<color>AC8C14</color>
<yaxisside>0</yaxisside>
<calc_fnc>2</calc_fnc>
<type>0</type>
<item>
<host>Template Nginx Web Status Monitor</host>
<key>nginx_status[waiting]</key>
</item>
</graph_item>
<graph_item>
<sortorder>8</sortorder>
<drawtype>0</drawtype>
<color>611F27</color>
<yaxisside>0</yaxisside>
<calc_fnc>2</calc_fnc>
<type>0</type>
<item>
<host>Template Nginx Web Status Monitor</host>
<key>nginx_status[writing]</key>
</item>
</graph_item>
</graph_items>
</graph>
</graphs>
</zabbix_export>The above is the detailed content of How to configure nginx monitoring in zabbix. For more information, please follow other related articles on the PHP Chinese website!
 nginx restart
 Detailed explanation of nginx configuration
 Detailed explanation of nginx configuration
 What are the differences between tomcat and nginx
 Server attack defense methods
 Implement 301 jump method through js code
 Linux compression zip command usage
 Solution to no sound in win7 system
 How to solve the problem of access denied when booting up Windows 10


![[Web front-end] Node.js quick start](https://img.php.cn/upload/course/000/000/067/662b5d34ba7c0227.png)


