
Prediction model: Neural network prediction, gray prediction, fitted interpolation prediction (linear regression), time series prediction, Markov chain prediction, differential equation prediction, Logistic model, etc. Application areas: Population forecast, water pollution growth forecast, virus spread forecast, competition winning probability
Forecast, monthly income forecast, sales forecast, economic development forecast, etc. in industry, agriculture, commerce and other economies It has a wide range of applications in environmental, social and military fields.
Optimization model: Planning model (goal programming, linear programming, nonlinear programming, integer programming, dynamic programming), graph theory model, queuing theory model, neural network model, modern optimization algorithm (Genetic algorithm, simulated annealing algorithm, ant colony algorithm, tabu search algorithm) and so on. Application areas: The shortest path problem for couriers to deliver express delivery, water resource scheduling optimization problem, highway
intersection toll station problem, military operation avoidance reconnaissance timing and route selection, logistics location problem, Commercial area layout planning and other fields.
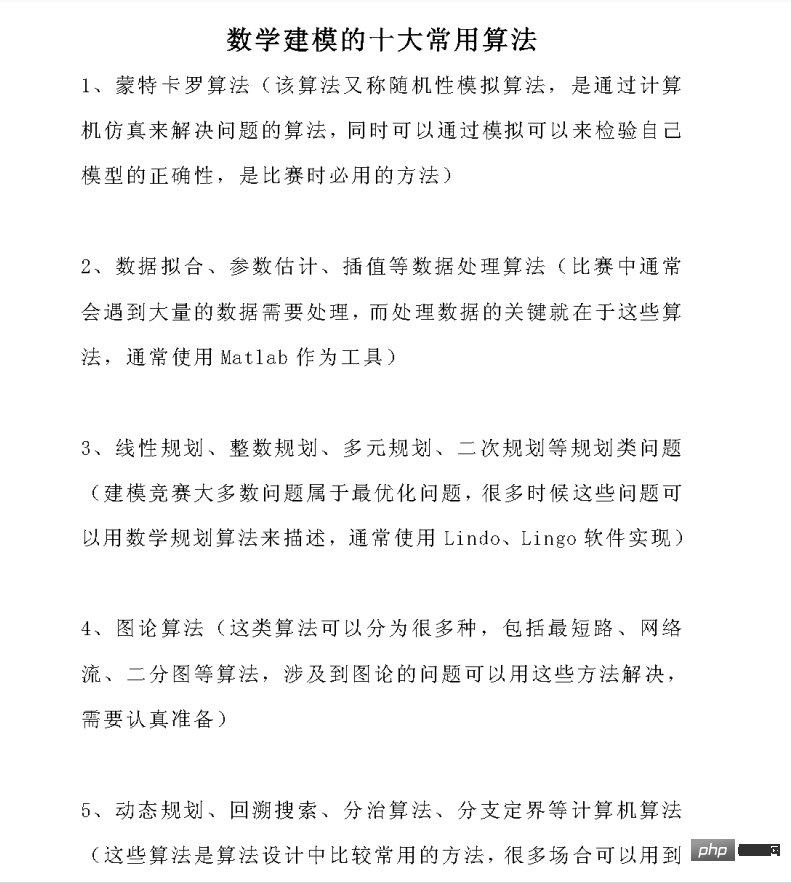
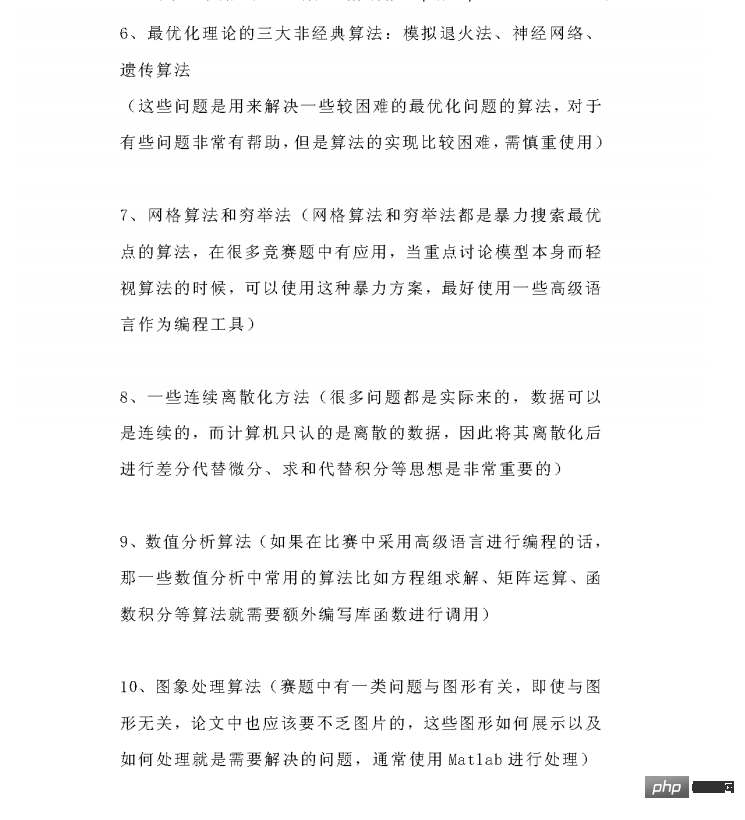
Evaluation model: Fuzzy comprehensive evaluation method, analytic hierarchy process, cluster analysis method, principal component analysis evaluation method,
Gray comprehensive evaluation method, artificial neural network evaluation method, etc. . Application fields:Regional water resources assessment, water conservancy project risk assessment, urban development level assessment, football coach assessment, basketball team assessment, water ecological assessment, dam safety assessment, slope stability assessment
An open source Python class library: used for data analysis, data processing, and data visualization
High performance
Easy-to-use data structure
·Easy-to-use analysis tool
It is very convenient to use with other libraries:
numpy: used for scientific computing
scikit-learn: used for machine learning
'''
当使用Pandas做数据分析时,需要读取事先准备好的数据集,这是做数据分析的第一步。
Pandas提供了多种读取数据的方法:
read_csv()      用于读取文本文件
read_excel()    用于读取文本文件
read_json()     用于读取json文件
read_sql_query()读取sql语句的

通用流程:
1-导入库import pandas as pd
2-找到文件所在位置(绝对路径=全称)(相对路径=和程序在同一个文件夹中的路径的简称)
3-变量名=pd.读写操作方法(文件路径,具体的筛选条件,...)
./  当前路径
../ 上一级
将csv中的数据转换为DataFrame对象是非常便捷。和一般文件读写不一样,它不需要你做打开文件、
读取文件、关闭文件等操作。相反,您只需要一行代码就可以完成上述所有步骤,并将数据存储在
DataFrame中。

'''
import pandas as pd
# 输入参数:数据输入的路径【可以是文件路径,可以是URL,也可以是实现read方法的任意对象。】
df = pd.read_csv('s')
print(df, type(df))
# Pandas默认使用utf-8读取文件
print()
import pandas as pd

lxw = open(r"t.csv", encoding='utf-8')
print(pd.read_csv(lxw))
print()
import os

# 打印当前目录
print(os.getcwd())
Related knowledge official website link
Pandas needs to read the table type data first and then analyze it
Detailed version of learning:
# 1:
import pandas as pd
df = pd.read_csv('nba.csv')
print(df)
# 2:
import pandas as pd
df = pd.read_csv('nba.csv')
# to_string() 用于返回 DataFrame 类型的数据,如果不使用该函数,则输出结果为数据的前面 5 行和末尾 5 行,中间部分以 ... 代替(如上)
print(df.to_string())
# 3:
import pandas as pd

# 三个字段 name, site, age
nme = ["Google", "Runoob", "Taobao", "Wiki"]
st = ["www.google.com", "www.runoob.com", "www.taobao.com", "www.wikipedia.org"]
ag = [90, 40, 80, 98]
# 字典
dict = {'name': nme, 'site': st, 'age': ag}
df = pd.DataFrame(dict)
# 保存 dataframe
print(df.to_csv('site.csv'))
# 4:
import pandas as pd

df = pd.read_csv('正解1.csv')
# head( n ) 方法用于读取前面的 n 行,如果不填参数 n ,默认返回 5 行
# print(df.head())
# df.head(50).to_csv('site4.csv')
df.tail(10).to_csv('site4.csv')
print("over!")
# 5:
import pandas as pd
df = pd.read_csv('nba.csv')
# 读取前面 10 行
print(df.head(10))
# 6:
import pandas as pd
df = pd.read_csv('nba.csv')
# tail( n ) 方法用于读取尾部的 n 行,如果不填参数 n ,默认返回 5 行,空行各个字段的值返回 NaN
print(df.tail())
# 7:
import pandas as pd

df = pd.read_csv('nba.csv')
#  读取末尾 10 行
print(df.tail(10))
# 8:
import pandas as pd
df = pd.read_csv('正解1.csv')
# info() 方法返回表格的一些基本信息
print(df.info())
# non-null 为非空数据,我们可以看到上面的信息中,总共 458 行,College 字段的空值最多All csv and excel files can be extracted from the resources, and those that are not available can be supplemented by yourself!
Tip: The pandas library must be installed in advance. [Terminal installation command: pip install pandas]
import pandas as pd
lxw = pd.read_csv('nba.csv')
# 查看前几行数据
print(lxw.head())
# 查看索引列
print(lxw.index)
# 查看列名列表
print(lxw.columns)
# 查看数据的形状(返回行、列数)
print(lxw.shape)
# 查看每列的数据类型
print(lxw.dtypes)
print()
# 读取txt文件,自己指定分隔符、列名
fpath = 'D:\PyCharm\数学建模大赛\数据分析-上-2\Python成绩.csv'

lxw = pd.read_csv(
    fpath,
    sep=',',
    header=None,
    names=['name', 'Python-score']
)
# print(lxw)
lxw.to_csv('Python成绩2.csv')
# 读取excel文件:
import pandas as pd
lxw = pd.read_excel('暑假培训学习计划.xls')
print(lxw)Note: If there is an error in [reading excel file] at the end, then install it in the terminal
pip install xlrd.
'''
1-Series:  一维数据,一行或一列
【Series是一种类似于一维数组的对象,它由一组数据(不同数据类型)以		    及一组与之相关的数据标签(即索引)组成】
2-DataFrame:二维数据,整个表格,多行多列
'''
import pandas as pd
# 1-1仅用数据列表即可产生最简单的Series
lxw = pd.Series([1, 'a', 5.2, 6])
print(lxw)      # 运行结果解说:左边为索引,右边为数据
# 获取索引
print(lxw.index)
# 获取数据
print(lxw.values)
print()
# 1-2 创建一个具有索引标签的Series
lxw2 = pd.Series([5, '程序人生6', 666, 5.2], index=['sz', 'gzh', 'jy', 'xy'])
print(lxw2)
print(lxw2.index)
# 写入文件当中
lxw2.to_csv('gzh.csv')
print()
# 1-3 使用过Python字典创建Series
lxw_ej = {'python': 390, 'java': 90, 'mysql': 90}
lxw3 = pd.Series(lxw_ej)
print(lxw3)
# 1-4 根据标签索引查询数据
print(lxw3['java'])
print(lxw2['gzh'])
print(lxw2[['gzh', 'jy']])
print(type(lxw2[['gzh', 'jy']]))
print(lxw[2])
print(type(lxw[2]))
print()
# 2 根据多个字典序列创建dataframe
lxw_cj = {
    'ps': [86, 92, 88, 82, 80],
    'windows操作系统': [84, 82, 88, 80, 92],
    '网页设计与制作': [92, 88, 97, 98, 83]
}
df = pd.DataFrame(lxw_cj)

# print(df)
# df.to_excel('lxw_cj.xlsx')      # 须提前安装好openxlsx,即pip install openpyxl[可在终端安装]
print("over!")
print(df.dtypes)
print(df.columns)
print(df.index)
print()
# 3-从DataFrame中查询Series
'''
·如果只查询一行、一列的话,那么返回的就是pd.Series
·如果查询多行、多列时,返回的就是pd.DataFrame

'''
# 一列:
print(df['ps'])
print(type(df['ps']))
# 多列:
print(df[['ps', 'windows操作系统']])
print(type(df[['ps', 'windows操作系统']]))

print()
# 一行:
print(df.loc[1])
print(type(df.loc[1]))
# 多行:
print(df.loc[1:3])
print(type(df.loc[1:3]))DataFrame enhancement
# DataFrame数据类型
'''
DataFrame是Pandas的重要数据结构之一,也是在使用数据分析过程中最常用的结构之一,
可以这么说,掌握了Dataframe的用法,你就 拥有了学习数据分析的基本能力。

'''
# 认识Dataframe结构:
'''
Dataframe是一个表格型的数据结构,既有行标签,又有列标签,她也被称异构数据表,所谓
异构,指的是表格中每列的数据类型可以不同,比如可以是字符串、整型或者浮点型等。

Dataframe的每一列数据都可以看成一个Series结构,只不过,Dataframe为每列数据值增加了
一个标签。因此Dataframe其实是从Series的基础上演变而来,并且他们有相同的标签,在数据分析
任务中Dataframe的应用非常广泛,因此描述数据的更为清晰、直观。

同Series一样,Dataframe自带行标签索引,默认为“隐式索引”。
当然,你也可以用“显式索引”的方式来设置行标签。

'''
# 特点:
'''
Dataframe   每一列的标签值允许使用不同的数据类型;
Dataframe   是表格型的数据结构,具有行和列;
Dataframe   中的每个数据都可以被修改
Dataframe   结构的行数、列数允许增加或者删除
Dataframe   有两个方向的标签轴,分别是行标签和列标签
Dataframe   可以对行和列执行算术运算

'''
# DataFrame 构造方法如下:

# pandas.DataFrame( data, index, columns, dtype, copy)
'''
data:输入的数据,可以是ndarray, series, list, dict, 标量以及一个Dataframe;

index:行标签,如果没有传递index值,则默认行标签是RangeIndex(0, 1, 2, ..., n)代表data的元素个数;

columns:列标签,如果没有传递columns值,则默认列标签是RangIndex(0, 1, 2, ..., n);

dtype:要强制的数据类型,只允许使用一种数据类型,如果没有,自行推断;

copy:从输入复制数据。对于dict数据, copy=True, 重新复制一份。对于Dataframe或者ndarray输入,类似于copy=False,它用的是试图。

'''
# 1: 使用普通列表创建
import pandas as pd
lxw = [5, 2, 1, 3, 1, 4]
df = pd.DataFrame(lxw)
df2 = pd.Series(lxw)
print(df)
print(df2)
print()
# 2:使用嵌套列表创建
import pandas as pd
lxw = [['lxw', 21], ['cw', 23], ['tzs', 22]]
df3 = pd.DataFrame(lxw, columns=['Name', 'Age'])
print(df3)
# 指定数值元素的数据类型为float
# 注:dtype只能设置一个,设置多个列的数据类型,需要使用其他公式
print()
# 分配列标签注意点
import pandas as pd
# 分配列标签
lxw2 = [['lxw', '男', 21, 6666], ['cw', '女', 22, 6520], ['ky', '女', 20, 5200], ['tzs', '男', 22, 6523]]
# int满足某列特征,会自动使用,不满足,则会自动识别
df = pd.DataFrame(lxw2, columns=['Name', 'xb', 'age', 'gz'], dtype=int)
print(df)
print(df['Name'].dtype)
print()
# ~字典创建:
import pandas as pd
lxw3 = [{'a': 1, 'b': 2}, {'a': 5, 'b': 8, 'c': 9}]
df = pd.DataFrame(lxw3, index=['first', 'second'])
print(df)
# 注:如果其中某些元素缺失,也就是字典的key无法找到对应的value将使用NaN代替
print()
# 使用列表嵌套字典创建一个DataFrame对象
import pandas as pd
# lxw3
df1 = pd.DataFrame(lxw3, index=['first', 'second'], columns=['a', 'b'])
df2 = pd.DataFrame(lxw3, index=['first', 'second'], columns=['a', 'b2'])
print(df1)
print("============================================")
print(df2)import pandas as pd
data = [['lxw', 10], ['wink', 12], ['程序人生6', 13]]
df = pd.DataFrame(data, columns=['Site', 'Age'], dtype=float)
print(df)
# 1:使用 ndarrays 创建
import pandas as pd
data = {'Site': ['lxw', '程序人生6', 'wink'], 'Age': [10, 12, 13]}
df = pd.DataFrame(data)
print(df)
# 2:还可以使用字典(key/value),其中字典的 key 为列名:
import pandas as pd
data = [{'a': 1, 'b': 2}, {'a': 5, 'b': 10, 'c': 20}]
df = pd.DataFrame(data)
print(df)
# 没有对应的部分数据为 NaN
# 3:Pandas 可以使用 loc 属性返回指定行的数据,如果没有设置索引,第一行索引为 0,第二行索引为 1,以此类推:
import pandas as pd
data = {
"calories": [420, 380, 390],
"duration": [50, 40, 45]
}
# 数据载入到 DataFrame 对象
df = pd.DataFrame(data)
# 返回第一行
print(df.loc[0])
# 返回第二行
print(df.loc[1])
print(df.loc[2])
# 注意:返回结果其实就是一个 Pandas Series 数据。
# 也可以返回多行数据,使用 [[ ... ]] 格式,... 为各行的索引,以逗号隔开:# Pandas Series 类似表格中的一个列(column),类似于一维数组,可以保存任何数据类型。
'''
Series 由索引(index)和列组成,函数如下:
pandas.Series( data, index, dtype, name, copy)
参数说明:
data:一组数据(ndarray 类型)。
index:数据索引标签,如果不指定,默认从 0 开始。
dtype:数据类型,默认会自己判断。
name:设置名称。
copy:拷贝数据,默认为 False。
'''
import pandas as pd
lxw = [1, 2, 3]
myvar = pd.Series(lxw)
print(myvar)
print()
# 如果没有指定索引,索引值就从 0 开始,我们可以根据索引值读取数据
print(myvar[1])
print()
import pandas as pd
lxw = ["Google", "Runoob", "Wiki"]
myvar2 = pd.Series(lxw, index=['x', 'y', 'z'])
print(myvar2)
print()
# 根据索引值读取数据:
print(myvar2['y'])
print()
# 也可以使用 key/value 对象,类似字典来创建 Series
import pandas as pd
lxw = {1: "Google", 2: "Runoob", 3: "Wiki"}
myvar3 = pd.Series(lxw)
print(myvar3)
print()
# 只需要字典中的一部分数据,只需要指定需要数据的索引即可
myvar3 = pd.Series(lxw, index=[1, 2])
print(myvar3)
print()
# 设置 Series 名称参数
import pandas as pd
lxw = {1: "Google", 2: "Runoob", 3: "Wiki"}
myvar4 = pd.Series(lxw, index=[1, 3], name="lxw-pro")
print(myvar4)# Pandas查询数据的四种方法: ''' 1-df.loc方法,根据行、列的标签值查询 2-df.iloc方法,根据行、列的数字位置查询 3-df.where方法 4-df.query方法 建议:.loc既能查询,又能覆盖写入,强烈推荐! ''' # Pandas使用df.loc查询数据的方法: ''' 1-使用单个label值查询数据 2-使用值列表批量查询 3-使用数值区间进行范围查询 4-使用条件表达式查询 5-调用函数查询 ''' # 注:以上方法,即适用于行,也使用于列 import pandas as pd df = pd.read_csv('sites.csv') # print(df.head(10)) df.set_index('create_dt', inplace=True) # print(df.index) a = df.index # 去重->转为列表->排顺序 qc = sorted(list(set(a))) # print(qc)
# 替换掉利润率当中的后缀%
df.loc[:, 'lrl'] = df['lrl'].str.replace("%", "").astype('int32') # astype() 对数据类型进行转换astype() related knowledge explanation:
'''
Python中与数据类型相关函数及属性有如下三个:type/dtype/astype
type()    返回参数的数据类型
dtype    返回数组中元素的数据类型
astype()    对数据类型进行转换
你可以使用 .astype() 方法在不同的数值类型之间相互转换。a.astype(int).dtype # 将 a 的数值类型从 float64 转换为 int
'''
here If it is run, an error will be reported:

I will search online to solve similar problems later. After some searching, I finally solved the problem
# 替换掉利润率当中的后缀%df['lrl'] = df['lrl'].map(lambda x: x.rstrip('%'))print(df)
The running results are as follows:

# 查询数据类型print(df.dtypes)# 打印文件前几行print(df.head())
2-4-1 Query data using a single label value
print(df.loc['2016-12-02', 'yye']) # 得到指定时间里相对应的的单个值
The running results are as follows: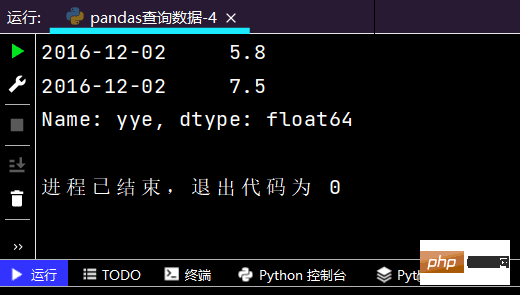
# 得到指定时间内相对应的的一个Seriesprint(df.loc['2016-11-30', ['sku_cost_prc', 'sku_sale_prc']])
The running results are as follows: 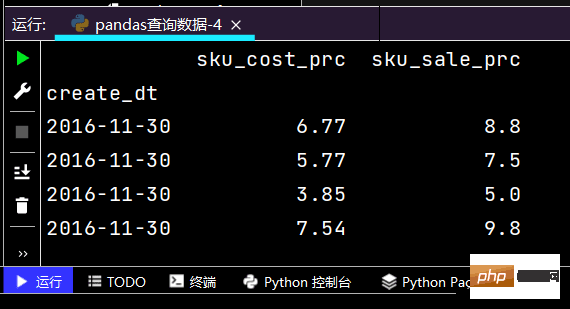
2-4-2 Use value list batch query
# 得到Seriesprint(df.loc[['2016-12-05', '2016-12-31'], 'sku_sale_prc'])
The running results are as follows:Tips: The picture is a bit long, so only part of it was intercepted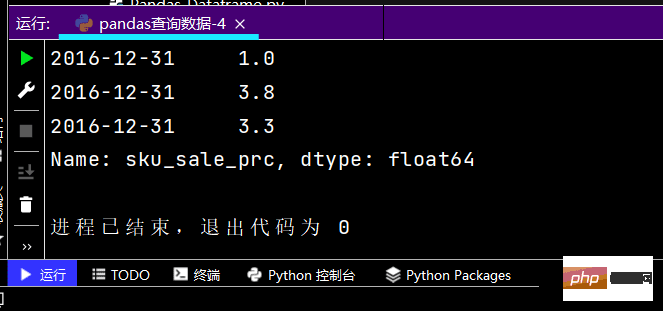
# 得到DataFrameprint(df.loc[['2016-12-08', '2016-12-12'], ['sku_cnt', 'sku_sale_prc']])
The results of running part are as follows: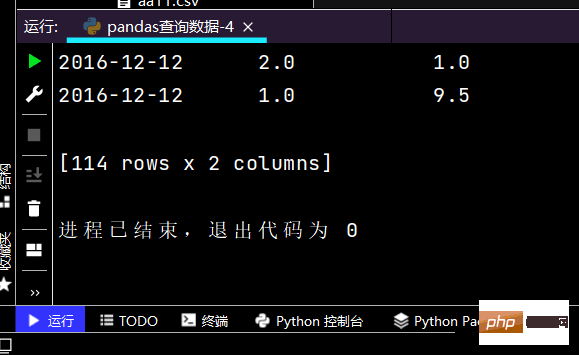
2 -4-3 Use numerical intervals for range query
# 行index按区间:print(df.loc['2016-12-02': '2016-12-08'], ['yye'])
运行部分结果如下: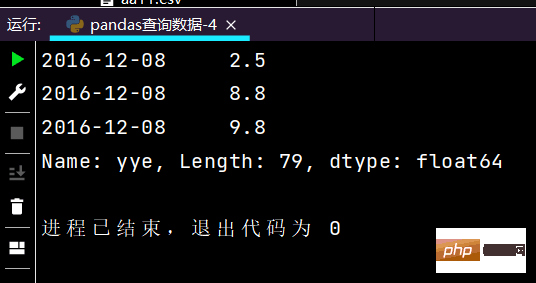
# 列index按区间:print(df.loc['2016-12-12', 'yye': 'lrl'])
运行部分结果如下: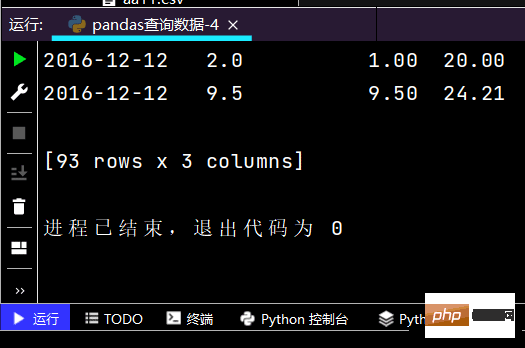
# 行和列都按区间查询:print(df.loc['2016-11-30': '2016-12-02', 'sku_cnt': 'lrl'])
运行部分结果如下:
2-4-4 使用条件表达式查询
# 简单条件查询,营业额低于3的列表print(df.loc[df['yye'] < 3, :])# 可观察营业额的boolean条件print(df['yye'] < 3)
# 复杂条件查询:print(df.loc[(df['yye'] < 5) & (df['yye'] > 2) & (df['sku_cnt'] > 1), :])
运行部分结果如下:
# 再次观察这里的boolean条件print((df['yye'] < 5) & (df['yye'] > 2) & (df['sku_cnt'] > 1))
运行部分结果如下: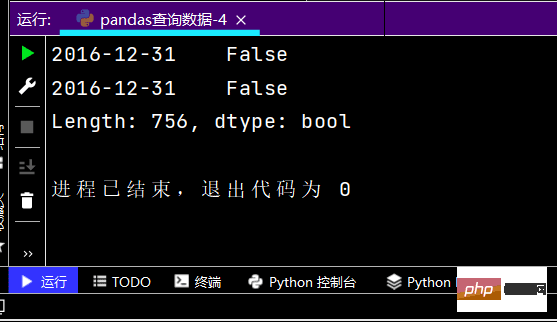
2-4-5 调用函数查询
# 直接写lambda表达式print(df.loc[lambda df: (df['yye'] < 4) & (df['yye'] > 2), :])
运行部分如果如下:
# 函数式编程的本质:# 函数本身可以像变量一样传递def my_query(df): return df.index.str.startswith('2016-12-08')print(df.loc[my_query, :])
遇到的问题:
1、虽说三大模型十大算法【简介】讲的很是明确,可在网上要查询相关模型或者算法还是很杂乱的,不是很清楚自己适合那一版本。
2、学习pandas过程当中遇到查询数据时遇【替换掉利润率当中的后缀%】 出现差错,后面通过网上查询解决问题。
The above is the detailed content of Discovery of three major Python models and top ten commonly used algorithm examples. For more information, please follow other related articles on the PHP Chinese website!


