
 Backend Development
Python Tutorial
The perfect combination of Python and Excel: summary of common operations (detailed case analysis)
Backend Development
Python Tutorial
The perfect combination of Python and Excel: summary of common operations (detailed case analysis)
The perfect combination of Python and Excel: summary of common operations (detailed case analysis)


Text
In the past, the English word corresponding to business analysis was Business Analysis, and the analysis tool everyone used was Excel. Later, the amount of data increased, and Excel could not handle it. (The maximum number of rows supported by Excel is 1,048,576 rows), people began to turn to analysis tools such as Python and R. At this time, the corresponding word for business analysis was Business Analytics.
In fact, the usage guidelines of python and Excel are the same, they are [We don't repeat ourselves], and they are to replace mechanical operations and pure manual labor with more convenient operations as much as possible.
Using Python for data analysis is inseparable from the famous pandas package. After many versions of iterative optimization, the current ecosystem of pandas is quite complete. The official website also provides a comparison between it and other analysis tools. :
This article mainly uses pandas, and the library used for drawing is plotly. The common functions of Excel implemented are:
- Python and Excel Interaction
- vlookup function
- Pivot table
- Drawing
If I discover more functions of Excel in the future, I will come back and continue to update and Replenish. Before starting, first load the pandas package as usual:
import numpy as np
import pandas as pd
pd.set_option('max_columns', 10)
pd.set_option('max_rows', 20)
pd.set_option('display.float_format', lambda x: '%.2f' % x) # 禁用科学计数法Interaction between Python and Excel
The four most commonly used functions related to Excel I/O in pandas are read_csv/ read_excel/ to_csv/ to_excel, they all have specific parameter settings to customize the desired reading and export effects.
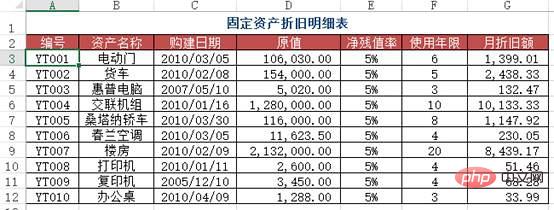
For example, if you want to read the upper left part of such a table:
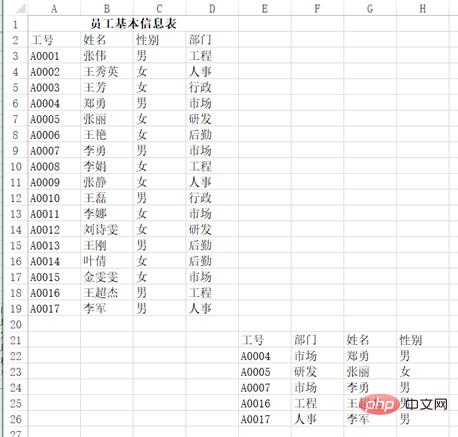
You can use pd.read_excel("test.xlsx", header=1 , nrows=17, usecols=3), return result:
df
Out[]:
工号 姓名 性别部门
0 A0001 张伟男工程
1 A0002王秀英女人事
2 A0003 王芳女行政
3 A0004 郑勇男市场
4 A0005 张丽女研发
5 A0006 王艳女后勤
6 A0007 李勇男市场
7 A0008 李娟女工程
8 A0009 张静女人事
9 A0010 王磊男行政
10A0011 李娜女市场
11A0012刘诗雯女研发
12A0013 王刚男后勤
13A0014 叶倩女后勤
14A0015金雯雯女市场
15A0016王超杰男工程
16A0017 李军男人事
The same applies to the output function. You can control how many columns to use, whether to index, and how to place the title.
vlookup function
vlookup is known as one of the artifacts in Excel and has a wide range of uses. The following examples are from Douban. The 10 most commonly used uses of the VLOOKUP function. How many do you know?
Case 1
Question: Cell area A3:B7 is a letter grade lookup table, indicating that a score below 60 is grade E, 60~69 is grade D, and 70~79 is grade C. A score of 80 to 89 is classified as Grade B, and a score of 90 or above is Grade A. D:G is listed in the Chinese language test score table for Class 1, Grade 2. How to return the letter grade based on the Chinese score?
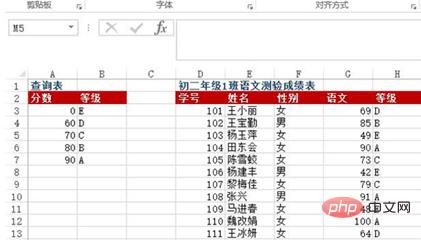
Method: Enter =VLOOKUP(G3, $A$3:$B$7, 2) in the H3:H13 cell area
Python implementation:
df = pd.read_excel("test.xlsx", sheet_name=0)
def grade_to_point(x):
 if x >= 90:
 return 'A'
 elif x >= 80:
 return 'B'
 elif x >= 70:
 return 'C'
 elif x >= 60:
 return 'D'
 else:
 return 'E'
df['等级'] = df['语文'].apply(grade_to_point)
df
Out[]:
学号 姓名 性别 语文 等级
0 101王小丽女 69D
1 102王宝勤男 85B
2 103杨玉萍女 49E
3 104田东会女 90A
4 105陈雪蛟女 73C
5 106杨建丰男 42E
6 107黎梅佳女 79C
7 108 张兴 男 91A
8 109马进春女 48E
9 110魏改娟女100A
10111王冰研女 64DCase 2
Question: How to find the monthly depreciation amount under the corresponding number in the depreciation details table in Sheet1? (Cross-table query).

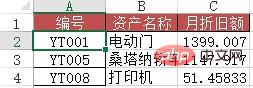
Method: Enter =VLOOKUP(A2, depreciation schedule!A$2:$G in cells C2:C4 in Sheet1 $12, 7, 0).
Python implementation: Just use merge to connect the two tables according to their numbers.
df1 = pd.read_excel("test.xlsx", sheet_name='折旧明细表')
df2 = pd.read_excel("test.xlsx", sheet_name=1) #题目里的sheet1
df2.merge(df1[['编号', '月折旧额']], how='left', on='编号')
Out[]:
 编号 资产名称月折旧额
0YT001电动门 1399
1YT005桑塔纳轿车1147
2YT008打印机51Case Three
Problem: Similar to Case Two, but this time you need to use approximate search.
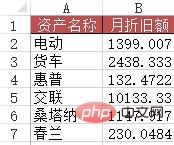
Method: Enter the formula =VLOOKUP(A2&"*", depreciation schedule!$B$2: in the B2:B7 area: $G$12, 6, 0).
Python implementation: This one is more troublesome than the previous one and requires some pandas usage skills.
df1 = pd.read_excel("test.xlsx", sheet_name='折旧明细表')
df3 = pd.read_excel("test.xlsx", sheet_name=3) #含有资产名称简写的表
df3['月折旧额'] = 0
for i in range(len(df3['资产名称'])):
 df3['月折旧额'][i] = df1[df1['资产名称'].map(lambda x:df3['资产名称'][i] in x)]['月折旧额']
df3
Out[]:
 资产名称 月折旧额
0 电动 1399
1 货车 2438
2 惠普132
3 交联10133
4桑塔纳 1147
5 春兰230Case 4
Problem: When entering data information in Excel, in order to improve work efficiency, the user hopes to automatically display the remaining information of the record by entering the keywords of the data, for example, Entering an employee's job number will automatically display the employee's name. Entering a material number will automatically display the product name, unit price, etc. of the material.
As shown in the figure is the data source table of the basic information of all employees in a certain unit. In the "Employee Leave Statistics Table for March 2010" worksheet, when the employee number is entered in column A, how to achieve the corresponding Automatic entry of employee's name, ID number, department, position, date of joining and other information? In addition, search the public account Linux to learn how to reply "git books" in the background and get a surprise gift package.
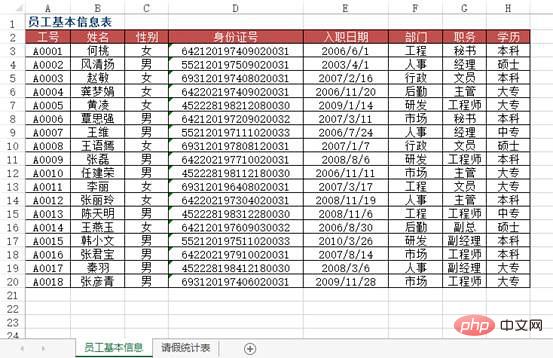
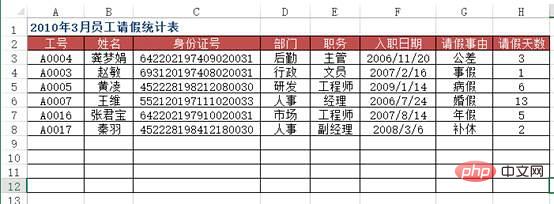
方法:使用VLOOKUP+MATCH函数,在“2010年3月员工请假统计表”工作表中选择B3:F8单元格区域,输入下列公式=IF($A3="","",VLOOKUP($A3,员工基本信息!$A:$H,MATCH(B$2,员工基本信息!$2:$2,0),0)),按下【Ctrl+Enter】组合键结束。
python实现:上面的Excel的方法用得很灵活,但是pandas的想法和操作更简单方便些。
df4 = pd.read_excel("test.xlsx", sheet_name='员工基本信息表')
df5 = pd.read_excel("test.xlsx", sheet_name='请假统计表')
df5.merge(df4[['工号', '姓名', '部门', '职务', '入职日期']], on='工号')
Out[]:
 工号 姓名部门 职务 入职日期
0A0004龚梦娟后勤 主管 2006-11-20
1A0003 赵敏行政 文员 2007-02-16
2A0005 黄凌研发工程师 2009-01-14
3A0007 王维人事 经理 2006-07-24
4A0016张君宝市场工程师 2007-08-14
5A0017 秦羽人事副经理 2008-03-06案例五
问题:用VLOOKUP函数实现批量查找,VLOOKUP函数一般情况下只能查找一个,那么多项应该怎么查找呢?如下图,如何把张一的消费额全部列出?
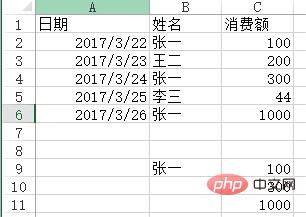
方法:在C9:C11单元格里面输入公式=VLOOKUP(B$9&ROW(A1),IF({1,0},$B$2:$B$6&COUNTIF(INDIRECT("b2:b"&ROW($2:$6)),B$9),$C$2:$C$6),2,),按SHIFT+CTRL+ENTER键结束。
python实现:vlookup函数有两个不足(或者算是特点吧),一个是被查找的值一定要在区域里的第一列,另一个是只能查找一个值,剩余的即便能匹配也不去查找了,这两点都能通过灵活应用if和indirect函数来解决,不过pandas能做得更直白一些。
df6 = pd.read_excel("test.xlsx", sheet_name='消费额')
df6[df6['姓名'] == '张一'][['姓名', '消费额']]
Out[]:
姓名 消费额
0张一 100
2张一 300
4张一1000数据透视表
数据透视表是Excel的另一个神器,本质上是一系列的表格重组整合的过程。这里用的案例来自知乎,Excel数据透视表有什么用途:(https://www.zhihu.com/question/22484899/answer/39933218 )
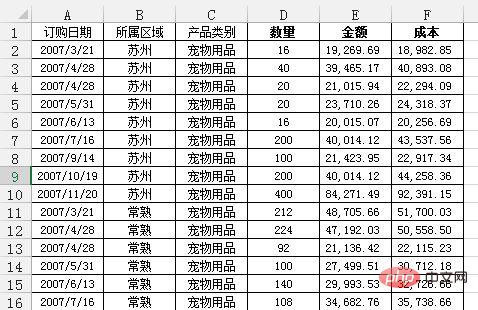
问题:需要汇总各个区域,每个月的销售额与成本总计,并同时算出利润。
通过Excel的数据透视表的操作最终实现了下面这样的效果:
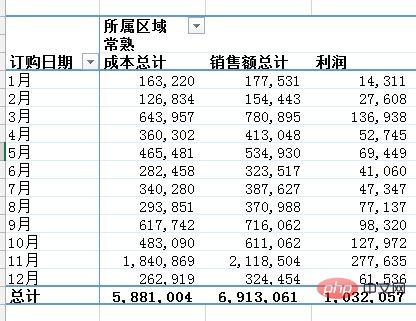
python实现:对于这样的分组的任务,首先想到的就是pandas的groupby,代码写起来也简单,思路就是把刚才Excel的点鼠标的操作反映到代码命令上:
df = pd.read_excel('test.xlsx', sheet_name='销售统计表')
df['订购月份'] = df['订购日期'].apply(lambda x:x.month)
df2 = df.groupby(['订购月份', '所属区域'])[['销售额', '成本']].agg('sum')
df2['利润'] = df2['销售额'] - df2['成本']
df2
Out[]:
销售额 成本利润
订购月份 所属区域
1南京134313.61 94967.8439345.77
常熟177531.47163220.0714311.40
无锡316418.09231822.2884595.81
昆山159183.35145403.3213780.03
苏州287253.99238812.0348441.96
2南京187129.13138530.4248598.71
常熟154442.74126834.3727608.37
无锡464012.20376134.9887877.22
昆山102324.46 86244.5216079.94
苏州105940.34 91419.5414520.80
...... ...
11 南京286329.88221687.1164642.77
常熟 2118503.54 1840868.53 277635.01
无锡633915.41536866.7797048.64
昆山351023.24342420.18 8603.06
苏州 1269351.39 1144809.83 124541.56
12 南京894522.06808959.3285562.74
常熟324454.49262918.8161535.68
无锡 1040127.19856816.72 183310.48
昆山 1096212.75951652.87 144559.87
苏州347939.30302154.2545785.05
[60 rows x 3 columns]也可以使用pandas里的pivot_table函数来实现:
df3 = pd.pivot_table(df, values=['销售额', '成本'], index=['订购月份', '所属区域'] , aggfunc='sum')
df3['利润'] = df3['销售额'] - df3['成本']
df3
Out[]:
 成本销售额利润
订购月份 所属区域
1南京 94967.84134313.6139345.77
常熟163220.07177531.4714311.40
无锡231822.28316418.0984595.81
昆山145403.32159183.3513780.03
苏州238812.03287253.9948441.96
2南京138530.42187129.1348598.71
常熟126834.37154442.7427608.37
无锡376134.98464012.2087877.22
昆山 86244.52102324.4616079.94
苏州 91419.54105940.3414520.80
...... ...
11 南京221687.11286329.8864642.77
常熟 1840868.53 2118503.54 277635.01
无锡536866.77633915.4197048.64
昆山342420.18351023.24 8603.06
苏州 1144809.83 1269351.39 124541.56
12 南京808959.32894522.0685562.74
常熟262918.81324454.4961535.68
无锡856816.72 1040127.19 183310.48
昆山951652.87 1096212.75 144559.87
苏州302154.25347939.3045785.05
[60 rows x 3 columns]
pandas的pivot_table的参数index/ columns/ values和Excel里的参数是对应上的(当然,我这话说了等于没说,数据透视表里不就是行/列/值吗还能有啥。)

但是我个人还是更喜欢用groupby,因为它运算速度非常快。我在打kaggle比赛的时候,有一张表是贷款人的行为信息,大概有2700万行,用groupby算了几个聚合函数,几秒钟就完成了。
groupby的功能很全面,内置了很多aggregate函数,能够满足大部分的基本需求,如果你需要一些其他的函数,可以搭配使用apply和lambda。
不过pandas的官方文档说了,groupby之后用apply速度非常慢,aggregate内部做过优化,所以很快,apply是没有优化的,所以建议有问题先想想别的方法,实在不行的时候再用apply。
我打比赛的时候,为了生成一个新变量,用了groupby的apply,写了这么一句:ins['weight'] = ins[['SK_ID_PREV', 'DAYS_ENTRY_PAYMENT']].groupby('SK_ID_PREV').apply(lambda x: 1-abs(x)/x.sum().abs()).iloc[:,1],1000万行的数据,足足算了十多分钟,等得我心力交瘁。
绘图
因为Excel画出来的图能够交互,能够在图上进行一些简单操作,所以这里用的python的可视化库是plotly,案例就用我这个学期发展经济学课上的作业吧,当时的图都是用Excel画的,现在用python再画一遍。开始之前,首先加载plotly包。
import plotly.offline as off
import plotly.graph_objs as go
off.init_notebook_mode()
柱状图
当时用Excel画了很多的柱状图,其中的一幅图是:
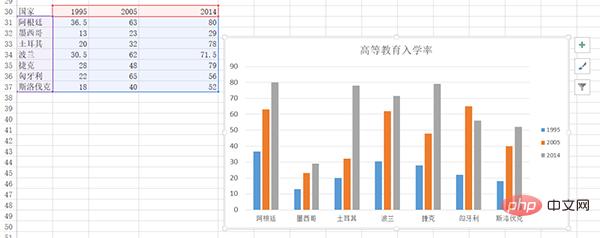
下面用plotly来画一下:
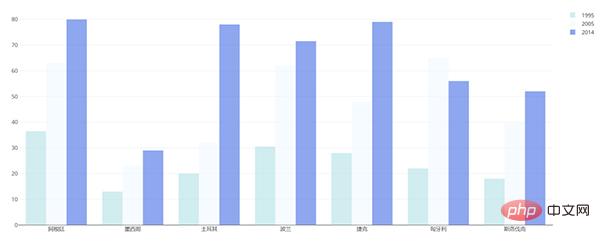
df = pd.read_excel("plot.xlsx", sheet_name='高等教育入学率')
trace1 = go.Bar(
 x=df['国家'],
 y=df[1995],
 name='1995',
 opacity=0.6,
 marker=dict(
 color='powderblue'
 )
 )
trace2 = go.Bar(
 x=df['国家'],
 y=df[2005],
 name='2005',
 opacity=0.6,
 marker=dict(
 color='aliceblue',
 )
 )
trace3 = go.Bar(
 x=df['国家'],
 y=df[2014],
 name='2014',
 opacity=0.6,
 marker=dict(
 color='royalblue'
 )
 )
layout = go.Layout(barmode='group')
data = [trace1, trace2, trace3]
fig = go.Figure(data, layout)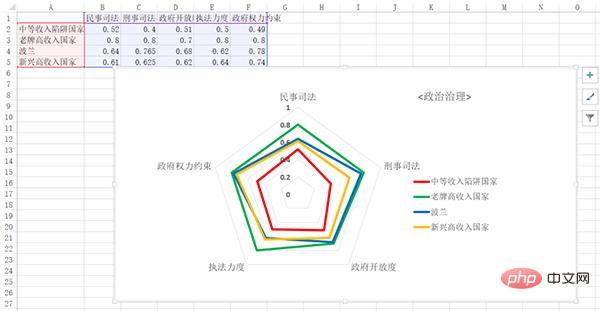
off.plot(fig)雷达图
用Excel画的:
用python画的:
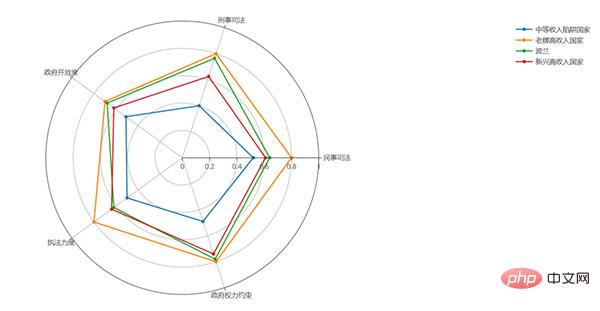
df = pd.read_excel('plot.xlsx', sheet_name='政治治理')
theta = df.columns.tolist()
theta.append(theta[0])
names = df.index
df[''] = df.iloc[:,0]
df = np.array(df)
trace1 = go.Scatterpolar(
 r=df[0],
 theta=theta,
 name=names[0]
 )
trace2 = go.Scatterpolar(
 r=df[1],
 theta=theta,
 name=names[1]
 )
trace3 = go.Scatterpolar(
 r=df[2],
 theta=theta,
 name=names[2]
 )
trace4 = go.Scatterpolar(
 r=df[3],
 theta=theta,
 name=names[3]
 )
data = [trace1, trace2, trace3, trace4]
layout = go.Layout(
 polar=dict(
 radialaxis=dict(
 visible=True,
 range=[0,1]
 )
 ),
 showlegend=True
 )
fig = go.Figure(data, layout)
off.plot(fig)画起来比Excel要麻烦得多。
总体而言,如果画简单基本的图形,用Excel是最方便的,如果要画高级一些的或者是需要更多定制化的图形,使用python更合适。
The above is the detailed content of The perfect combination of Python and Excel: summary of common operations (detailed case analysis). For more information, please follow other related articles on the PHP Chinese website!

Hot AI Tools

Undresser.AI Undress
AI-powered app for creating realistic nude photos

AI Clothes Remover
Online AI tool for removing clothes from photos.

Undress AI Tool
Undress images for free

Clothoff.io
AI clothes remover

AI Hentai Generator
Generate AI Hentai for free.

Hot Article
Hot Tools

Notepad++7.3.1
Easy-to-use and free code editor

SublimeText3 Chinese version
Chinese version, very easy to use

Zend Studio 13.0.1
Powerful PHP integrated development environment

Dreamweaver CS6
Visual web development tools

SublimeText3 Mac version
God-level code editing software (SublimeText3)
Hot Topics
 1385
1385
 52
52

 PHP and Python: Code Examples and Comparison
Apr 15, 2025 am 12:07 AM
PHP and Python: Code Examples and Comparison
Apr 15, 2025 am 12:07 AM
PHP and Python have their own advantages and disadvantages, and the choice depends on project needs and personal preferences. 1.PHP is suitable for rapid development and maintenance of large-scale web applications. 2. Python dominates the field of data science and machine learning.
 Python vs. JavaScript: Community, Libraries, and Resources
Apr 15, 2025 am 12:16 AM
Python vs. JavaScript: Community, Libraries, and Resources
Apr 15, 2025 am 12:16 AM
Python and JavaScript have their own advantages and disadvantages in terms of community, libraries and resources. 1) The Python community is friendly and suitable for beginners, but the front-end development resources are not as rich as JavaScript. 2) Python is powerful in data science and machine learning libraries, while JavaScript is better in front-end development libraries and frameworks. 3) Both have rich learning resources, but Python is suitable for starting with official documents, while JavaScript is better with MDNWebDocs. The choice should be based on project needs and personal interests.
 Detailed explanation of docker principle
Apr 14, 2025 pm 11:57 PM
Detailed explanation of docker principle
Apr 14, 2025 pm 11:57 PM
Docker uses Linux kernel features to provide an efficient and isolated application running environment. Its working principle is as follows: 1. The mirror is used as a read-only template, which contains everything you need to run the application; 2. The Union File System (UnionFS) stacks multiple file systems, only storing the differences, saving space and speeding up; 3. The daemon manages the mirrors and containers, and the client uses them for interaction; 4. Namespaces and cgroups implement container isolation and resource limitations; 5. Multiple network modes support container interconnection. Only by understanding these core concepts can you better utilize Docker.
 Python: Automation, Scripting, and Task Management
Apr 16, 2025 am 12:14 AM
Python: Automation, Scripting, and Task Management
Apr 16, 2025 am 12:14 AM
Python excels in automation, scripting, and task management. 1) Automation: File backup is realized through standard libraries such as os and shutil. 2) Script writing: Use the psutil library to monitor system resources. 3) Task management: Use the schedule library to schedule tasks. Python's ease of use and rich library support makes it the preferred tool in these areas.
 How to run programs in terminal vscode
Apr 15, 2025 pm 06:42 PM
How to run programs in terminal vscode
Apr 15, 2025 pm 06:42 PM
In VS Code, you can run the program in the terminal through the following steps: Prepare the code and open the integrated terminal to ensure that the code directory is consistent with the terminal working directory. Select the run command according to the programming language (such as Python's python your_file_name.py) to check whether it runs successfully and resolve errors. Use the debugger to improve debugging efficiency.
 What is vscode What is vscode for?
Apr 15, 2025 pm 06:45 PM
What is vscode What is vscode for?
Apr 15, 2025 pm 06:45 PM
VS Code is the full name Visual Studio Code, which is a free and open source cross-platform code editor and development environment developed by Microsoft. It supports a wide range of programming languages and provides syntax highlighting, code automatic completion, code snippets and smart prompts to improve development efficiency. Through a rich extension ecosystem, users can add extensions to specific needs and languages, such as debuggers, code formatting tools, and Git integrations. VS Code also includes an intuitive debugger that helps quickly find and resolve bugs in your code.
 Can vs code run in Windows 8
Apr 15, 2025 pm 07:24 PM
Can vs code run in Windows 8
Apr 15, 2025 pm 07:24 PM
VS Code can run on Windows 8, but the experience may not be great. First make sure the system has been updated to the latest patch, then download the VS Code installation package that matches the system architecture and install it as prompted. After installation, be aware that some extensions may be incompatible with Windows 8 and need to look for alternative extensions or use newer Windows systems in a virtual machine. Install the necessary extensions to check whether they work properly. Although VS Code is feasible on Windows 8, it is recommended to upgrade to a newer Windows system for a better development experience and security.
 Can visual studio code be used in python
Apr 15, 2025 pm 08:18 PM
Can visual studio code be used in python
Apr 15, 2025 pm 08:18 PM
VS Code can be used to write Python and provides many features that make it an ideal tool for developing Python applications. It allows users to: install Python extensions to get functions such as code completion, syntax highlighting, and debugging. Use the debugger to track code step by step, find and fix errors. Integrate Git for version control. Use code formatting tools to maintain code consistency. Use the Linting tool to spot potential problems ahead of time.
