
Heap dump: The heap dump file is a binary file that saves the usage of objects in the JVM heap at a certain moment. The HeapDump file is a snapshot of the Java stack at a specified time and is a kind of image file.
Heap dump (memory overflow) errors are generally caused by the following reasons:
1) The JVM memory is too small,
2) The program is not strict,
3) Too much garbage is generated and cannot be recycled.
After reviewing the previous OOM problem, another Java service has a memory problem this week. This time the problem is not serious. It will only trigger a high heap memory usage alarm. There is no OOM was triggered, but fortunately, the dump script was summarized in the previous review, which will automatically execute jstack and jmap when the heap usage is high, allowing us to successfully retain the problem site.
After discovering the heapdump file, I immediately copied it to the local machine and used MAT to analyze it, as follows:
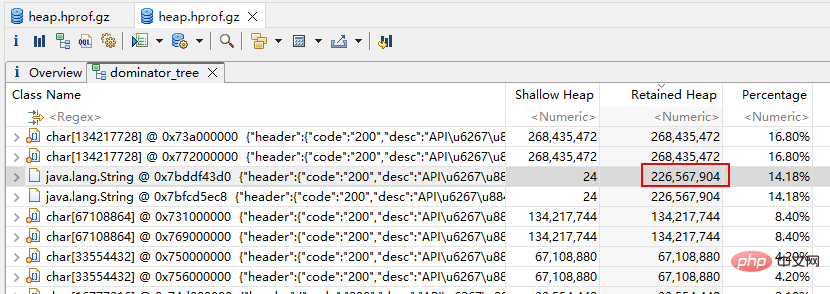
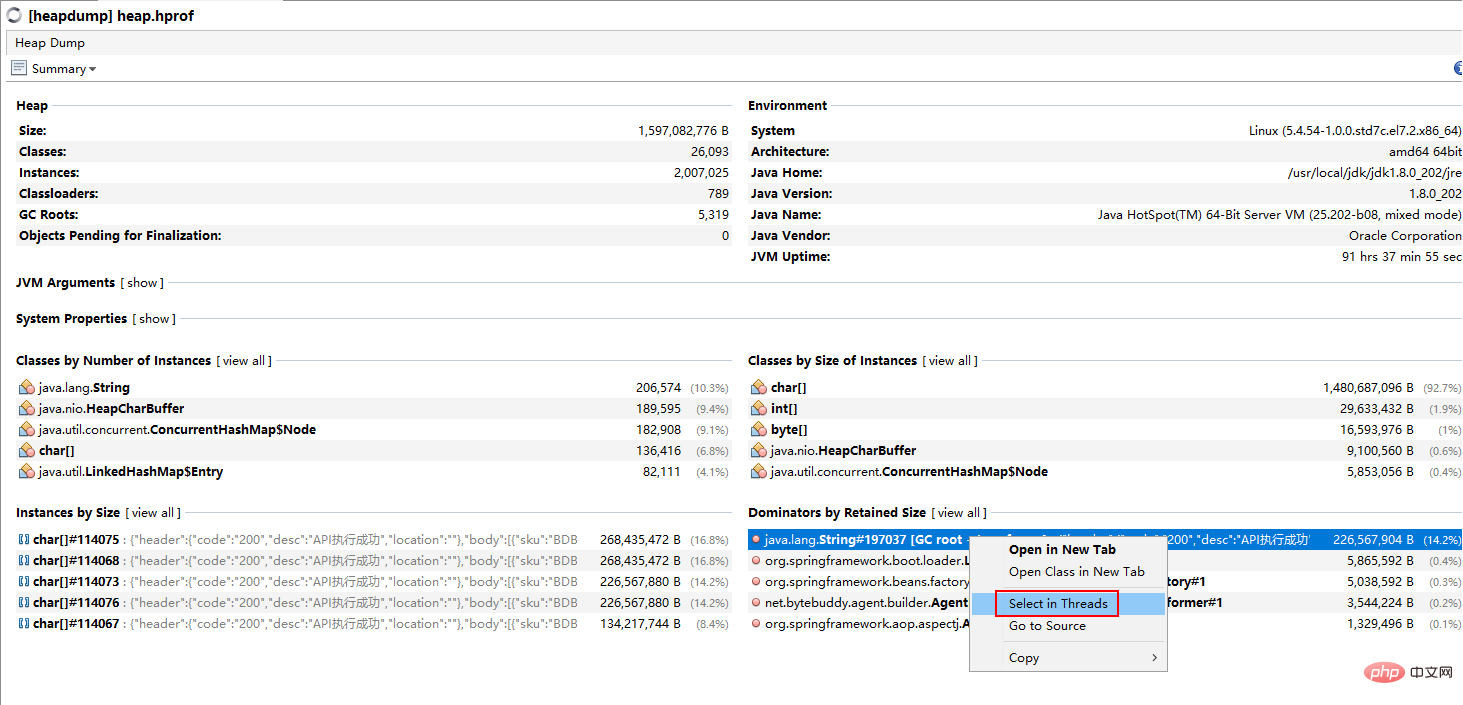
Obviously, some interface seems to have allocated a very large String object. A String object is about 200MB. So where is it allocated?
This allocation behavior must be done by a certain thread, and the thread is the most common GC Root, so you only need to find the GC Root of the object, as follows:
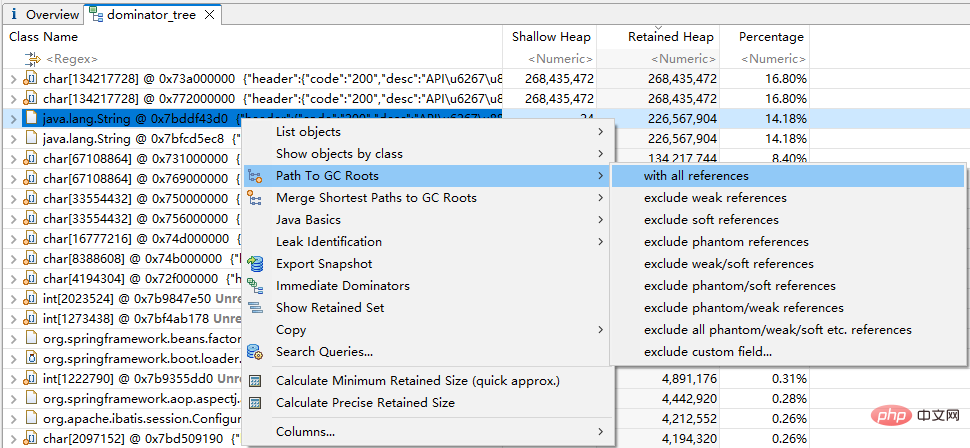
The allocation thread corresponding to the large object was found to be http-nio-8088-exec-6, as follows:

How to check what this thread is doing? After groping for a while in MAT, I couldn't find any relevant content. I recalled that jstack was recorded in our dump script. Open it and take a look, as follows:
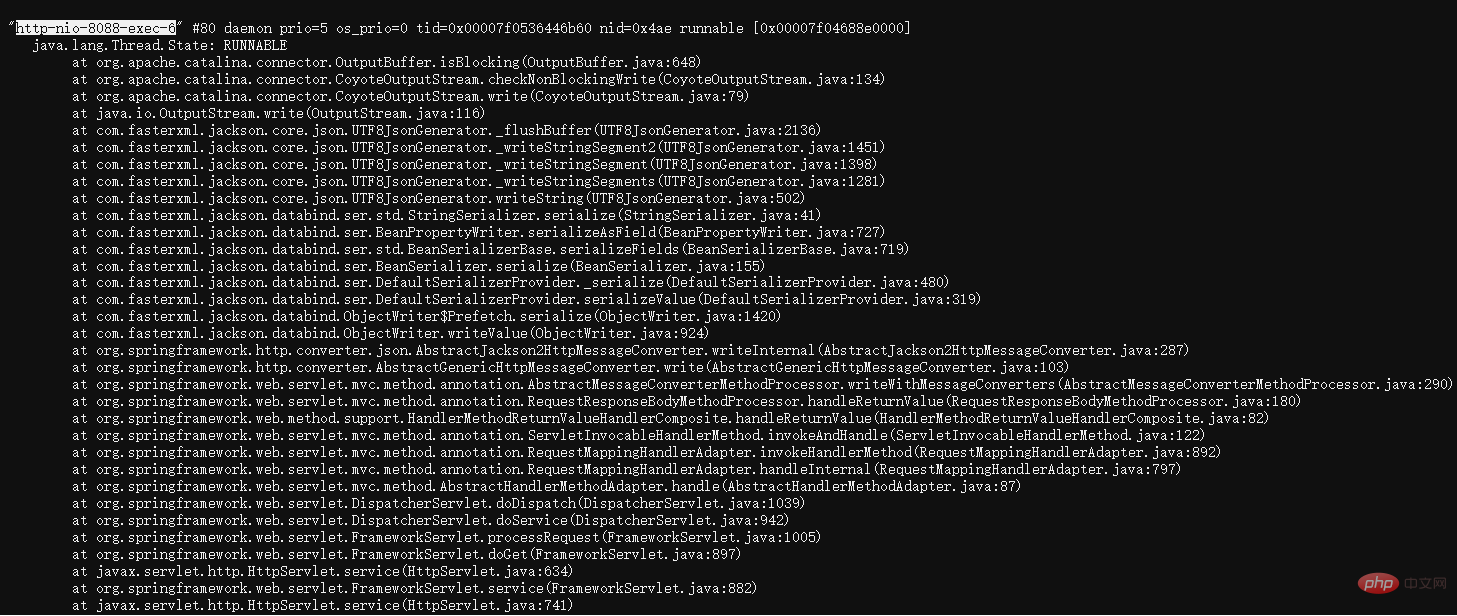
You can find that this thread I am doing json serialization, but I searched carefully for a while and couldn't find the Controller of the relevant interface. This is because the thread has finished executing the logic in the Controller and then returns the large object allocated when the interface responds to the data.
However, if there is no business code in the thread stack, it is impossible to locate which interface has the problem. . .
Considering that the interface for allocating large objects will definitely be very slow, I turned to check the accesslog log of tomcat, as follows:

Finally, I found the problem interface. This interface is used to query product data. When 3 is entered, all products starting with 3 will be queried, and there are 200,000 data. The problem is very simple to solve. Just add a limit and it is done.
However, I have always had a habit, that is, after solving a problem, I will reflect on how much luck was involved in the problem solving process.
If you often read technical articles about troubleshooting, you will find many articles in which a step suddenly locates the root cause of the problem. It may be that you suddenly find a clue, or you can figure it out by looking at the code. , or guessing that there is a problem somewhere. I think this troubleshooting process involves a lot of luck. I hope that the problem can be found step by step through years of accumulation of theoretical foundation and proficient use of diagnostic tools.
The above problem can be located through the accesslog, which has a certain amount of luck, because the memory problem this time is not extreme. If the request volume of this interface is large, multiple FGCs will be triggered instantly, which will affect other interfaces. It also slows down, making it impossible to tell which interface is causing the problem!
I think, theoretically speaking, there should be a thread stack and parameters on the thread stack in the Java heap file. Because threads are objects and parameters are also objects, they should all be in the heap, so I looked for it. During my free time, I started exploring the tool MAT again.
After groping for a while, I found a button to view thread information, as follows:

Find the thread http-nio-8088-exec-6 mentioned earlier. After expanding, you can find the thread stack and the parameters on the stack, as follows:
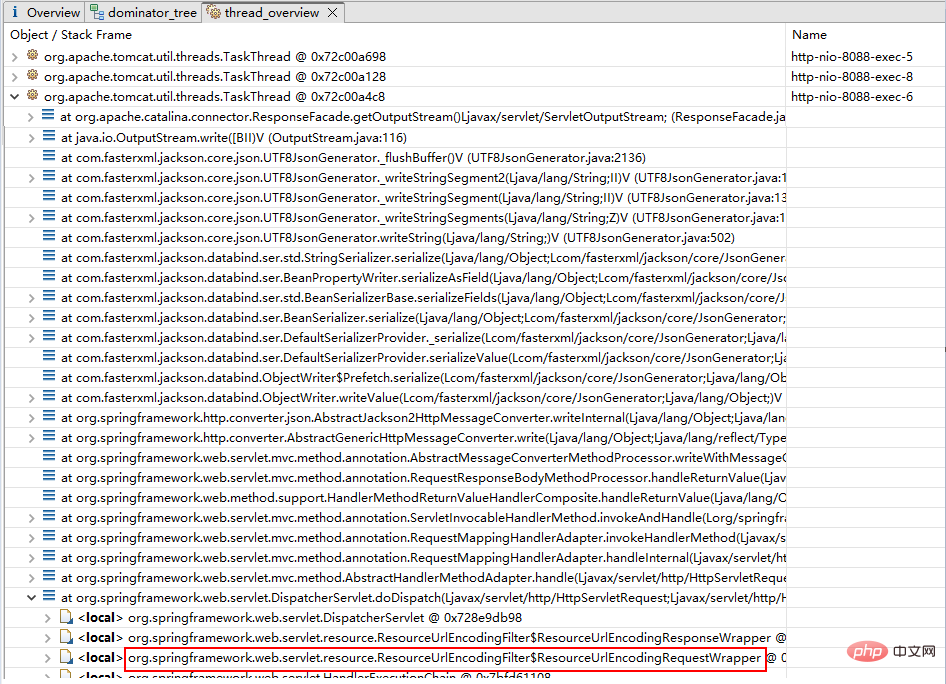
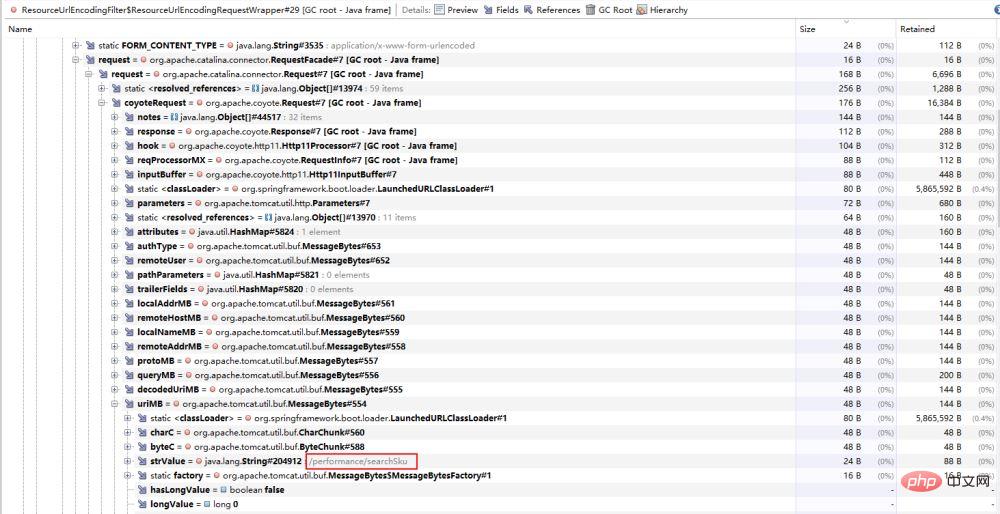
Find it now After obtaining the Request parameter object of the request, and then expanding the Request object multiple times, you can find the interface url information, as follows:
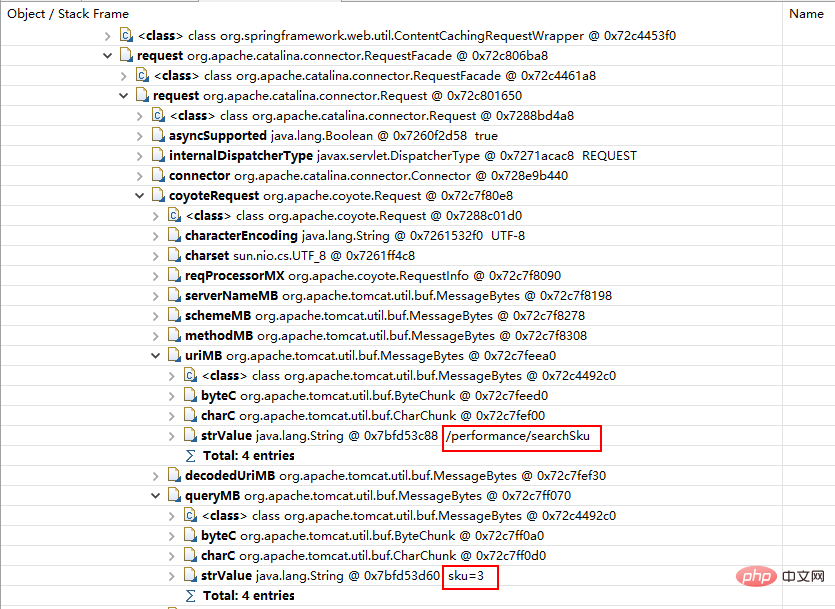
Considering that many students are accustomed to using VisualVM to analyze heapdump, here is also a tutorial on how to use VisualVM.
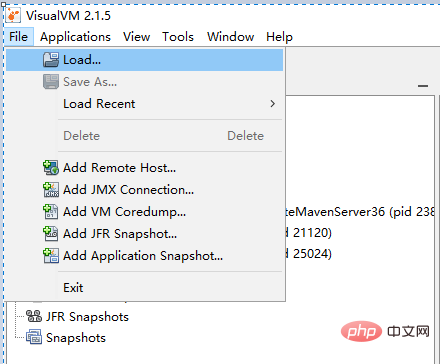
First, load the heapdump file, as follows:
Then select the corresponding object, right-click and select Select in Threads, as follows:
After locating the thread stack, find the object you want to view Request object, click to enter, as follows:
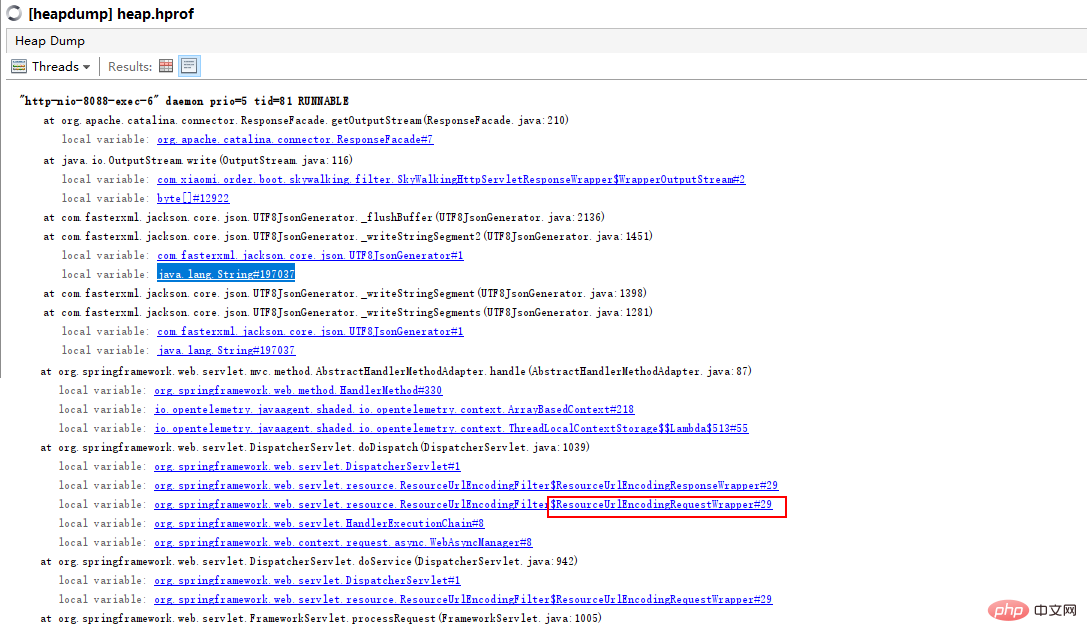
Similarly, after expanding the Request object, you can find the url information, as follows:
The above is the detailed content of How to quickly analyze the heapdump file after java obtains it. For more information, please follow other related articles on the PHP Chinese website!


