

How to draw a world population map in python

前言
数据来源:population_data.json,
先看一下数据长啥样
[
  {
    "Country Name": "Arab World",
    "Country Code": "ARB",
    "Year": "1960",
    "Value": "96388069"
  },
  {
    "Country Name": "Arab World",
    "Country Code": "ARB",
    "Year": "1961",
    "Value": "98882541.4"
  },
省略。。。。
]'''这个文件实际上就是一个很长的Python列表,其中每个元素都是一个包含四个键的字典:
国家名、国别码、年份以及表示人口数量的值。
我们只关心每个国家2010年的人口数量,因此我们首先编写一个打印这些信息的程序:'''
import json
#将数据加载到一个列表中
filename= 'population_data.json'
with open(filename) as f :
    pop_data = json.load(f)
#打印每个国家2010年的人口数量
for pop_dic in pop_data :
     if pop_dic["Year"] == '2010' :
         country_name= pop_dic['Country Name']
         population =int(float(pop_dic['Value']) )#population_data.json中的每个键和值都是字符串。为处理这些人口数据,我们需要将表示人口数量的字符串转换为数字值,为此我们使用函数int():
         print(country_name + ":" + str(population))
rab World:357868000
Caribbean small states:6880000
East Asia & Pacific (all income levels):2201536674
East Asia & Pacific (developing only):1961558757
Euro area:331766000
Europe & Central Asia (all income levels):890424544
Europe & Central Asia (developing only):405204000获取两个字母的国别码
'''制作地图前,还需要解决数据存在的最后一个问题。Pygal中的地图制作工具要求数据为特定的格式:用国别码表示国家,以及用数字表示人口数量。处理地理政治数据时,经常需要用到几个标准化国别码集。
population_data.json中包含的是三个字母的国别码,但Pygal使用两个字母的国别码。我们需要想办法根据国家名获取两个字母的国别码。
Pygal使用的国别码存储在模块i18n(internationalization的缩写)中。
字典COUNTRIES包含的键和值分别为两个字母的国别码和国家名。
要查看这些国别码,可从模块i18n中导入这个字典,并打印其键和值:'''
from pygal_maps_world.i18n import COUNTRIES
for country_code in sorted(COUNTRIES.keys()):
    print(country_code, COUNTRIES[country_code])
ad Andorra
ae United Arab Emirates
af Afghanistan
al Albania为获取国别码,我们将编写一个函数,它在COUNTRIES中查找并返回国别码。
我们将这个函数放在一个名为country_codes的模块中,以便能够在可视化程序中导入它:
from pygal_maps_world.i18n import COUNTRIES
def get_country_code(country_name):
    #根据指定的国家,返回Pygal使用的两个字母的国别码
    for code,name in COUNTRIES.items():
        if name == country_name :
            return code
    # 如果没有找到指定的国家,就返回None
    return None
#打印每个国家2010年的人口数量
for pop_dic in pop_data :
     if pop_dic["Year"] == '2010' :
         country_name= pop_dic['Country Name']
         population =int(float(pop_dic['Value']) )#population_data.json中的每个键和值都是字符串。为处理这些人口数据,我们需要将表示人口数量的字符串转换为数字值,为此我们使用函数int():
         code =  get_country_code(country_name)
         if code :
             print(code + ":" + str(population))
         else:
            print('error - ' + ":" + str(population))
error - :357868000
error - :6880000
error - :2201536674
error - :1961558757
error - :331766000导致显示错误消息的原因有两个。首先,并非所有人口数量对应的都是国家,有些人口数量对应的是地区(阿拉伯世界)和经济类群(所有收入水平)。
其次,有些统计数据使用了不同的完整国家名(如Yemen, Rep.,而不是Yemen)。当前,我们将忽略导致错误的数据,看看根据成功恢复了的数据制作出的地图是什么样的。
制作世界地图
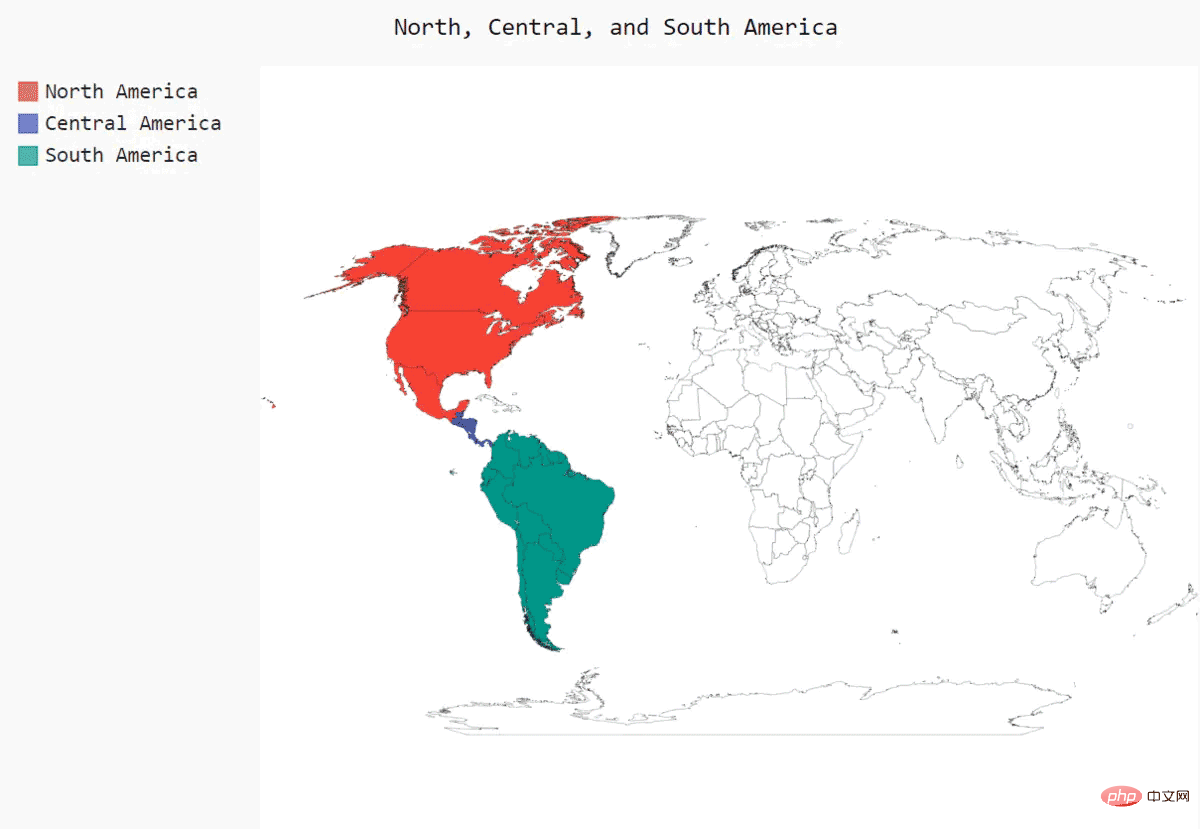
import pygal_maps_world.maps#创建了一个Worldmap实例,并设置了该地图的的title属性
wm = pygal_maps_world.maps.World()
wm.title = 'North, Central, and South America'
'''
了方法add(),它接受一个标签和一个列表,其中后者包含我们要突出的国家的国别码。每次调用add()都将为指定的国家
选择一种新颜色,并在图表左边显示该颜色和指定的标签。我们要以同一种颜色显示整个北美地区,因此第一次调用add()
时,在传递给它的列表中包含'ca'、'mx'和'us',以同时突出加拿大、墨西哥和美国。接下来,对中美和南美国家做同样
的处理。
'''
wm.add('North America', ['ca', 'mx', 'us'])
wm.add('Central America', ['bz', 'cr', 'gt', 'hn', 'ni', 'pa', 'sv'])
wm.add('South America', ['ar', 'bo', 'br', 'cl', 'co', 'ec', 'gf',
'gy', 'pe', 'py', 'sr', 'uy', 've'])
'''
方法render_to_file()创建一个包含该图表的.svg文件,你可以在浏览器中打开它。输出是一幅以不同颜色突出北美、
中美和南美的地图
'''
wm.render_to_file('americas.svg')
绘制完整的世界人口地图
'''要呈现其他国家的人口数量,需要将前面处理的数据转换为Pygal要求的字典格式:键为两个字母的国别码,值为人口数量。
为此,在world_population.py中添加如下代码:
import json
#将数据加载到一个列表中
filename= 'population_data.json'
with open(filename) as f :
    pop_data = json.load(f)
def get_country_code(country_name):
    #根据指定的国家,返回Pygal使用的两个字母的国别码
    for code,name in COUNTRIES.items():
        if name == country_name :
            return code
    # 如果没有找到指定的国家,就返回None
    return None
#创建一个包含人口数量是字典
cc_populations = {}
#打印每个国家2010年的人口数量
for pop_dic in pop_data :
     if pop_dic["Year"] == '2010' :
         country_name= pop_dic['Country Name']
         population =int(float(pop_dic['Value']) )#population_data.json中的每个键和值都是字符串。为处理这些人口数据,我们需要将表示人口数量的字符串转换为数字值,为此我们使用函数int():
         code =  get_country_code(country_name)
         if code :
            cc_populations[code] =  population
import pygal_maps_world.maps#创建了一个Worldmap实例,并设置了该地图的的title属性
wm = pygal_maps_world.maps.World()
wm.title = 'world population in 2010, by country'
wm.add('2010', cc_populations)
wm.render_to_file('world_population.svg')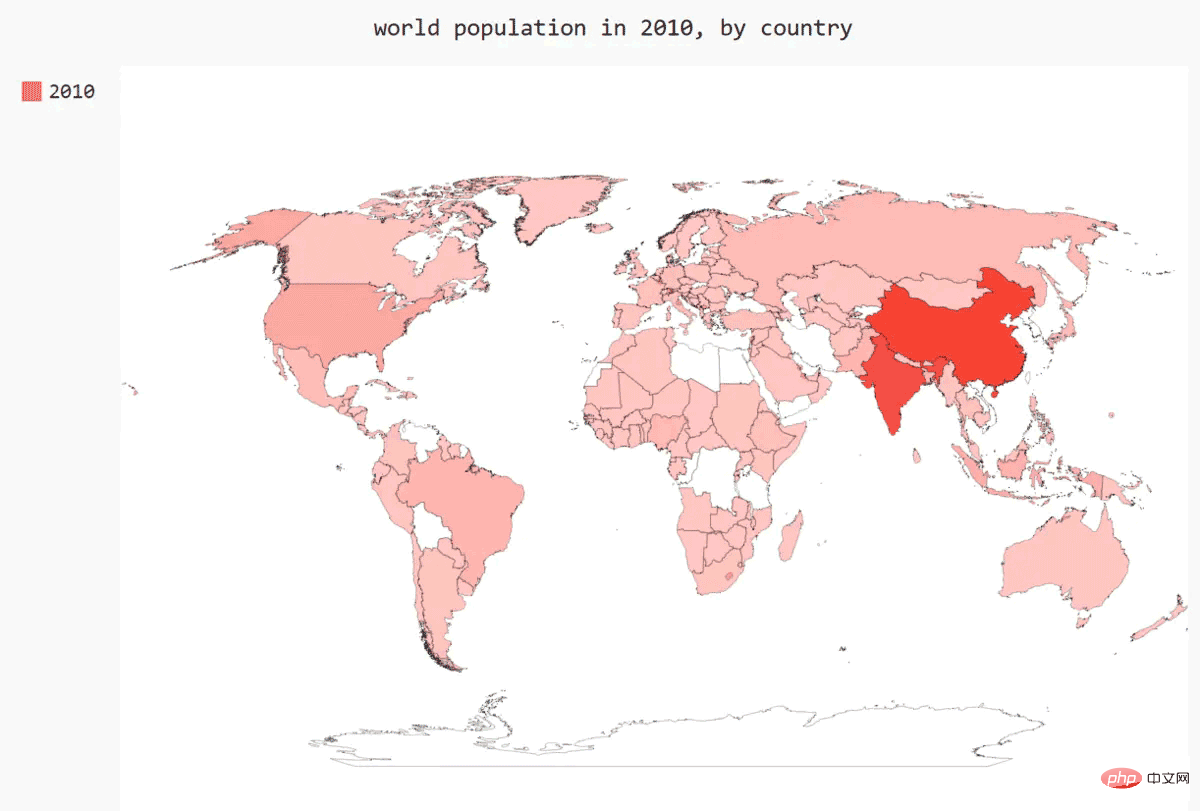
根据人口数量将国家分组
import json
#将数据加载到一个列表中
filename= 'population_data.json'
with open(filename) as f :
pop_data = json.load(f)
def get_country_code(country_name):
#根据指定的国家,返回Pygal使用的两个字母的国别码
for code,name in COUNTRIES.items():
if name == country_name :
return code
# 如果没有找到指定的国家,就返回None
return None
#创建一个包含人口数量是字典
cc_populations = {}
#打印每个国家2010年的人口数量
for pop_dic in pop_data :
if pop_dic["Year"] == '2010' :
country_name= pop_dic['Country Name']
population =int(float(pop_dic['Value']) )#population_data.json中的每个键和值都是字符串。为处理这些人口数据,我们需要将表示人口数量的字符串转换为数字值,为此我们使用函数int():
code = get_country_code(country_name)
if code :
cc_populations[code] = population
###根据人口数量将国家分3组
cc_pop_1,cc_pop_2,cc_pop_3 = {},{},{}
for cc,pop in cc_populations.items():
if pop < 10000000:
cc_pop_1[cc] = pop
elif pop < 1000000000:
cc_pop_2[cc] = pop
else:
cc_pop_3[cc] = pop
import pygal_maps_world.maps#创建了一个Worldmap实例,并设置了该地图的的title属性
wm = pygal_maps_world.maps.World()
wm.title = 'world population in 2010, by country'
wm.add('0-10m', cc_pop_1)
wm.add('10m-1bn', cc_pop_2)
wm.add('> 1bn', cc_pop_3)
wm.render_to_file('world_population.svg')
根据Pygal设置世界地图的样式
在这个地图中,根据人口将国家分组虽然很有效,但默认的颜色设置很难看。例如,在这里,Pygal选择了鲜艳的粉色和绿色基色。
下面使用Pygal样式设置指令来调整颜色。我们也让Pygal使用一种基色,但将指定该基色,并让三个分组的颜色差别更大
###根据Pygal设置世界地图的样式
'''
在这个地图中,根据人口将国家分组虽然很有效,但默认的颜色设置很难看。例如,在这里,Pygal选择了鲜艳的粉色
和绿色基色。下面使用Pygal样式设置指令来调整颜色。我们也让Pygal使用一种基色,但将指定该基色,并让三个分组
的颜色差别更大
'''
###根据人口数量将国家分组
import json
#将数据加载到一个列表中
filename= 'population_data.json'
with open(filename) as f :
pop_data = json.load(f)
def get_country_code(country_name):
#根据指定的国家,返回Pygal使用的两个字母的国别码
for code,name in COUNTRIES.items():
if name == country_name :
return code
# 如果没有找到指定的国家,就返回None
return None
#创建一个包含人口数量是字典
cc_populations = {}
#打印每个国家2010年的人口数量
for pop_dic in pop_data :
if pop_dic["Year"] == '2010' :
country_name= pop_dic['Country Name']
population =int(float(pop_dic['Value']) )#population_data.json中的每个键和值都是字符串。为处理这些人口数据,我们需要将表示人口数量的字符串转换为数字值,为此我们使用函数int():
code = get_country_code(country_name)
if code :
cc_populations[code] = population
###根据人口数量将国家分3组
cc_pop_1,cc_pop_2,cc_pop_3 = {},{},{}
for cc,pop in cc_populations.items():
if pop < 10000000:
cc_pop_1[cc] = pop
elif pop < 1000000000:
cc_pop_2[cc] = pop
else:
cc_pop_3[cc] = pop
import pygal_maps_world.maps#创建了一个Worldmap实例,并设置了该地图的的title属性
from pygal.style import RotateStyle
from pygal.style import LightColorizedStyle#加亮颜色主题
wm_style = RotateStyle('#336699', base_style= LightColorizedStyle)
wm = pygal_maps_world.maps.World(style = wm_style)
wm.title = 'world population in 2010, by country'
wm.add('2010', cc_populations)
wm.add('0-10m', cc_pop_1)
wm.add('10m-1bn', cc_pop_2)
wm.add('> 1bn', cc_pop_3)
wm.render_to_file('world_population.svg')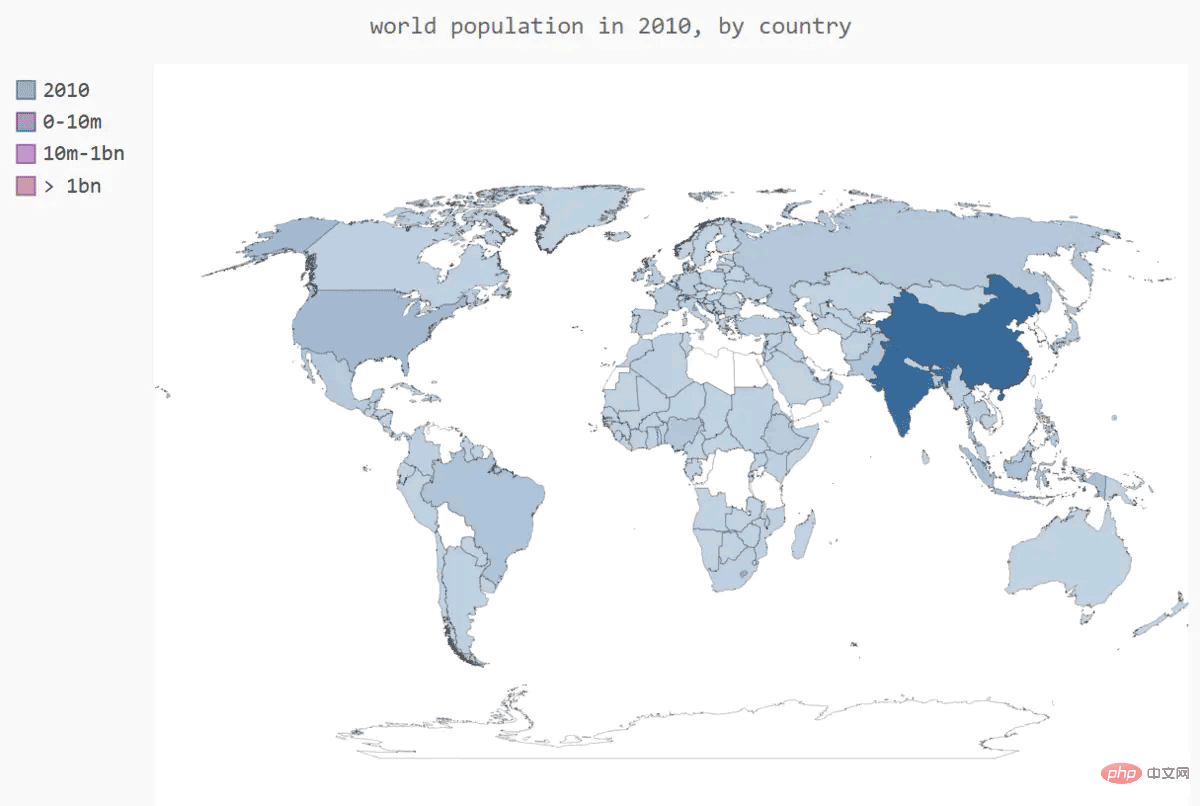
The above is the detailed content of How to draw a world population map in python. For more information, please follow other related articles on the PHP Chinese website!

Hot AI Tools

Undresser.AI Undress
AI-powered app for creating realistic nude photos

AI Clothes Remover
Online AI tool for removing clothes from photos.

Undress AI Tool
Undress images for free

Clothoff.io
AI clothes remover

AI Hentai Generator
Generate AI Hentai for free.

Hot Article
Hot Tools

Notepad++7.3.1
Easy-to-use and free code editor

SublimeText3 Chinese version
Chinese version, very easy to use

Zend Studio 13.0.1
Powerful PHP integrated development environment

Dreamweaver CS6
Visual web development tools

SublimeText3 Mac version
God-level code editing software (SublimeText3)
Hot Topics
 1378
1378
 52
52

 HadiDB: A lightweight, horizontally scalable database in Python
Apr 08, 2025 pm 06:12 PM
HadiDB: A lightweight, horizontally scalable database in Python
Apr 08, 2025 pm 06:12 PM
HadiDB: A lightweight, high-level scalable Python database HadiDB (hadidb) is a lightweight database written in Python, with a high level of scalability. Install HadiDB using pip installation: pipinstallhadidb User Management Create user: createuser() method to create a new user. The authentication() method authenticates the user's identity. fromhadidb.operationimportuseruser_obj=user("admin","admin")user_obj.
 The 2-Hour Python Plan: A Realistic Approach
Apr 11, 2025 am 12:04 AM
The 2-Hour Python Plan: A Realistic Approach
Apr 11, 2025 am 12:04 AM
You can learn basic programming concepts and skills of Python within 2 hours. 1. Learn variables and data types, 2. Master control flow (conditional statements and loops), 3. Understand the definition and use of functions, 4. Quickly get started with Python programming through simple examples and code snippets.
 Navicat's method to view MongoDB database password
Apr 08, 2025 pm 09:39 PM
Navicat's method to view MongoDB database password
Apr 08, 2025 pm 09:39 PM
It is impossible to view MongoDB password directly through Navicat because it is stored as hash values. How to retrieve lost passwords: 1. Reset passwords; 2. Check configuration files (may contain hash values); 3. Check codes (may hardcode passwords).
 Python: Exploring Its Primary Applications
Apr 10, 2025 am 09:41 AM
Python: Exploring Its Primary Applications
Apr 10, 2025 am 09:41 AM
Python is widely used in the fields of web development, data science, machine learning, automation and scripting. 1) In web development, Django and Flask frameworks simplify the development process. 2) In the fields of data science and machine learning, NumPy, Pandas, Scikit-learn and TensorFlow libraries provide strong support. 3) In terms of automation and scripting, Python is suitable for tasks such as automated testing and system management.
 How to optimize MySQL performance for high-load applications?
Apr 08, 2025 pm 06:03 PM
How to optimize MySQL performance for high-load applications?
Apr 08, 2025 pm 06:03 PM
MySQL database performance optimization guide In resource-intensive applications, MySQL database plays a crucial role and is responsible for managing massive transactions. However, as the scale of application expands, database performance bottlenecks often become a constraint. This article will explore a series of effective MySQL performance optimization strategies to ensure that your application remains efficient and responsive under high loads. We will combine actual cases to explain in-depth key technologies such as indexing, query optimization, database design and caching. 1. Database architecture design and optimized database architecture is the cornerstone of MySQL performance optimization. Here are some core principles: Selecting the right data type and selecting the smallest data type that meets the needs can not only save storage space, but also improve data processing speed.
 How to use AWS Glue crawler with Amazon Athena
Apr 09, 2025 pm 03:09 PM
How to use AWS Glue crawler with Amazon Athena
Apr 09, 2025 pm 03:09 PM
As a data professional, you need to process large amounts of data from various sources. This can pose challenges to data management and analysis. Fortunately, two AWS services can help: AWS Glue and Amazon Athena.
 How to start the server with redis
Apr 10, 2025 pm 08:12 PM
How to start the server with redis
Apr 10, 2025 pm 08:12 PM
The steps to start a Redis server include: Install Redis according to the operating system. Start the Redis service via redis-server (Linux/macOS) or redis-server.exe (Windows). Use the redis-cli ping (Linux/macOS) or redis-cli.exe ping (Windows) command to check the service status. Use a Redis client, such as redis-cli, Python, or Node.js, to access the server.
 How to read redis queue
Apr 10, 2025 pm 10:12 PM
How to read redis queue
Apr 10, 2025 pm 10:12 PM
To read a queue from Redis, you need to get the queue name, read the elements using the LPOP command, and process the empty queue. The specific steps are as follows: Get the queue name: name it with the prefix of "queue:" such as "queue:my-queue". Use the LPOP command: Eject the element from the head of the queue and return its value, such as LPOP queue:my-queue. Processing empty queues: If the queue is empty, LPOP returns nil, and you can check whether the queue exists before reading the element.
