

Will GPT replace analysts?

As a data analyst, our main responsibility is to gain insight into the business and provide effective and executable solutions.
But the reality is that data sorting, tool operating costs, coding time, etc. occupy too much of our time. On the contrary, the time we can use to think about the value of data is limited. After all, an analysis project Time is fixed, and it is often a "very urgent analysis project", you know?
Explained by the 28 principle, 80% of the time we do things that we think are very useful, but leaders and business people think that they are only 20% valuable.
Every detail in data analysis needs to be explored from the data to find out what happened in the business? Why does it happen? How long will this situation last? What is the solution I can give? How to measure value?
Let me talk about my views first:
1. Incomplete substitution
Focus on solving problems at work Analysts, their important role is to provide interpretations, opinions, and plans, rather than various data charts, models, and codes. This GPT cannot do that.
2. Complete replacement type
Analysts who make a living using tools at work, such as only using SQL, python, tableau, etc. to extract and process data , presentation, rarely do demand communication, business report discussions, and are far away from the business and leadership.
Of course some people are worried about data security, but remember that this is just the prototype of the GPT era, and it will definitely be solved in the future. This is not a problem. Let’s take a look at what GPT can do for analysts? Let’s ask GPT first
For example, ask it:
## If you are a data analysis expert in the Internet industry and I want to build an analysis system for Douyin, please help me build it and describe it in detail
10 years in the world, one second of GPTSecond: Analyzing project planning and startup can assist us in doing some projects Planning, such as division of labor, project progress, demand sequencing, etc.
For example, ask it:
##Suppose you are an excellent project manager and are now going to do an analysis project on user growth. There are three people in the team and it is required to be completed within a week. Please help me make a detailed plan for the project
Third: Help us interpret and refine some reports and data, which is often called desktop research or desk research. After all, only by reading a large number of reports and data can you better understand the industry and understand the industry. Go to the business logic and elements
This has been demonstrated before, if you are interested, you can check it out:Use GPT to help you analyze documents and crawl websites. It is said that it is also based on the Chat GPT4.0 model
Fourth: GPT can help us write commonly used programming codes, such as SQL, Python
For example, ask it:There is a user behavior table user_log. The main fields are as follows. It records all the behavior logs of users on the app, that is, who user_id performed what operation at what event_time event_id. Help me calculate the app every day. The number of visitors and the number of actions per person per day are calculated using sql and python respectively
## Do you accept it? ?
Fifth: GPT can assist and guide us in using commonly used functions in Excel, pivot tables and VBA, etc.For example Ask it:
Simulate a set of data and help me output conditional formatting, custom sorting, data validation, create drop-down menus, and find reference classes in excel. Functions, text extraction functions and other skills.

Are you scared? Will self-study and apply
Finally, we return to the topic. I believe everyone will have their own judgment. Although it cannot directly replace analysts, it has made the living space of many junior analysts more and more difficult. It is getting smaller and smaller, and the competition is getting bigger and bigger. What is even more frightening is that it will make those who use it become stronger and stronger.The above is the detailed content of Will GPT replace analysts?. For more information, please follow other related articles on the PHP Chinese website!

Hot AI Tools

Undresser.AI Undress
AI-powered app for creating realistic nude photos

AI Clothes Remover
Online AI tool for removing clothes from photos.

Undress AI Tool
Undress images for free

Clothoff.io
AI clothes remover

AI Hentai Generator
Generate AI Hentai for free.

Hot Article
Hot Tools

Notepad++7.3.1
Easy-to-use and free code editor

SublimeText3 Chinese version
Chinese version, very easy to use

Zend Studio 13.0.1
Powerful PHP integrated development environment

Dreamweaver CS6
Visual web development tools

SublimeText3 Mac version
God-level code editing software (SublimeText3)
Hot Topics
 1382
1382
 52
52

 Read CSV files and perform data analysis using pandas
Jan 09, 2024 am 09:26 AM
Read CSV files and perform data analysis using pandas
Jan 09, 2024 am 09:26 AM
Pandas is a powerful data analysis tool that can easily read and process various types of data files. Among them, CSV files are one of the most common and commonly used data file formats. This article will introduce how to use Pandas to read CSV files and perform data analysis, and provide specific code examples. 1. Import the necessary libraries First, we need to import the Pandas library and other related libraries that may be needed, as shown below: importpandasaspd 2. Read the CSV file using Pan
 Introduction to data analysis methods
Jan 08, 2024 am 10:22 AM
Introduction to data analysis methods
Jan 08, 2024 am 10:22 AM
Common data analysis methods: 1. Comparative analysis method; 2. Structural analysis method; 3. Cross analysis method; 4. Trend analysis method; 5. Cause and effect analysis method; 6. Association analysis method; 7. Cluster analysis method; 8 , Principal component analysis method; 9. Scatter analysis method; 10. Matrix analysis method. Detailed introduction: 1. Comparative analysis method: Comparative analysis of two or more data to find the differences and patterns; 2. Structural analysis method: A method of comparative analysis between each part of the whole and the whole. ; 3. Cross analysis method, etc.
 The ultimate weapon for Kubernetes debugging: K8sGPT
Feb 26, 2024 am 11:40 AM
The ultimate weapon for Kubernetes debugging: K8sGPT
Feb 26, 2024 am 11:40 AM
As artificial intelligence and machine learning technologies continue to develop, companies and organizations have begun to actively explore innovative strategies to leverage these technologies to enhance competitiveness. K8sGPT[2] is one of the most powerful tools in this field. It is a GPT model based on k8s, which combines the advantages of k8s orchestration with the excellent natural language processing capabilities of the GPT model. What is K8sGPT? Let’s look at an example first: According to the K8sGPT official website: K8sgpt is a tool designed for scanning, diagnosing and classifying kubernetes cluster problems. It integrates SRE experience into its analysis engine to provide the most relevant information. Through the application of artificial intelligence technology, K8sgpt continues to enrich its content and help users understand more quickly and accurately.
 Should I choose MBR or GPT as the hard disk format for win7?
Jan 03, 2024 pm 08:09 PM
Should I choose MBR or GPT as the hard disk format for win7?
Jan 03, 2024 pm 08:09 PM
When we use the win7 operating system, sometimes we may encounter situations where we need to reinstall the system and partition the hard disk. Regarding the issue of whether win7 hard disk format requires mbr or gpt, the editor thinks that you still have to make a choice based on the details of your own system and hardware configuration. In terms of compatibility, it is best to choose the mbr format. For more details, let’s take a look at how the editor did it~ Win7 hard disk format requires mbr or gpt1. If the system is installed with Win7, it is recommended to use MBR, which has good compatibility. 2. If it exceeds 3T or install win8, you can use GPT. 3. Although GPT is indeed more advanced than MBR, MBR is definitely invincible in terms of compatibility. GPT and MBR areas
 In-depth understanding of Win10 partition format: GPT and MBR comparison
Dec 22, 2023 am 11:58 AM
In-depth understanding of Win10 partition format: GPT and MBR comparison
Dec 22, 2023 am 11:58 AM
When partitioning their own systems, due to the different hard drives used by users, many users do not know whether the win10 partition format is gpt or mbr. For this reason, we have brought you a detailed introduction to help you understand the difference between the two. Win10 partition format gpt or mbr: Answer: If you are using a hard drive exceeding 3 TB, you can use gpt. gpt is more advanced than mbr, but mbr is still better in terms of compatibility. Of course, this can also be chosen according to the user's preferences. The difference between gpt and mbr: 1. Number of supported partitions: 1. MBR supports up to 4 primary partitions. 2. GPT is not limited by the number of partitions. 2. Supported hard drive size: 1. MBR only supports up to 2TB
 11 basic distributions that data scientists use 95% of the time
Dec 15, 2023 am 08:21 AM
11 basic distributions that data scientists use 95% of the time
Dec 15, 2023 am 08:21 AM
Following the last inventory of "11 Basic Charts Data Scientists Use 95% of the Time", today we will bring you 11 basic distributions that data scientists use 95% of the time. Mastering these distributions helps us understand the nature of the data more deeply and make more accurate inferences and predictions during data analysis and decision-making. 1. Normal Distribution Normal Distribution, also known as Gaussian Distribution, is a continuous probability distribution. It has a symmetrical bell-shaped curve with the mean (μ) as the center and the standard deviation (σ) as the width. The normal distribution has important application value in many fields such as statistics, probability theory, and engineering.
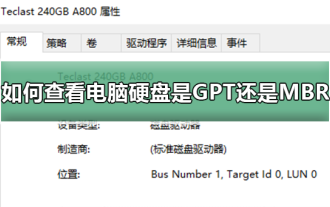 How to determine whether the computer hard drive uses GPT or MBR partitioning method
Dec 25, 2023 pm 10:57 PM
How to determine whether the computer hard drive uses GPT or MBR partitioning method
Dec 25, 2023 pm 10:57 PM
How to check whether a computer hard disk is a GPT partition or an MBR partition? When we use a computer hard disk, we need to distinguish between GPT and MBR. In fact, this checking method is very simple. Let's take a look with me. How to check whether the computer hard disk is GPT or MBR 1. Right-click 'Computer' on the desktop and click "Manage" 2. Find "Disk Management" in "Management" 3. Enter Disk Management to see the general status of our hard disk, then How to check the partition mode of my hard disk, right-click "Disk 0" and select "Properties" 4. Switch to the "Volume" tab in "Properties", then we can see the "Disk Partition Form" and you can see it as Problems related to MBR partition win10 disk How to convert MBR partition to GPT partition >
 11 Advanced Visualizations for Data Analysis and Machine Learning
Oct 25, 2023 am 08:13 AM
11 Advanced Visualizations for Data Analysis and Machine Learning
Oct 25, 2023 am 08:13 AM
Visualization is a powerful tool for communicating complex data patterns and relationships in an intuitive and understandable way. They play a vital role in data analysis, providing insights that are often difficult to discern from raw data or traditional numerical representations. Visualization is crucial for understanding complex data patterns and relationships, and we will introduce the 11 most important and must-know charts that help reveal the information in the data and make complex data more understandable and meaningful. 1. KSPlotKSPlot is used to evaluate distribution differences. The core idea is to measure the maximum distance between the cumulative distribution functions (CDF) of two distributions. The smaller the maximum distance, the more likely they belong to the same distribution. Therefore, it is mainly interpreted as a "system" for determining distribution differences.
