

NIO deep learning algorithm practice


##1. NIO Power business background
1. NIO energy service system
The goal of the NIO Power business team is to build a globally innovative smart energy service system, a power-on solution based on the mobile Internet, and an extensive network of charging and swapping facilities. Relying on NIO Cloud technology, we can build a "reliable The energy service system "rechargeable, replaceable and upgradeable" provides car owners with full-scenario power-up services.

2. Challenges in equipment operation and maintenance
NIO Power equipment operation and maintenance services mainly include NIO power swap stations, NIO super charging piles, 7KW home charging piles 2.0, 20KW home fast charging piles and other equipment; this service currently faces many challenges, mainly including:
① Ensure that the equipment has no safety hazards.
#② User complaints: Poor power-up experience.
③ The success rate of charging and swapping is reduced due to equipment failure.
#④ Downtime due to equipment failure.
#⑤ Operation and maintenance costs are high.
2. NIO Power equipment operation and maintenance solution
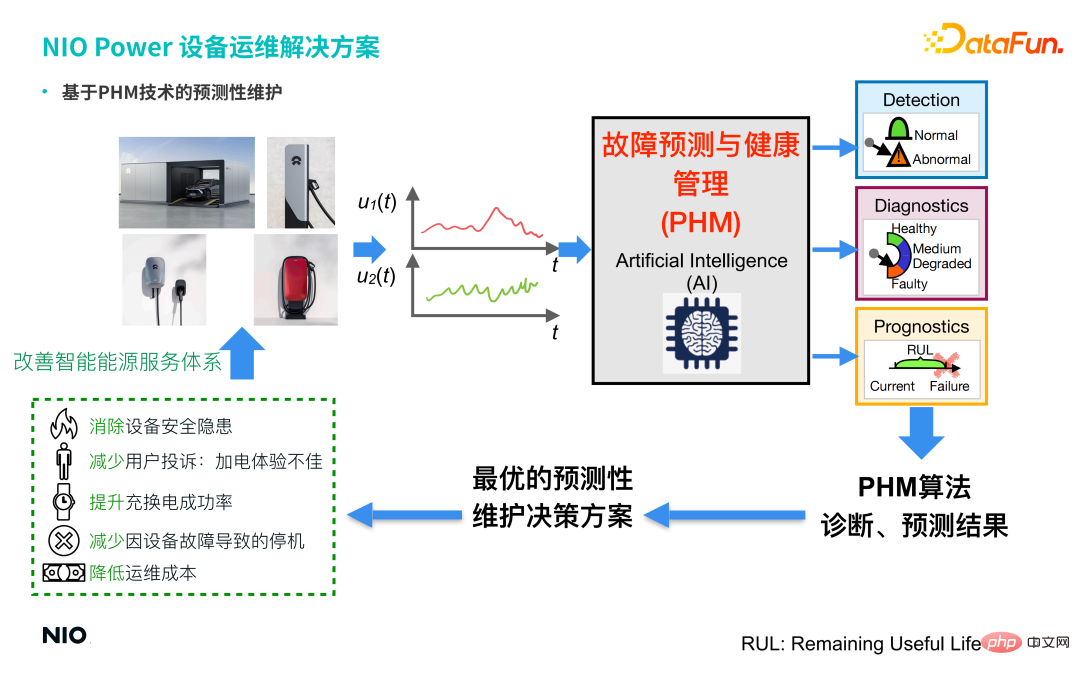
##The company's four main types of charging and discharging equipment (battery swap stations, super charging piles, 7KW home charging piles, 20KW home fast charging piles) all contain a large number of sensors, so the data collected by the sensors in real time are unified and connected to the NIO Energy Cloud Unified storage and management are carried out, and predictive maintenance technology based on PHM (Fault Prediction and Health Management) is introduced. Through a series of AI algorithms, such as GAN (Generative Adversarial Network) and Conceptor (Conceptor Network), the abnormal detection status of the equipment is obtained. and fault diagnosis, and provide the optimal predictive maintenance decision-making solution for the equipment based on the diagnosis prediction results, and issue relevant operation and maintenance work orders to achieve:
① Eliminate equipment safety hazards.
#② Reduce user complaints about poor power-on experience.
#③ Improve the success rate of charging and swapping.
#④ Reduce downtime caused by equipment failure.
#⑤ Reduce operation and maintenance costs. Therefore, the introduction of PHM technology and algorithms has effectively helped the company improve its smart energy service system and form a closed loop, thereby improving and optimizing NIO Power's service capabilities.
3. Challenges faced by PHM technologyCutting-edge PHM technologies are all based on data-driven artificial intelligence technology, and "data-driven" relies on A large number of samples and labels are used to build models, and models are often built under ideal scenarios, but real scenarios are often not ideal.
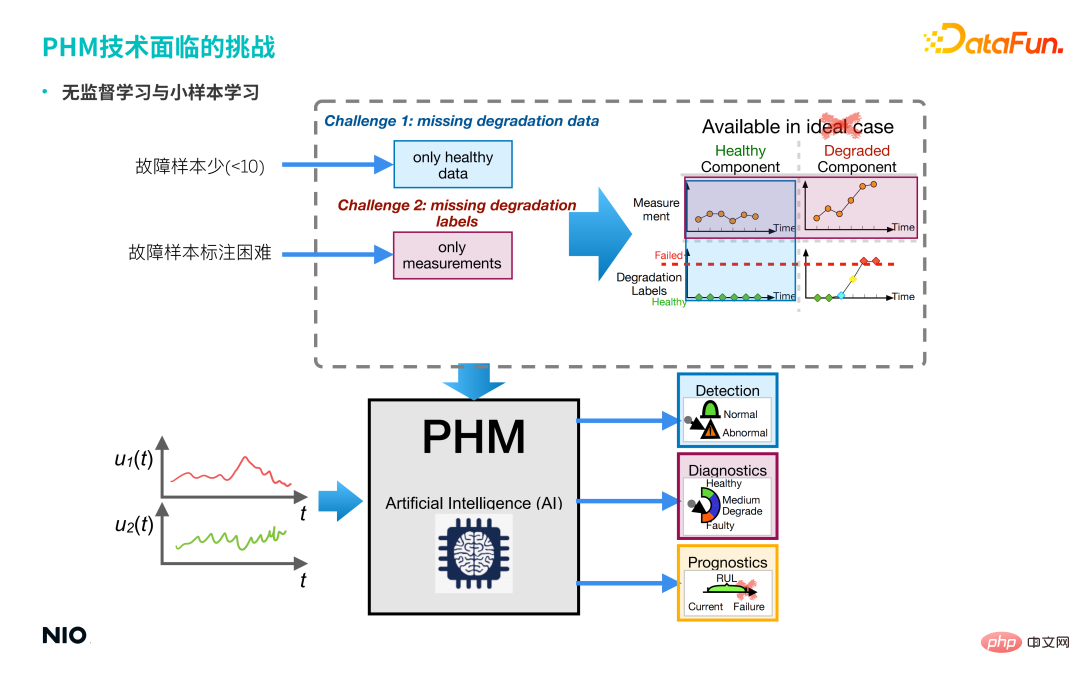
As can be seen from the above picture, real scenes often have the following characteristics:
① There are few fault samples. ② It is difficult to label fault samples. This brings about two types of problems faced in this scenario: one is unsupervised learning problems, and the other is small sample learning problems. In response to these two types of problems faced in real scenarios, we proposed the following Several cutting-edge PHM technologies are applied in NIO Power scenarios. Generative adversarial network, proposed in 2014, is a type of unsupervised learning technology based on deep learning, which is mainly composed of two sub-networks: generator and discriminator. 4. PHM cutting-edge technology
1. Unsupervised anomaly detection based on Generative Adversarial Network (GAN)
(1) GAN structure
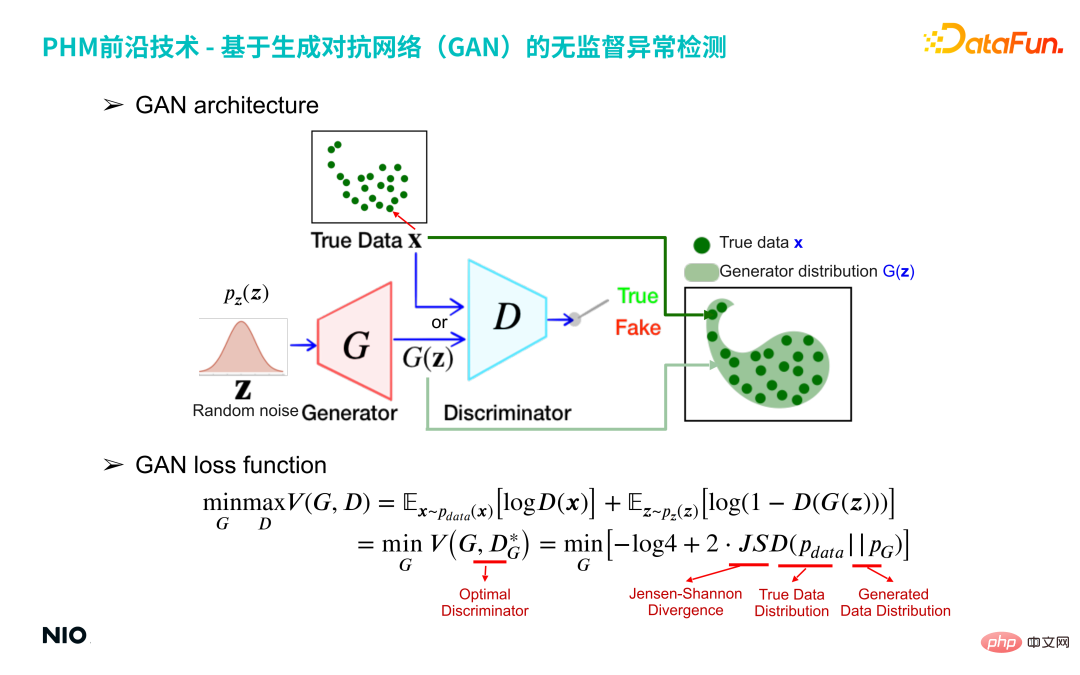
The red G network in the above picture is the generator network, and the blue D network That is the discriminator network.
Generator networkInput a random number distribution (such as Gaussian distribution) and output a specific distribution specified by the user; From the perspective of samples, 100 data sampled from a random number distribution are input to the G network. The G network will map these 100 samples into the same space as the real data to form a distribution G(z), and The discriminator network is used to obtain the difference between the two distributions G(z) and the real data X, and then the G network is optimized until the G(z) distribution is close to the real data X distribution. The G network will output these 100 data and form a specific distribution G(z).
The core of the discriminator network is to construct an approximation of the G(z) distribution and the real data x distribution Jensen-Shanon divergence, which measures the difference between the generated distribution and the true distribution. Approximate Jensen-Shanon divergence is implemented through a standard binary classification network based on binomial cross-entropy, and the discriminator network output is a continuous value from 0 to 1. If the output is 1, it is considered that the input sample X comes from the real distribution; if the output is 0, the input sample X is considered to be fake and fake.
In the training form of the GAN network, the samples generated by the generator try to be close to the distribution of real samples, while the discriminator tries to distinguish the generated samples as fake , which provides the generator with a more accurate gradient of the Jensen-Shanon divergence value, allowing the generator to iterate in a better direction. In the end, the two forms a confrontational relationship. The generator "desperately" generates false data, and the discriminator "desperately" distinguishes between true and false input data. The GAN network will eventually reach an equilibrium state: the generated data distribution G(z) just completely covers the distribution of all real samples X.
(2) GAN loss function
Understanding the GAN network from a mathematical perspective can be understood from the loss function. The loss function can use the value function V(G, D) to simultaneously optimize the parameters of the G network and the D network through common minmax optimization; for a given G network, the optimization goal is to minimize the value function, as shown in the following formula:
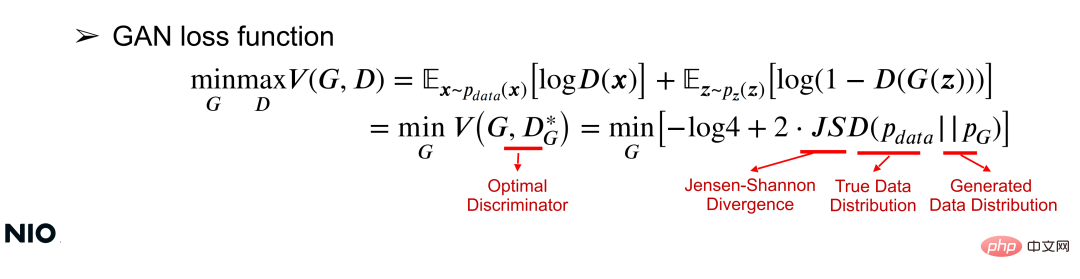
In the formula, JSD is the core optimization term of the loss function, which is the difference between the two distributions. A measure of difference. As can be seen from the formula, the essence of this optimization is to minimize the distribution difference between X and G(z); the smaller the distribution difference, the more successfully the G network is trained.
(3) Auto-Encoder aided GAN for Anomaly Detection (AE-GAN)
Based on GAN network, Introduce Auto-Encoder to realize anomaly detection of equipment operating data.
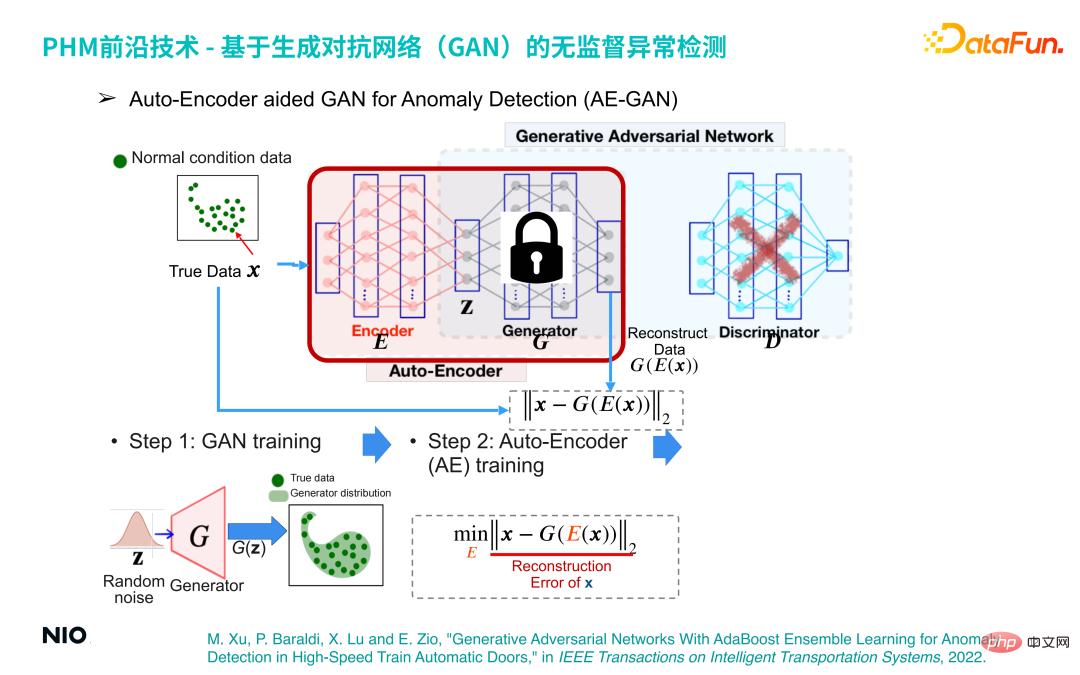
The specific implementation method is:
The first step , build a GAN model and train to obtain a G network, which just reconstructs the distribution of equipment operating data.
The second step is to discard the D network part in the GAN network, fix the G network parameters and introduce the Encoder network before the G network; in this way, the Encoder network and G The network combination forms a set of standard Auto-Encoder networks, and the loss function of this network is the reconstruction error.
In this way, we can complete anomaly detection by optimizing the Auto-Encoder network. The principle behind it is: regardless of the input sample, through the Auto-Encoder network The output samples will be within the normal sample interval. Therefore, if the input sample is a normal sample, the generated sample and the original sample are in the same interval, so the reconstruction error will be very small or even close to 0; and if the input sample is an abnormal sample, the generated sample is still within the normal sample interval. This will lead to a large reconstruction error; therefore, the reconstruction error can be used to determine whether the sample is normal.
The third step is to obtain a series of reconstruction error scores through a small batch of normal samples, and use its maximum value as the reconstruction error threshold for anomaly detection .
ThisThis principle has been fully discussed in the paper, which was published in IEEE in Transactions on Intelligent Transportation Systems in 2022 , the paper information is as follows:
M. Xu, P. Baraldi, X. Lu and E. Zio, "Generative Adversarial Networks With AdaBoost Ensemble Learning for Anomaly Detection in High-Speed Train Automatic Doors," IEEE in Transactions on Intelligent Transportation Systems, 2022.
##2. Small sample fault diagnosis based on unsupervised RNN (Conceptor)
The second type of technology we use is a small sample fault diagnosis technology of unsupervised RNN (named Conceptor Network: Conceptor).
(1) Unsupervised RNN
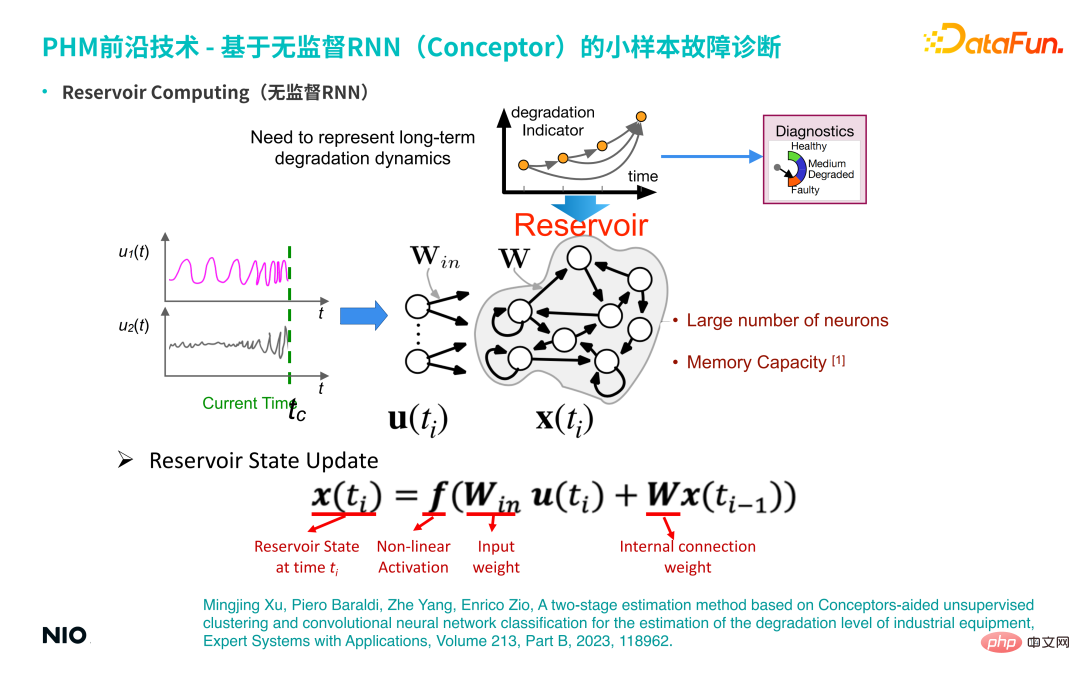
##firstFirst introduce the background of this technology-unsupervised RNN. Compared with ordinary RNN, the most special thing about unsupervised RNN is that the connection weights of the neurons in the input layer of the network and the connection weights of the hidden layers are randomly initialized and are fixed during the entire training and inference process. This means that we do not need to train the weight parameters of the input layer and hidden layer; therefore, compared with ordinary RNN networks, we can set the hidden layer neurons to be very large, so that the memory period and memory capacity of the network will be If it is very large, the memory period for the input time series will be longer. The hidden layer neurons of this special unsupervised RNN are often called Reservoir.
① Reservoir State UpdateThe state update method is the same as the standard RNN update method.
② Long-term temporal dependencies representation by Conceptor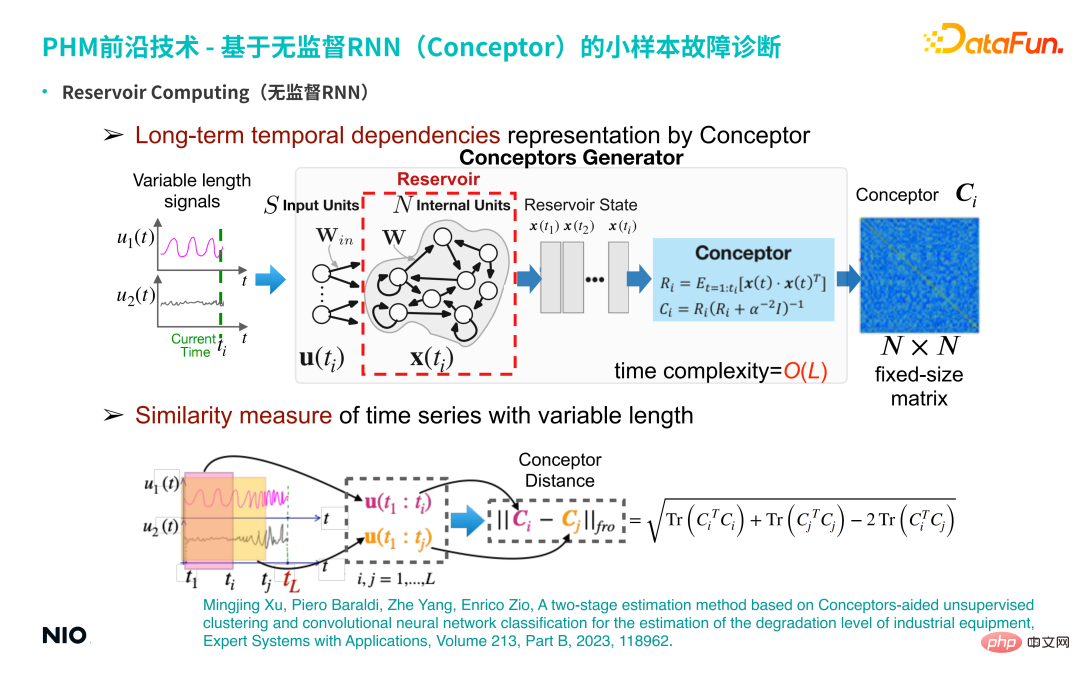
Develop an unsupervised representation learning method based on this unsupervised RNN. Specifically, input a multi-dimensional time series of variable length, and obtain the RNN hidden neurons of each time step through Reservoir. Status; use the Conceptor method (shown in the light blue box in the above figure) to obtain an N×N dimension concept matrix. Understood in terms of linear algebra, the meaning of this matrix is: when processing time series, for each time step, the time series signal is projected into an N-dimensional space (N corresponds to the scale of the hidden neuron).
If there is ti ## time steps, then these ti points in the N-dimensional space form a point cloud; such points The cloud ellipsoid can be decomposed into N mutually orthogonal directions, and the eigenvectors and eigenvalues in each direction are obtained.
The function of Conceptor is to capture eigenvalues and eigenvectors, and normalize eigenvalues; for these N eigenvectors, it can be understood as The N properties captured in the time series (such as periodicity, trend, volatility and other complex time series characteristics) are the extraction of implicit features; and all extracted feature information is retained in this N-dimensional matrix Middle (that is, the Conceptor matrix, the dark blue box on the right side of the above figure).
③ Similarity measure of time series with variable length
According to the basic characteristics of the matrix, the two time series The Conceptor matrix is subtracted and the Frobenius norm is extracted, that is, the Conceptor distance of the two time series is obtained; this scalar can be used to characterize the difference between the two time series.
(2) Small sample fault diagnosis based on Conceptor
Based on the above characteristics of Conceptor, it can be used for small sample fault diagnosis Sample troubleshooting analysis.
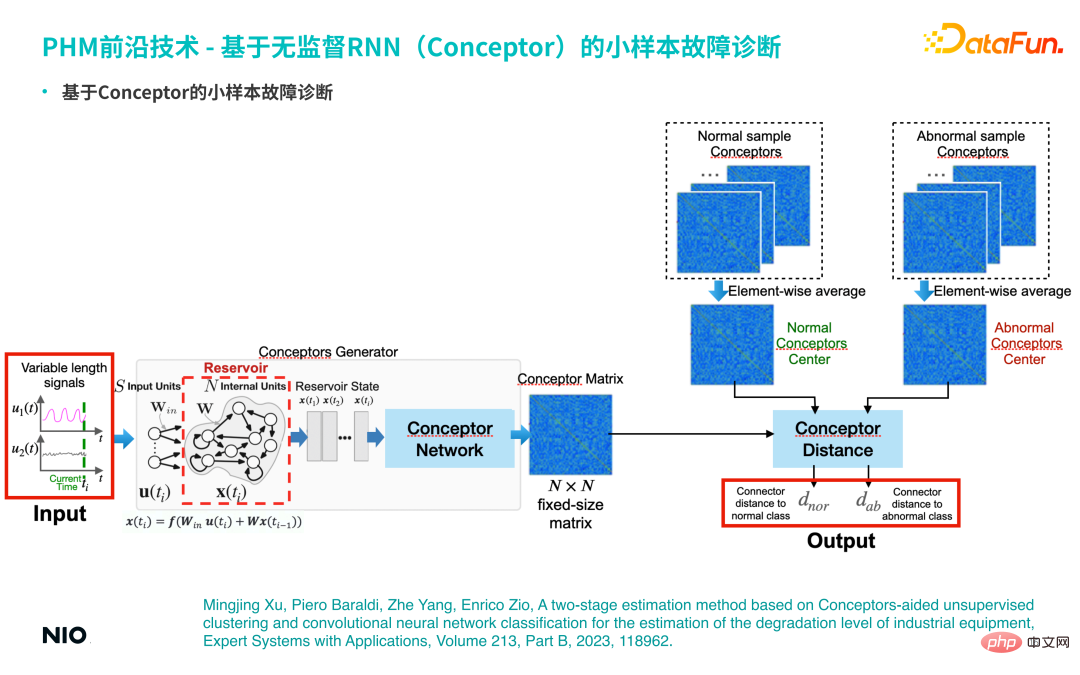
If there are a small number of actual fault samples (for example, there are less than 10 fault samples), the corresponding time series All are input into the Conceptor network and aggregated to form a corresponding concept matrix, which serves as an abstract representation of the fault mode of this category; similarly, normal samples will also be aggregated into a normal concept matrix. During testing, use the same method to extract the corresponding concept matrix from the input time series, and conduct comparative analysis with the concept matrices of normal samples and abnormal samples to calculate the corresponding concept differences. If the similarity between the input sample and the concept matrix of a specific failure mode is high, the sample can be considered to belong to that failure mode.
This method is also fully discussed in the following paper:
Mingjing Xu , Piero Baraldi, Zhe Yang, Enrico Zio, A two-stage estimation method based on Conceptors-aided unsupervised clustering and convolutional neural network classification for the estimation of the degradation level of industrial equipment, Expert Systems with Applications, Volume 213, Part B, 2023, 118962.
5. Application cases of intelligent operation and maintenance PHM technology
1. Loose monitoring of battery warehouse chain in battery swap station
(1) Background
The chain of the battery compartment of the battery swap station cooperates with the battery compartment elevator to lift the batteries entering the warehouse to charging warehouse for charging. If the chain is faulty, it may loosen or even break, which may cause the battery to get stuck during transportation to the charging bin and prevent it from being put into the bin. In addition, if the chain breaks, the battery will fall, causing battery damage or even fire accidents.
# Therefore, it is necessary to build a model to detect the looseness of the chain in advance, prevent the occurrence of related safety accidents in advance, and minimize the risk.
(2) Problem setting
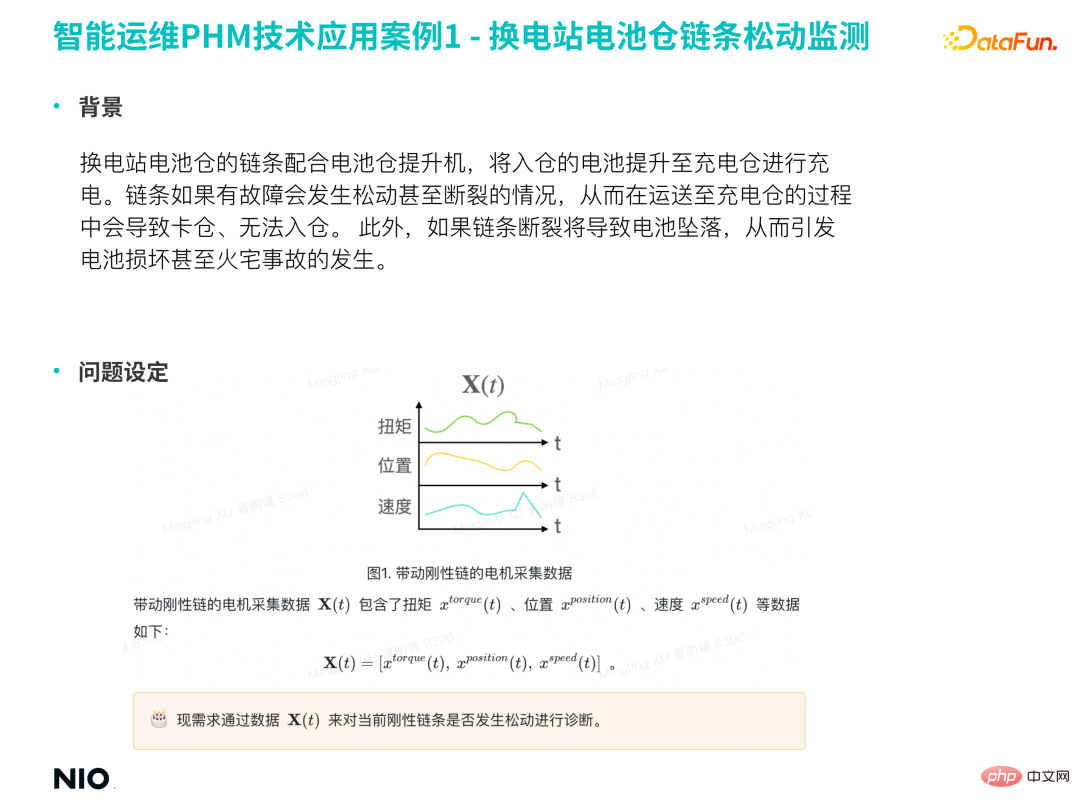
The main variables directly related to chain loosening It is a vibration-related signal. However, the collection and storage cost of vibration data is high, so most equipment does not collect vibration-related signals.
#In the case of missing vibration data, the looseness of the chain can be detected through the torque, position, speed and other signals of the chain drive motor.
(3) Industrial mechanism analysis
Compare the loose chain data and the normal chain data in the figure below, you can It is obvious that the looseness of the battery compartment chain will cause obvious periodic fluctuations in the torque signal, and the amplitude of the fluctuations will show an attenuation trend.
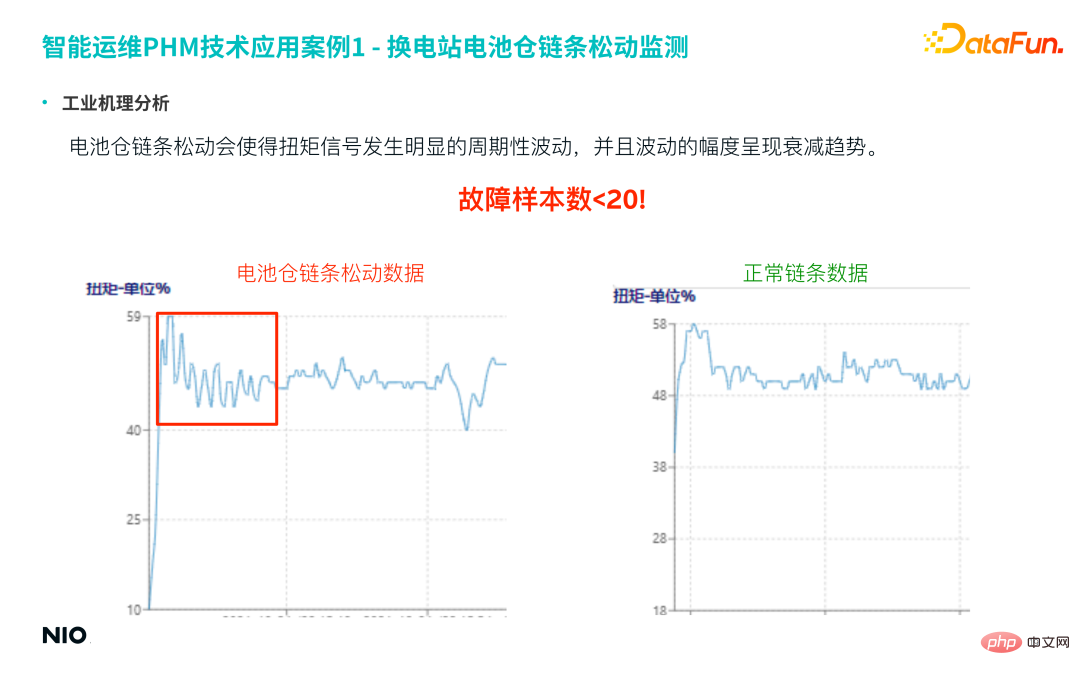
The actual number of samples for this fault is very small, less than 20 samples; however, this type of fault is of high importance , so the accuracy and recall rate of the prediction model are very high.
(4) Chain looseness detection model design
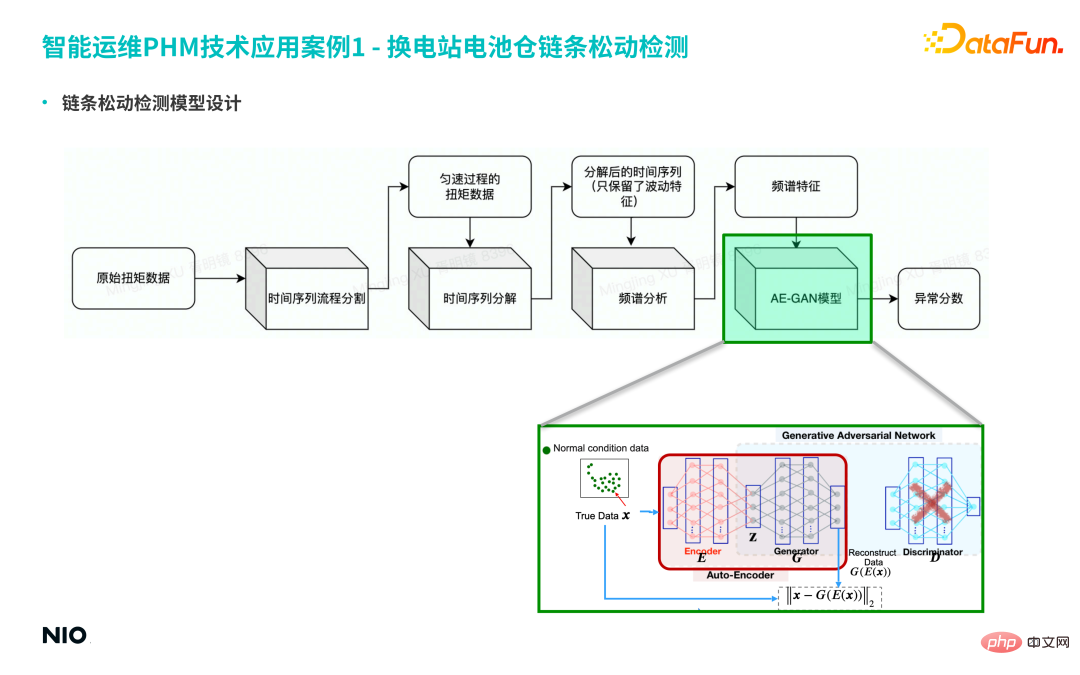
##① First, divide the original data into time series, and extract the torque data of the uniform process from the long-term series.
#② Then decompose the time series and retain only the fluctuation characteristics of the time series.
#③ Further perform spectrum analysis on the sequence, and finally obtain the spectrum characteristics.
#However, there is more than one frequency band at the moment of failure, and the amplitudes in different frequency bands obey specific distributions. Therefore, it is difficult to identify accurately using traditional methods. The lower rate will cause more false alarms and missed alarms. Therefore, the AE-GAN model is selected to more accurately capture the specific fault distribution under the fault mode, and finally obtain the equipment anomaly score.
(5) Chain looseness detection data and algorithm interaction process
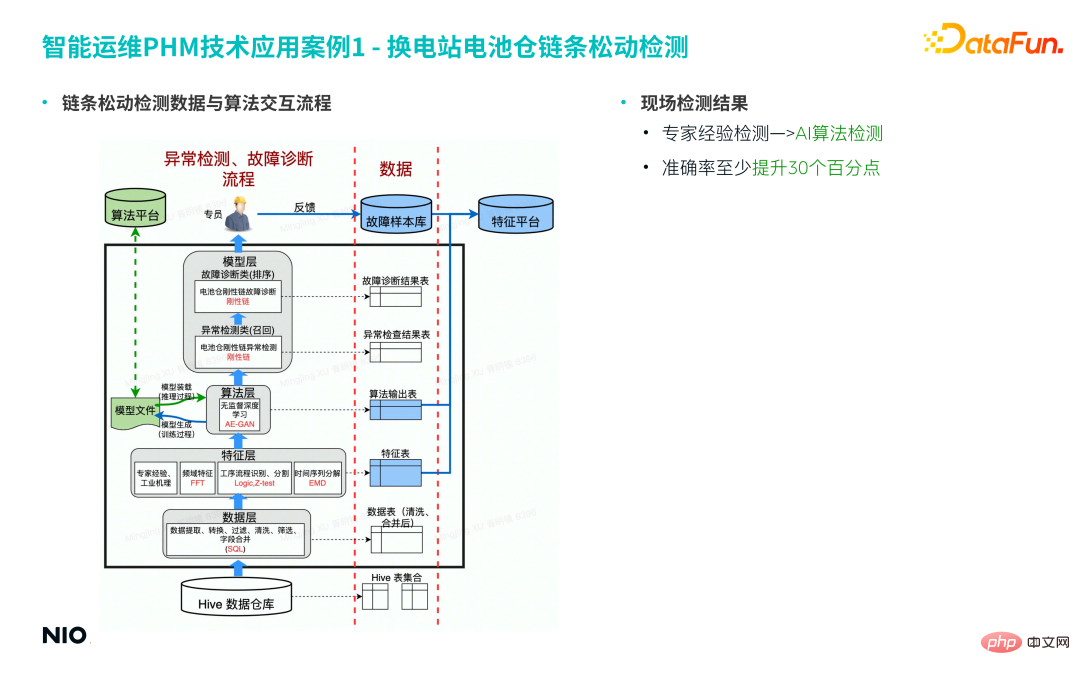
Among them, the feature layer is mainly the algorithm module involved in the feature engineering mentioned above; in this case, the algorithm layer uses the AE-GAN algorithm; based on the abnormal score results of the algorithm layer, and the feature table in the feature layer The data is recorded for further judgment and decision-making in the model layer; the final output work order is sent to the specialist for processing.
Based on the above process, traditional expert experience detection is upgraded to AI algorithm detection, and the accuracy rate is increased by more than 30%.
2. Fault diagnosis of overcharge tip deterioration(1) Industrial mechanism analysis
First establish a physical model based on the charging current, voltage, temperature and other physical signals of the charging gun to obtain the physical quantity of the temperature rise coefficient of the gun head, and use this as a characteristic signal for further fault diagnosis. However, this kind of physics-based feature engineering usually uses time sliding windows for feature generation, and finally obtains a new time series as the feature result; such feature sequences are often noisy.
#The following figure is an example. This project usually selects one week or one month of data as the time window to obtain a characteristic time series similar to the figure below. It can be seen from the figure that the noise of this sequence is very large, and it is difficult to directly distinguish between degraded samples and normal samples.
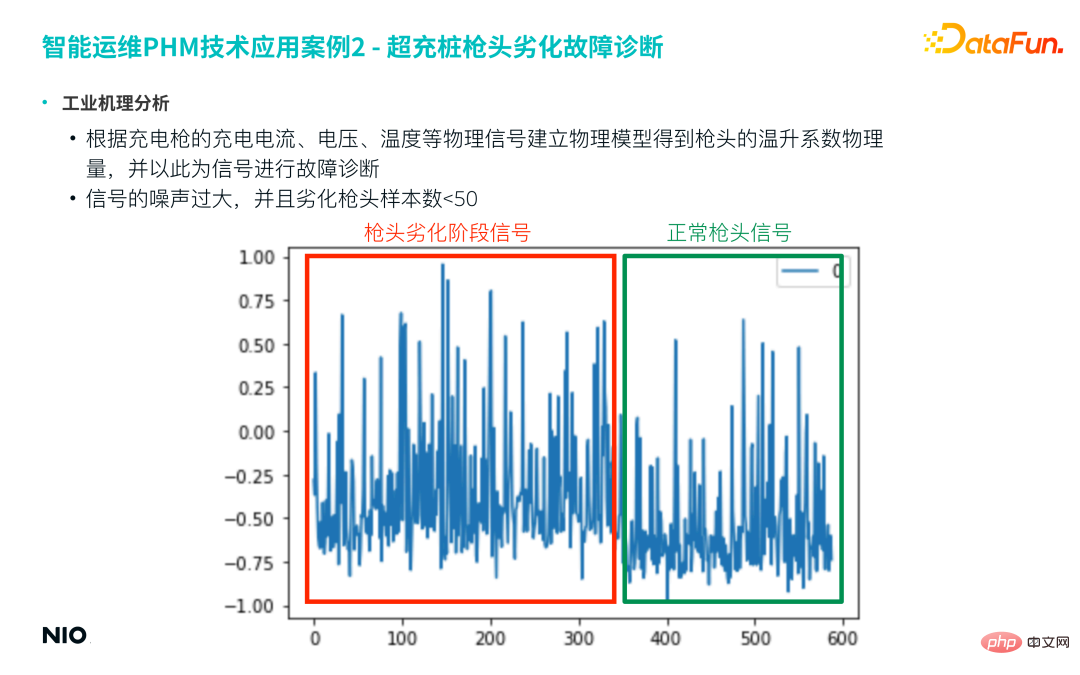
In addition, in actual failure samples, the number of degraded tips is often less than 50.
Based on the above two reasons, the Conceptor model is introduced to get rid of manual experience and automatically capture the time series characteristics of degraded samples through the model.
(2) Troubleshooting process
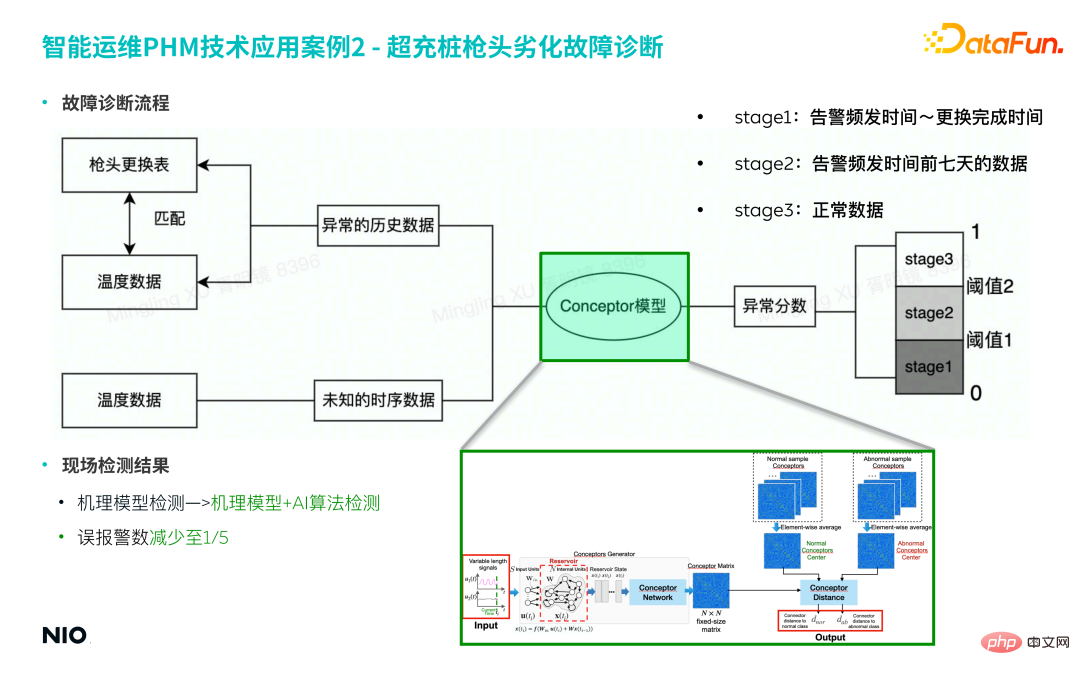
##① Collection Fault sample data
- The company has put into production thousands of overcharge piles, of which only dozens of overcharge piles have had their tips replaced.
- Match the fault sample data of the corresponding period based on the gun tip replacement record as a training set for the model.
- #Fault data contains 6-dimensional time series, and the sequence lengths are different.
② Model construction
- The physical mechanism behind this fault is relatively complex, so Modeling based on prior knowledge, expert experience and physical mechanisms is relatively difficult to implement, and the model is difficult to generalize.
- #The Conceptor model method mentioned in this article is based on a purely data-driven approach and does not introduce any prior physical information extraction features, which can greatly reduce the complexity of the model. degree to improve modeling efficiency.
- Using the Conceptor model method, the multi-dimensional time series data of the abnormal period is input into the model to obtain the corresponding concept representation matrix.
a. If 50 fault samples are input, 50 concept representation matrices will be obtained;
b. Aggregate the mean of these 50 matrices and multiply them by the center of gravity of the characterization matrix of the fault mode to obtain the characterization matrix under the fault mode;
c. In the model testing stage, the concept matrix is calculated for the input test data, and compared with the representation matrix of the failure mode to obtain the anomaly score.
③ Model warning
- 1) Based on the model results, 3 different levels are divided in advance Alarm rules are used to judge according to different degrees of deterioration, and finally achieve hierarchical early warning.
#Based on the above process, upgrading the traditional mechanism model detection method to a mechanism model combined with AI algorithm detection method can reduce the model false alarm rate to 1/5 of the original.
6. Question and Answer Session
#Q1: In the AE-GAN model, how to distinguish normal samples from abnormal samples?
A1: For the trained AE-GAN model, input a sample into Auto-Encoder to get the reconstruction error of the sample, which is the anomaly score; if the score is less than the specified If the threshold is exceeded, the sample is considered normal, otherwise it is considered an abnormal sample. The premise of using this method is that all training data are normal sample data.
Q2: When training the GAN network, do you use a mixture of small sample fault data and normal data? How to balance the two data?
A2: When training the GAN network, either normal data or abnormal data in a specific mode will be used. Mixed data will not be used for training, so there will be no Issues such as sample imbalance. If there is a huge gap between the two types of data samples in the actual data, a GAN network 1 will generally be trained for normal samples, and then a GAN network 2 will be trained for a certain fixed pattern of abnormal samples, and the test samples will be tested based on the reconstruction errors of the two networks. Final judgment.
#Q3: Will mode collapse occur during GAN training?
#A3: Mode collapse is the core problem encountered in GAN model training. First, understand mode collapse, and second, focus on the core tasks of GAN training.
Mode collapse, the data generated by the generator focuses on a specific area; when this happens The reason is that the definition of the loss function in the GAN network is ignored. During the GAN network training process, the loss of the G network and the loss of the D network are usually calculated separately, and the joint loss function of the two networks (i.e., the JSD loss in the formula) is often ignored. If training mode collapse occurs, the JSD loss often does not converge; therefore, visualizing the JSD loss during training can effectively avoid mode collapse. This is also the reason why many recent improved versions of GAN models have been able to stand out and produce better results; in addition, introducing specific tricks into standard GAN networks can also achieve similar effects.
#Q4: What are the advantages of RNN’s hidden layers being randomly fixed?
A4: For scenarios where there is a huge gap between positive and negative samples, if you use commonly used LSTM, RNN, GRNN and other models, you will often face the problem that the loss function does not converge; therefore, this type of The way to deal with the problem is often to start from unsupervised learning, randomly fix the weight of the hidden layer of the main network, and use a specific method to regularize the characteristic components of the generated concept matrix; although the weight parameter is random, the obtained representation The components can reflect the hidden characteristics of the time series and are enough to distinguish small sample scenes. The above are the advantages of the RNN hidden layer being randomly fixed.
#Q5: Introduce the network form of Conceptor model.
A5: The model is shown in the figure below.

Among them, the Reserve part is basically the same as the ordinary RNN network, the only difference is Win and W are randomly set (note that they are only randomly generated once); subsequently, each time step The hidden state of the long-term neuron is calculated and updated, and the corresponding concept matrix is obtained. The above is the complete version of Conceptor.
Q6: What is the training process of the Encoder network in AE-GAN? What are input and output?
#A6: The following figure is the training process of the Encoder network.

First, a standard GAN will be trained, and on this basis, the parameters of the hidden layer in the G network will be fixed; then in G Insert an Encoder network before the network and connect the two networks to form an Auto-Encoder network. The input of the Auto-Encoder network is the original data sample, and the output is the reconstructed data sample; the AE-GAN network identifies abnormal data by constructing reconstructed samples.
Q7: Are there papers and related open source codes for the two methods described in the article?
#A7: Please refer to the relevant chapters of the article for details. The code is not yet open source.
#Q8: Can AE-GAN be used for anomaly detection in the image field?
A8: It can be used. However, compared with ordinary signals, the image field has higher dimensions, more complex data distribution, and a larger amount of data required for training. Therefore, if it is used for image classification and there are few data samples, the model effect will be compromised; if it is used for anomaly detection, the effect is still good.
#Q9: What are the evaluation indicators for anomaly detection? False positives and false negatives, and both evaluated together.
A9: The most intuitive evaluation indicators are the false positive rate and false negative rate. More scientific indicators include recall rate, precision rate, F-score, etc.
Q10: How to match fault sample features?
A10: If there is no more direct and faster way to obtain fault characteristics, a pure data-driven method is generally used to mine fault sample features, usually by building a deep learning network. Key features of fault samples are learned and characterized as concept matrices.
#Q11: How does the PHM algorithm perform model selection?
A11: For a small number of samples, the unsupervised RNN method is generally used to represent the data characteristics; if there are a large number of normal samples for anomaly detection problems, it can be used AE-GAN network is implemented.
#Q12: How to identify anomalies through the two types of concept matrices output by RNN?
A12: The concept matrix output by RNN can be understood as the set of all features in the input time series; since the features of the data in the same state are similar, this The concept matrices of all samples in the state are averaged and aggregated, that is, the concept center matrix in this type of state is abstracted; for the input time series of the unknown state, by calculating its concept matrix and comparing it with the concept center matrix, the concept center with the highest similarity is The matrix is the category corresponding to the input data.
Q13: How to set the anomaly threshold in the AE-GAN network?
#A13: After completing network training, use a small batch of normal sample data to calculate the reconstruction error, and take the maximum value as the threshold.
Q14: Will the anomaly threshold in the AE-GAN network be updated?
A14: Generally, it will not be updated, but if the original data distribution changes (such as the operating conditions change), the threshold may need to be retrained, and the threshold may even be changed. Transfer learning related methods are introduced into the GAN network to fine-tune the threshold.
#Q15: How does GAN train time series?
A15: GAN generally does not train the original time series, but trains features extracted based on the original time series.
Q16: Compared with traditional GAN, what is the role of introducing GAN in AE-GAN? What improvements can be obtained?
#A16: Traditional GAN is also often used for anomaly detection. AE-GAN has a more in-depth analysis of the principles of GAN, so it can also avoid problems such as mode collapse to the greatest extent; and the introduction of Auto-Encoder can ensure that the principle of anomaly detection is executed accurately, thereby reducing the false alarm rate.
#Q17: Will there be an overall increase in the time series data of charging piles during holidays? How to avoid misjudgment?
#A17: The fault diagnosis model is divided into many levels. The results of the model layer are only the basis for the decision-making layer and not the final result. They are generally combined with other business logic to assist judgment.
Q18: After the model is launched, how to evaluate the application effect of unsupervised anomaly detection?
#A18: Generally based on the results of anomaly detection, a technical specialist will be designated to confirm in the real scene on site.
Q19: Are there any attempts to detect abnormalities in batteries in battery swap stations using the two methods mentioned in the article?
A19: Related attempts are being made.
#Q20: How to unify the length of time series data? Will padding with 0 cause the gradient to not drop?
A20: The Conceptor model mentioned in the article can handle time series of any length, so there is no need to fill in 0, and it also avoids the parameter "training" process, so this can be circumvented type of problem.
#Q21: Will GAN suffer from overfitting?
#A21: If it is only used in the field of anomaly detection, in fact, the more "overfitting", the better the model performance will be. In addition, due to the large randomness in the G network of the GAN model during the training process, overfitting generally does not occur.
Q22: When training a GAN model, what is the order of magnitude of training data used to generally set it to achieve better results?
#A22: This type of problem generally depends on the size of the neural network, the dimensions of the hidden neurons, etc. Generally speaking, for a 2-layer neural network with 100 neurons per layer, the volume of training data needs to be 1-2 orders of magnitude larger than the hidden layer dimension in order to achieve better results. At the same time, it is also necessary to use Some tricks to avoid pattern collapse from happening.
Q23: The minimum unit hidden parameters in the Conceptor model are fixed. Are they set based on expert experience? How does the bias compare to a normal RNN? What is the label volume for failure analysis? How to quantify business value?
A23: Many Conceptor models currently online use the same set of empirical parameters, without further parameter adjustment; according to practical experience, the relevant parameter settings range from 10 to 100, the difference in the impact on the results is very small, the only difference is in the computational cost. If the sample size of fault data is small and you want the results to be more accurate, you can set the parameters to 128, 256 or even higher. Correspondingly, the calculation cost will be higher. The number of labels for fault analysis is generally between 1 and 10. Business value quantification is generally measured by false alarms and missed alarms, because false alarms and missed alarms can be directly converted into quantitative business value impacts.
Q24: How to determine the fault start time and precision and recall rate?
#A24: The Conceptor method can be used to use the time growth window to form multiple concept matrices; the concept matrix can be spectrally clustered to determine the time of fault occurrence. See related papers in the Conceptor chapter for details.
#Q25: Do a large number of normal data have the same value? Will the model learn the same samples repeatedly?
#A25: In real scenarios, due to different operating conditions of the equipment, normal data is often very different.
Q26: What characteristics of faults are suitable for GAN, and what characteristics of faults are suitable for RNN?
A26: It is difficult to clearly divide the specific usage scenarios of these two models; generally speaking, GAN is better at solving problems with special data distribution and difficult to use classification networks. Unsupervised RNN is more suitable for handling small sample problems.
Q27: Can the model mentioned in this article be used in special scenarios such as "personnel violation detection"?
A27: For domain-specific scenarios, if domain-specific knowledge can be introduced to extract high-order features, it is generally possible; if only images are used for detection, if the image sample size If it is large and can represent normal behavior, the problem can be transformed into CV domain subdivision scene detection, which can be detected using the model mentioned in this article.
Q28: Is Conceptor Distance a similarity judgment? Is it learned with parameters?
A28: It has no parameters.
#Q29: Do I need to train a model for each fault?
#A29: It depends on the specific scenario, including model requirements, fault sample size, distribution complexity, etc. If the timing waveforms of two faults are very similar, there is generally no need to train a separate model. You only need to build a multi-classification model to determine the classification boundary. If the data forms of the two fault modes are very different, you can use the GAN model to update the data. Accurate identification.
Q30: What is the model training time and training cost?
A30: The training cost of the Conceptor model is very small and can be used to extract features; the training time of the GAN model is relatively longer, but for common structured tabular data, training It won't take too long.
#Q31: When training the model, what does the training set of normal samples look like? When slicing time series sliding windows, is there a minimum number of times recommended for each time series subset?
A31: The two models themselves have no requirements on the number of positive and negative samples; considering the model training time, thousands of representative samples are generally selected for training. . There is generally no minimum number recommendation for the number of times in a timing subset.
Q32: What is the approximate dimension of the feature matrix obtained by the RNN network?
#A32: The dimension of the feature matrix is directly related to the number of hidden neurons. If there are N hidden neurons, the dimension of the feature matrix is N×N. Considering the complexity of the model and calculation efficiency, N is generally not set too large, and a commonly used setting value is 32.
Q33: Why not use the discriminator in GAN as a classifier? The discriminator only learns normal data, and abnormal data will be classified as false data. What are the disadvantages of this approach?
A33: According to the principle of GAN, D network is used to distinguish normal samples from fake samples; and if fake samples are trained to a "complete body" state, they will be very close to normal samples. , making it difficult to distinguish between normal samples and abnormal samples; and the AE-GAN network assumes that normal samples and abnormal samples have a certain degree of distinction, which is the theoretical basis for using AE-GAN.
#Q34: How does the model of small sample learning ensure the generalization ability?
#A34: The generalization ability of the model needs to be based on an a priori assumption: all faults of the same type have similar data distribution. If the distribution of similar fault data is quite different, it is generally necessary to further subdivide the fault categories to ensure the generalization ability of the model.
#Q35: How to perform data preprocessing on input data?
#A35: For the two models mentioned in the article, the data only needs to be normalized.
Q36: How does GAN compare with traditional unsupervised directions such as isolation forest and AE?
#A36: Through the completeness of the theory, GAN can more completely describe the distribution of normal sample data, thereby constructing a more complete decision boundary. However, methods such as ordinary AE, isolated forest, and One Class SVM do not have theoretical completeness and cannot construct a more complete decision boundary.
Q37: If the discriminator can hardly distinguish between normal samples and fake samples in the later stage, then the GAN part will be of little significance. Will AE-GAN degenerate into AE at this time?
A37: If the discriminator is indeed unable to identify normal samples and fake samples, it can be seen from the side that the training of the generator is very successful; in the anomaly detection stage, only to the generator without using the discriminator. The generator in the GAN network is of great significance, so AE-GAN will not degenerate into AE. It can be understood as an upgraded version of AE, which is a regularized AE.
Q38: Have you tried using Transformer instead of RNN?
#A38: In scenarios with small samples and high interpretability requirements, no such attempt has been made, and related attempts may be made later.
Q39: What is the difference between AE-GAN and VAE?
A39: VAE is also a commonly used method for anomaly detection. VAE uses a prior Gaussian distribution in the hidden layer and changes the shape of the prior Gaussian distribution to fit real data. Makes the two distributions equivalent; however, the loss function used by VAE is KL divergence instead of JSD divergence, and KL divergence is asymmetric, so it may not work well in complex samples.
Q40: Will there be serious or missing data noise in the signal features during the experiment? What are the better methods of feature cleaning?
#A40: The charging gun case in the article is a case of serious noise. Some decomposition methods based on time series can decompose periodic items, trend items, noise items, etc. in the time series; missing features can be processed using incomplete data methods.
Q41: Can enhancement strategies such as APA be added to training?
A41: Taking GAN as an example, sample enhancement is mainly performed by adding noise, and the APA enhancement strategy is not used.
Q42: In the second step of 4.1.(3), if the normal range spans a large interval, if there are 3 samples 1, 2, and 3, among which samples 1 and 2 are normal samples, and sample 3 is an abnormal sample; sample 1 and sample 2 are on both sides of the normal range, and sample 3 is not far next to sample 1 but has exceeded the normal range, then will there be something between samples 1 and 2? What is the situation when the reconstruction error between samples 1 and 3 is greater than that of samples 1 and 3?
A42: The references provided in this article contain many extreme examples. For example, the example you cited is a typical two-gaussian ball example. AE-GAN can solve this type of problem.
The above is the detailed content of NIO deep learning algorithm practice. For more information, please follow other related articles on the PHP Chinese website!

Hot AI Tools

Undresser.AI Undress
AI-powered app for creating realistic nude photos

AI Clothes Remover
Online AI tool for removing clothes from photos.

Undress AI Tool
Undress images for free

Clothoff.io
AI clothes remover

Video Face Swap
Swap faces in any video effortlessly with our completely free AI face swap tool!

Hot Article
Hot Tools

Notepad++7.3.1
Easy-to-use and free code editor

SublimeText3 Chinese version
Chinese version, very easy to use

Zend Studio 13.0.1
Powerful PHP integrated development environment

Dreamweaver CS6
Visual web development tools

SublimeText3 Mac version
God-level code editing software (SublimeText3)
Hot Topics
 1386
1386
 52
52

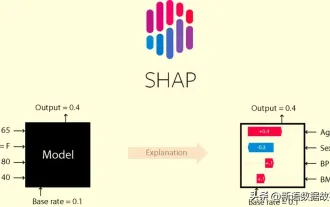 This article will take you to understand SHAP: model explanation for machine learning
Jun 01, 2024 am 10:58 AM
This article will take you to understand SHAP: model explanation for machine learning
Jun 01, 2024 am 10:58 AM
In the fields of machine learning and data science, model interpretability has always been a focus of researchers and practitioners. With the widespread application of complex models such as deep learning and ensemble methods, understanding the model's decision-making process has become particularly important. Explainable AI|XAI helps build trust and confidence in machine learning models by increasing the transparency of the model. Improving model transparency can be achieved through methods such as the widespread use of multiple complex models, as well as the decision-making processes used to explain the models. These methods include feature importance analysis, model prediction interval estimation, local interpretability algorithms, etc. Feature importance analysis can explain the decision-making process of a model by evaluating the degree of influence of the model on the input features. Model prediction interval estimate
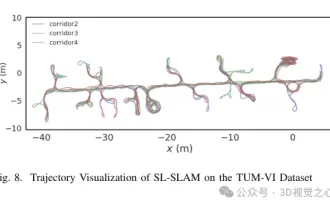 Beyond ORB-SLAM3! SL-SLAM: Low light, severe jitter and weak texture scenes are all handled
May 30, 2024 am 09:35 AM
Beyond ORB-SLAM3! SL-SLAM: Low light, severe jitter and weak texture scenes are all handled
May 30, 2024 am 09:35 AM
Written previously, today we discuss how deep learning technology can improve the performance of vision-based SLAM (simultaneous localization and mapping) in complex environments. By combining deep feature extraction and depth matching methods, here we introduce a versatile hybrid visual SLAM system designed to improve adaptation in challenging scenarios such as low-light conditions, dynamic lighting, weakly textured areas, and severe jitter. sex. Our system supports multiple modes, including extended monocular, stereo, monocular-inertial, and stereo-inertial configurations. In addition, it also analyzes how to combine visual SLAM with deep learning methods to inspire other research. Through extensive experiments on public datasets and self-sampled data, we demonstrate the superiority of SL-SLAM in terms of positioning accuracy and tracking robustness.
 Implementing Machine Learning Algorithms in C++: Common Challenges and Solutions
Jun 03, 2024 pm 01:25 PM
Implementing Machine Learning Algorithms in C++: Common Challenges and Solutions
Jun 03, 2024 pm 01:25 PM
Common challenges faced by machine learning algorithms in C++ include memory management, multi-threading, performance optimization, and maintainability. Solutions include using smart pointers, modern threading libraries, SIMD instructions and third-party libraries, as well as following coding style guidelines and using automation tools. Practical cases show how to use the Eigen library to implement linear regression algorithms, effectively manage memory and use high-performance matrix operations.
 Five schools of machine learning you don't know about
Jun 05, 2024 pm 08:51 PM
Five schools of machine learning you don't know about
Jun 05, 2024 pm 08:51 PM
Machine learning is an important branch of artificial intelligence that gives computers the ability to learn from data and improve their capabilities without being explicitly programmed. Machine learning has a wide range of applications in various fields, from image recognition and natural language processing to recommendation systems and fraud detection, and it is changing the way we live. There are many different methods and theories in the field of machine learning, among which the five most influential methods are called the "Five Schools of Machine Learning". The five major schools are the symbolic school, the connectionist school, the evolutionary school, the Bayesian school and the analogy school. 1. Symbolism, also known as symbolism, emphasizes the use of symbols for logical reasoning and expression of knowledge. This school of thought believes that learning is a process of reverse deduction, through existing
 Explainable AI: Explaining complex AI/ML models
Jun 03, 2024 pm 10:08 PM
Explainable AI: Explaining complex AI/ML models
Jun 03, 2024 pm 10:08 PM
Translator | Reviewed by Li Rui | Chonglou Artificial intelligence (AI) and machine learning (ML) models are becoming increasingly complex today, and the output produced by these models is a black box – unable to be explained to stakeholders. Explainable AI (XAI) aims to solve this problem by enabling stakeholders to understand how these models work, ensuring they understand how these models actually make decisions, and ensuring transparency in AI systems, Trust and accountability to address this issue. This article explores various explainable artificial intelligence (XAI) techniques to illustrate their underlying principles. Several reasons why explainable AI is crucial Trust and transparency: For AI systems to be widely accepted and trusted, users need to understand how decisions are made
 Is Flash Attention stable? Meta and Harvard found that their model weight deviations fluctuated by orders of magnitude
May 30, 2024 pm 01:24 PM
Is Flash Attention stable? Meta and Harvard found that their model weight deviations fluctuated by orders of magnitude
May 30, 2024 pm 01:24 PM
MetaFAIR teamed up with Harvard to provide a new research framework for optimizing the data bias generated when large-scale machine learning is performed. It is known that the training of large language models often takes months and uses hundreds or even thousands of GPUs. Taking the LLaMA270B model as an example, its training requires a total of 1,720,320 GPU hours. Training large models presents unique systemic challenges due to the scale and complexity of these workloads. Recently, many institutions have reported instability in the training process when training SOTA generative AI models. They usually appear in the form of loss spikes. For example, Google's PaLM model experienced up to 20 loss spikes during the training process. Numerical bias is the root cause of this training inaccuracy,
 Improved detection algorithm: for target detection in high-resolution optical remote sensing images
Jun 06, 2024 pm 12:33 PM
Improved detection algorithm: for target detection in high-resolution optical remote sensing images
Jun 06, 2024 pm 12:33 PM
01 Outlook Summary Currently, it is difficult to achieve an appropriate balance between detection efficiency and detection results. We have developed an enhanced YOLOv5 algorithm for target detection in high-resolution optical remote sensing images, using multi-layer feature pyramids, multi-detection head strategies and hybrid attention modules to improve the effect of the target detection network in optical remote sensing images. According to the SIMD data set, the mAP of the new algorithm is 2.2% better than YOLOv5 and 8.48% better than YOLOX, achieving a better balance between detection results and speed. 02 Background & Motivation With the rapid development of remote sensing technology, high-resolution optical remote sensing images have been used to describe many objects on the earth’s surface, including aircraft, cars, buildings, etc. Object detection in the interpretation of remote sensing images
 AlphaFold 3 is launched, comprehensively predicting the interactions and structures of proteins and all living molecules, with far greater accuracy than ever before
Jul 16, 2024 am 12:08 AM
AlphaFold 3 is launched, comprehensively predicting the interactions and structures of proteins and all living molecules, with far greater accuracy than ever before
Jul 16, 2024 am 12:08 AM
Editor | Radish Skin Since the release of the powerful AlphaFold2 in 2021, scientists have been using protein structure prediction models to map various protein structures within cells, discover drugs, and draw a "cosmic map" of every known protein interaction. . Just now, Google DeepMind released the AlphaFold3 model, which can perform joint structure predictions for complexes including proteins, nucleic acids, small molecules, ions and modified residues. The accuracy of AlphaFold3 has been significantly improved compared to many dedicated tools in the past (protein-ligand interaction, protein-nucleic acid interaction, antibody-antigen prediction). This shows that within a single unified deep learning framework, it is possible to achieve
