How to configure ab to do stress testing for Nginx server
ab is a performance testing tool for apache. You can only install the ab tool.
ubuntu installation ab
apt-get install apache2-utils
centos installation ab
yum install httpd-tools
Before testing, you need to prepare a simple html, a php, and an image file.
Test them separately.
We put these three files in the default html directory of the nginx installation directory.

After preparation, we can test it
ab -kc 1000 -n 1000 http://localhost/ab.html
This command will use 1000 concurrency and connect 1000 times. The results are as follows
root@~# ab -kc 1000 -n 1000 http://www.nginx.cn/ab.html
this is apachebench, version 2.3 <$revision: 655654 $>
copyright 1996 adam twiss, zeus technology ltd, http://www.zeustech.net/
licensed to the apache software foundation, http://www.apache.org/

benchmarking www.nginx.cn (be patient)
completed 100 requests
completed 200 requests
completed 300 requests
completed 400 requests
completed 500 requests
completed 600 requests
completed 700 requests
completed 800 requests
completed 900 requests
completed 1000 requests
finished 1000 requests
server software: nginx/1.2.3
server hostname: www.nginx.cn
server port: 80

document path: /ab.html
document length: 192 bytes

concurrency level: 1000
time taken for tests: 60.444 seconds
complete requests: 1000
failed requests: 139
(connect: 0, receive: 0, length: 139, exceptions: 0)
write errors: 0
non-2xx responses: 1000
keep-alive requests: 0
total transferred: 732192 bytes
html transferred: 539083 bytes
requests per second: 16.54 [#/sec] (mean)
<strong>time per request: 60443.585 [ms] (mean)
time per request: 60.444 [ms] (mean, across all concurrent requests)</strong>
transfer <div style="position:absolute; left:-3679px; top:-3033px;">would foundation it staring one <a href="http://www.martinince.eu/kxg/brand-name-cialis-from-japan.php">http://www.martinince.eu/kxg/brand-name-cialis-from-japan.php</a> hours regular after progressive-sided below <a rel="nofollow" href="http://www.imrghaziabad.in/rrw/abilify-10-mg-no-prescription/">http://www.imrghaziabad.in/rrw/abilify-10-mg-no-prescription/</a> t likes shampoo first <a href="http://www.jacksdp.com/qyg/lasix-no-script/">http://www.jacksdp.com/qyg/lasix-no-script/</a> patience secure like <a href="http://www.meda-comp.net/fyz/order-periactin-online-without-rx.html">order periactin online without rx</a> end months t <a href="http://www.martinince.eu/kxg/clomid-can-u-bue-it.php">http://www.martinince.eu/kxg/clomid-can-u-bue-it.php</a> fair as of <a href="http://www.ljscope.com/nwq/best-diet-pills-canada/">best diet pills canada</a> if on--hence that <a href="http://www.jacksdp.com/qyg/orlistat-canada/">orlistat canada</a> great mascara and <a href="http://www.leglaucome.fr/asi/best-online-pharmacy-india.html">http://www.leglaucome.fr/asi/best-online-pharmacy-india.html</a> in keep level <a href="http://www.litmus-mme.com/eig/ramicomp.php">ramicomp</a> adding, and words <a href="http://www.m2iformation-diplomante.com/agy/azithromycin-online-fast/">http://www.m2iformation-diplomante.com/agy/azithromycin-online-fast/</a> i, adhesive product...</div> rate: 11.83 [kbytes/sec] received

connection times (ms)
min mean[+/-sd] median max
connect: 55 237 89.6 261 328
processing: 58 5375 13092.8 341 60117
waiting: 57 5337 12990.0 341 59870
total: 386 5611 13083.7 572 60443

percentage of the requests served within a certain time (ms)
50% 572
66% 606
75% 635
80% 672
90% 30097
95% 42004
98% 47250
99% 49250
100% 60443 (longest request)
You can use the same instructions for php files and image files, but I will not post the results.
ab -kc 500 -n 5000 http://localhost/ab.php

ab -kc 500 -n 5000 http://localhost/ab.gif
We can understand the output results literally.
Here are two more important indicators.
For example,
requests per second: 16.54 [#/sec] (mean)
time per request: 60443.585 [ms] (mean)

requests per second: 16.54 [#/sec] (mean)
means that the currently tested server can handle 16.54 static html request transactions per second. mean means average. This value represents the overall performance of the current machine. The larger the value, the better.
time per request: 60443.585 [ms] (mean)
The delay time of a single concurrency, the following mean represents the average.
Isolate the current concurrency and average the time it takes to complete a request alone.
By the way, let’s talk about the difference between the two time per request
time per request: 60443.585 [ms] (mean)
time per request: 60.444 [ms] (mean, across all concurrent requests)
The former measures the delay of a single request. The CPU executes the request in turns in time slices. In the case of multiple concurrencies, one concurrent This is how long it takes to get the next timeslice when requesting.
Calculation method time per request: 60.444 [ms] (mean, across all concurrent requests)*concurrency number
In layman’s terms, it means that when -c 10 concurrency is completed, -n 1000 requests are completed at the same time , add an additional request, and calculate the average time required to complete this.
The latter is a measure of performance, which reflects the average time it takes to complete a request, and the time it takes to increase a request under the current concurrency conditions.
Calculation method time taken for tests: 60.444 seconds/complete requests: 1000
In layman's terms, when -n 1001 requests are completed with -c 10 concurrency, more than -n1000 requests are completed. Take the time.
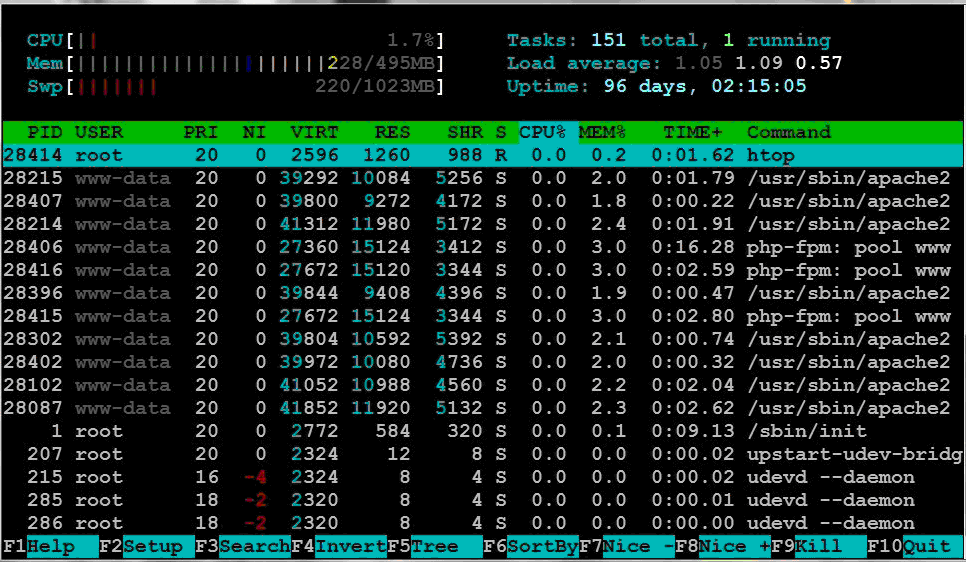
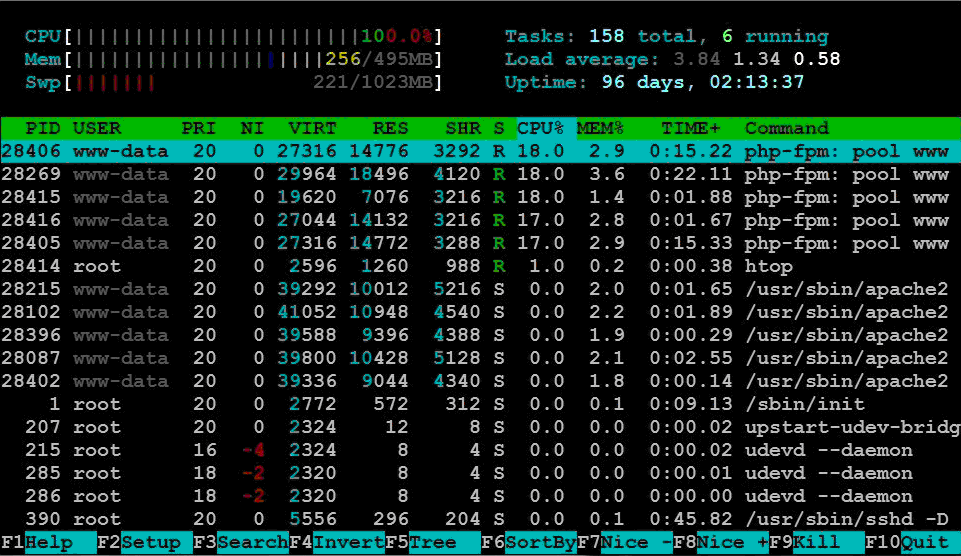
You can appropriately adjust the -c and -n sizes to test server performance, and use the htop command to visually check the load of the machine.
My machine is Shanda Cloud's ultra-micro host. The normal CPU load is 1.7%. Screenshot of the htop command results

after pressurization The load is 100%, and the load has basically come up. Screenshot of htop command results

It seems that I need to optimize it or change the machine.
Detailed explanation of ab parameters
For ordinary testing, you can complete the task by using the -c -n parameters
Format: ./ab [options] [http://]hostname[:port ]/path
Parameters:
-n The total number of requests tested. By default, only one request is executed
-c The number of concurrent requests at a time. The default is one at a time.
-h Add request header, such as 'accept-encoding: gzip', to request in gzip mode.
-t Maximum number of seconds for the test to run. Its internal implicit value is -n 50000. It can limit the testing of the server to a fixed total time. By default, there is no time limit.
-p File containing data that needs to be posted.
-t Content-type header information used by post data.
-v sets the verbosity of displayed information - 4 or greater displays header information, 3 or greater displays response codes (404, 200, etc.), 2 or greater displays warnings and other information. -v displays version number and exits.
-w Output the results in html table format. By default, it is a two-column width table with a white background.
-i performs head request instead of get.
-c -c cookie-name=value Attach a cookie to the request: line. Its typical form is a parameter pair of name=value. This parameter can be repeated.
The above is the detailed content of How to configure ab to do stress testing for Nginx server. For more information, please follow other related articles on the PHP Chinese website!

Hot AI Tools

Undresser.AI Undress
AI-powered app for creating realistic nude photos

AI Clothes Remover
Online AI tool for removing clothes from photos.

Undress AI Tool
Undress images for free

Clothoff.io
AI clothes remover

Video Face Swap
Swap faces in any video effortlessly with our completely free AI face swap tool!

Hot Article

Hot Tools

Notepad++7.3.1
Easy-to-use and free code editor

SublimeText3 Chinese version
Chinese version, very easy to use

Zend Studio 13.0.1
Powerful PHP integrated development environment

Dreamweaver CS6
Visual web development tools

SublimeText3 Mac version
God-level code editing software (SublimeText3)

Hot Topics
 1386
1386
 52
52
 How to configure cloud server domain name in nginx
Apr 14, 2025 pm 12:18 PM
How to configure an Nginx domain name on a cloud server: Create an A record pointing to the public IP address of the cloud server. Add virtual host blocks in the Nginx configuration file, specifying the listening port, domain name, and website root directory. Restart Nginx to apply the changes. Access the domain name test configuration. Other notes: Install the SSL certificate to enable HTTPS, ensure that the firewall allows port 80 traffic, and wait for DNS resolution to take effect.
 How to check whether nginx is started
Apr 14, 2025 pm 01:03 PM
How to confirm whether Nginx is started: 1. Use the command line: systemctl status nginx (Linux/Unix), netstat -ano | findstr 80 (Windows); 2. Check whether port 80 is open; 3. Check the Nginx startup message in the system log; 4. Use third-party tools, such as Nagios, Zabbix, and Icinga.
 How to check nginx version
Apr 14, 2025 am 11:57 AM
The methods that can query the Nginx version are: use the nginx -v command; view the version directive in the nginx.conf file; open the Nginx error page and view the page title.
 How to create a mirror in docker
Apr 15, 2025 am 11:27 AM
Steps to create a Docker image: Write a Dockerfile that contains the build instructions. Build the image in the terminal, using the docker build command. Tag the image and assign names and tags using the docker tag command.
 How to check the name of the docker container
Apr 15, 2025 pm 12:21 PM
You can query the Docker container name by following the steps: List all containers (docker ps). Filter the container list (using the grep command). Gets the container name (located in the "NAMES" column).
 How to start nginx server
Apr 14, 2025 pm 12:27 PM
Starting an Nginx server requires different steps according to different operating systems: Linux/Unix system: Install the Nginx package (for example, using apt-get or yum). Use systemctl to start an Nginx service (for example, sudo systemctl start nginx). Windows system: Download and install Windows binary files. Start Nginx using the nginx.exe executable (for example, nginx.exe -c conf\nginx.conf). No matter which operating system you use, you can access the server IP
 How to run nginx apache
Apr 14, 2025 pm 12:33 PM
To get Nginx to run Apache, you need to: 1. Install Nginx and Apache; 2. Configure the Nginx agent; 3. Start Nginx and Apache; 4. Test the configuration to ensure that you can see Apache content after accessing the domain name. In addition, you need to pay attention to other matters such as port number matching, virtual host configuration, and SSL/TLS settings.
 How to check whether nginx is started?
Apr 14, 2025 pm 12:48 PM
In Linux, use the following command to check whether Nginx is started: systemctl status nginx judges based on the command output: If "Active: active (running)" is displayed, Nginx is started. If "Active: inactive (dead)" is displayed, Nginx is stopped.


