

How to monitor Nginx/Tomcat/MySQL with zabbix

zabbix监控nginx
a机器:zabbix服务端(192.168.234.128) b机器:zabbix客户端(192.168.234.125)
在b机器(zabbix客户端)操作:
编辑nginx虚拟主机配置文件:
[root@centos ~]# vi /etc/nginx/conf.d/default.conf
在server{}中添加以下内容:
 location /nginx_status
 {
  stub_status on;
  access_log off;
  allow 127.0.0.1;
  deny all;
}重载nginx配置:
[root@centos ~]# nginx -s reload
测试:
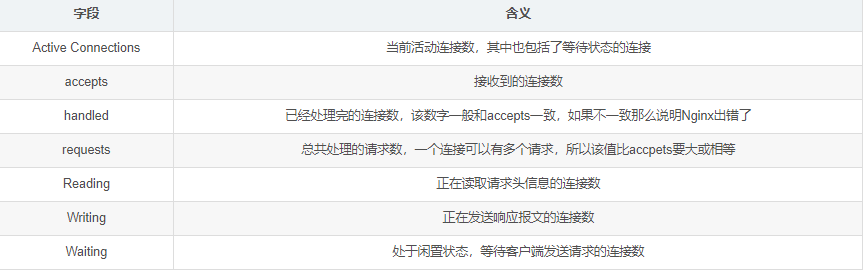
[root@centos ~]# curl http://127.0.0.1/nginx_status
active connections: 1
server accepts handled requests
 3 3 3
reading: 0 writing: 1 waiting: 0
#nginx状态信息已显示
状态说明:
添加监控脚本:
vi /usr/local/sbin/ngx_status.sh
添加以下内容:
#!/bin/bash
url="http://127.0.0.1/nginx_status"
curl=/usr/bin/curl

# 检测nginx进程是否存在
function ping {
 /sbin/pidof nginx | wc -l
}
# 检测nginx性能
function active {
 $curl $url 2>/dev/null| grep 'active' | awk '{print $nf}'
}
function reading {
 $curl $url 2>/dev/null| grep 'reading' | awk '{print $2}'
}
function writing {
 $curl $url 2>/dev/null| grep 'writing' | awk '{print $4}'
}
function waiting {
 $curl $url 2>/dev/null| grep 'waiting' | awk '{print $6}'
}
function accepts {
 $curl $url 2>/dev/null| awk nr==3 | awk '{print $1}'
}
function handled {
 $curl $url 2>/dev/null| awk nr==3 | awk '{print $2}'
}
function requests {
 $curl $url 2>/dev/null| awk nr==3 | awk '{print $3}'
}
$1添加权限:
[root@centos ~]# chmod 755 /usr/local/sbin/ngx_status.sh
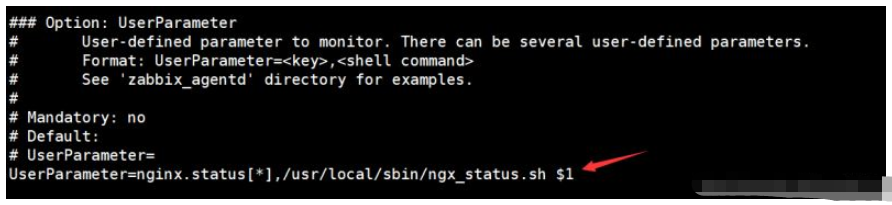
编辑zabbix_agent配置文件:
[root@centos ~]# vi /etc/zabbix/zabbix_agentd.conf
在option:userparameter处添加:userparameter=nginx.status[*],/usr/local/sbin/ngx_status.sh $1
重启服务:
[root@centos ~]# systemctl restart zabbix-agent
在a机器(服务端)测试:
[root@zabbix ~]# zabbix_get -s 192.168.234.125 -k 'nginx.status[accepts]'
6
在本机创建.xml文件并添加以下内容:(文件名称自定义)
<?xml version="1.0" encoding="utf-8"?>
<zabbix_export>
 <version>4.0</version>
 <date>2019-02-11t07:29:29z</date>
 <groups>
  <group>
   <name>templates</name>
  </group>
 </groups>
 <templates>
  <template>
   <template>template app nginx</template>
   <name>template app nginx</name>
   <description/>
   <groups>
    <group>
     <name>templates</name>
    </group>
   </groups>
   <applications>
    <application>
     <name>nginx</name>
    </application>
   </applications>
   <items>
    <item>
     <name>nginx status server accepts</name>
     <type>0</type>
     <snmp_community/>
     <snmp_oid/>
     <key>nginx.status[accepts]</key>
     <delay>60</delay>
     <history>90d</history>
     <trends>365d</trends>
     <status>0</status>
     <value_type>3</value_type>
     <allowed_hosts/>
     <units/>
     <snmpv3_contextname/>
     <snmpv3_securityname/>
     <snmpv3_securitylevel>0</snmpv3_securitylevel>
     <snmpv3_authprotocol>0</snmpv3_authprotocol>
     <snmpv3_authpassphrase/>
     <snmpv3_privprotocol>0</snmpv3_privprotocol>
     <snmpv3_privpassphrase/>
     <params/>
     <ipmi_sensor/>
     <authtype>0</authtype>
     <username/>
     <password/>
     <publickey/>
     <privatekey/>
     <port/>
     <description>accepts</description>
     <inventory_link>0</inventory_link>
     <applications>
      <application>
       <name>nginx</name>
      </application>
     </applications>
     <valuemap/>
     <logtimefmt/>
     <preprocessing>
      <step>
       <type>10</type>
       <params/>
      </step>
     </preprocessing>
     <jmx_endpoint/>
     <timeout>3s</timeout>
     <url/>
     <query_fields/>
     <posts/>
     <status_codes>200</status_codes>
     <follow_redirects>1</follow_redirects>
     <post_type>0</post_type>
     <http_proxy/>
     <headers/>
     <retrieve_mode>0</retrieve_mode>
     <request_method>0</request_method>
     <output_format>0</output_format>
     <allow_traps>0</allow_traps>
     <ssl_cert_file/>
     <ssl_key_file/>
     <ssl_key_password/>
     <verify_peer>0</verify_peer>
     <verify_host>0</verify_host>
     <master_item/>
    </item>
    <item>
     <name>nginx status connections active</name>
     <type>0</type>
     <snmp_community/>
     <snmp_oid/>
     <key>nginx.status[active]</key>
     <delay>60</delay>
     <history>90d</history>
     <trends>365d</trends>
     <status>0</status>
     <value_type>3</value_type>
     <allowed_hosts/>
     <units/>
     <snmpv3_contextname/>
     <snmpv3_securityname/>
     <snmpv3_securitylevel>0</snmpv3_securitylevel>
     <snmpv3_authprotocol>0</snmpv3_authprotocol>
     <snmpv3_authpassphrase/>
     <snmpv3_privprotocol>0</snmpv3_privprotocol>
     <snmpv3_privpassphrase/>
     <params/>
     <ipmi_sensor/>
     <authtype>0</authtype>
     <username/>
     <password/>
     <publickey/>
     <privatekey/>
     <port/>
     <description>active</description>
     <inventory_link>0</inventory_link>
     <applications>
      <application>
       <name>nginx</name>
      </application>
     </applications>
     <valuemap/>
     <logtimefmt/>
     <preprocessing/>
     <jmx_endpoint/>
     <timeout>3s</timeout>
     <url/>
     <query_fields/>
     <posts/>
     <status_codes>200</status_codes>
     <follow_redirects>1</follow_redirects>
     <post_type>0</post_type>
     <http_proxy/>
     <headers/>
     <retrieve_mode>0</retrieve_mode>
     <request_method>0</request_method>
     <output_format>0</output_format>
     <allow_traps>0</allow_traps>
     <ssl_cert_file/>
     <ssl_key_file/>
     <ssl_key_password/>
     <verify_peer>0</verify_peer>
     <verify_host>0</verify_host>
     <master_item/>
    </item>
    <item>
     <name>nginx status server handled</name>
     <type>0</type>
     <snmp_community/>
     <snmp_oid/>
     <key>nginx.status[handled]</key>
     <delay>60</delay>
     <history>90d</history>
     <trends>365d</trends>
     <status>0</status>
     <value_type>3</value_type>
     <allowed_hosts/>
     <units/>
     <snmpv3_contextname/>
     <snmpv3_securityname/>
     <snmpv3_securitylevel>0</snmpv3_securitylevel>
     <snmpv3_authprotocol>0</snmpv3_authprotocol>
     <snmpv3_authpassphrase/>
     <snmpv3_privprotocol>0</snmpv3_privprotocol>
     <snmpv3_privpassphrase/>
     <params/>
     <ipmi_sensor/>
     <authtype>0</authtype>
     <username/>
     <password/>
     <publickey/>
     <privatekey/>
     <port/>
     <description>handled</description>
     <inventory_link>0</inventory_link>
     <applications>
      <application>
       <name>nginx</name>
      </application>
     </applications>
     <valuemap/>
     <logtimefmt/>
     <preprocessing>
      <step>
       <type>10</type>
       <params/>
      </step>
     </preprocessing>
     <jmx_endpoint/>
     <timeout>3s</timeout>
     <url/>
     <query_fields/>
     <posts/>
     <status_codes>200</status_codes>
     <follow_redirects>1</follow_redirects>
     <post_type>0</post_type>
     <http_proxy/>
     <headers/>
     <retrieve_mode>0</retrieve_mode>
     <request_method>0</request_method>
     <output_format>0</output_format>
     <allow_traps>0</allow_traps>
     <ssl_cert_file/>
     <ssl_key_file/>
     <ssl_key_password/>
     <verify_peer>0</verify_peer>
     <verify_host>0</verify_host>
     <master_item/>
    </item>
    <item>
     <name>nginx status ping</name>
     <type>0</type>
     <snmp_community/>
     <snmp_oid/>
     <key>nginx.status[ping]</key>
     <delay>60</delay>
     <history>30d</history>
     <trends>365d</trends>
     <status>0</status>
     <value_type>3</value_type>
     <allowed_hosts/>
     <units/>
     <snmpv3_contextname/>
     <snmpv3_securityname/>
     <snmpv3_securitylevel>0</snmpv3_securitylevel>
     <snmpv3_authprotocol>0</snmpv3_authprotocol>
     <snmpv3_authpassphrase/>
     <snmpv3_privprotocol>0</snmpv3_privprotocol>
     <snmpv3_privpassphrase/>
     <params/>
     <ipmi_sensor/>
     <authtype>0</authtype>
     <username/>
     <password/>
     <publickey/>
     <privatekey/>
     <port/>
     <description>is live</description>
     <inventory_link>0</inventory_link>
     <applications>
      <application>
       <name>nginx</name>
      </application>
     </applications>
     <valuemap>
      <name>service state</name>
     </valuemap>
     <logtimefmt/>
     <preprocessing/>
     <jmx_endpoint/>
     <timeout>3s</timeout>
     <url/>
     <query_fields/>
     <posts/>
     <status_codes>200</status_codes>
     <follow_redirects>1</follow_redirects>
     <post_type>0</post_type>
     <http_proxy/>
     <headers/>
     <retrieve_mode>0</retrieve_mode>
     <request_method>0</request_method>
     <output_format>0</output_format>
     <allow_traps>0</allow_traps>
     <ssl_cert_file/>
     <ssl_key_file/>
     <ssl_key_password/>
     <verify_peer>0</verify_peer>
     <verify_host>0</verify_host>
     <master_item/>
    </item>
    <item>
     <name>nginx status connections reading</name>
     <type>0</type>
     <snmp_community/>
     <snmp_oid/>
     <key>nginx.status[reading]</key>
     <delay>60</delay>
     <history>90d</history>
     <trends>365d</trends>
     <status>0</status>
     <value_type>3</value_type>
     <allowed_hosts/>
     <units/>
     <snmpv3_contextname/>
     <snmpv3_securityname/>
     <snmpv3_securitylevel>0</snmpv3_securitylevel>
     <snmpv3_authprotocol>0</snmpv3_authprotocol>
     <snmpv3_authpassphrase/>
     <snmpv3_privprotocol>0</snmpv3_privprotocol>
     <snmpv3_privpassphrase/>
     <params/>
     <ipmi_sensor/>
     <authtype>0</authtype>
     <username/>
     <password/>
     <publickey/>
     <privatekey/>
     <port/>
     <description>reading</description>
     <inventory_link>0</inventory_link>
     <applications>
      <application>
       <name>nginx</name>
      </application>
     </applications>
     <valuemap/>
     <logtimefmt/>
     <preprocessing/>
     <jmx_endpoint/>
     <timeout>3s</timeout>
     <url/>
     <query_fields/>
     <posts/>
     <status_codes>200</status_codes>
     <follow_redirects>1</follow_redirects>
     <post_type>0</post_type>
     <http_proxy/>
     <headers/>
     <retrieve_mode>0</retrieve_mode>
     <request_method>0</request_method>
     <output_format>0</output_format>
     <allow_traps>0</allow_traps>
     <ssl_cert_file/>
     <ssl_key_file/>
     <ssl_key_password/>
     <verify_peer>0</verify_peer>
     <verify_host>0</verify_host>
     <master_item/>
    </item>
    <item>
     <name>nginx status server requests</name>
     <type>0</type>
     <snmp_community/>
     <snmp_oid/>
     <key>nginx.status[requests]</key>
     <delay>60</delay>
     <history>90d</history>
     <trends>365d</trends>
     <status>0</status>
     <value_type>3</value_type>
     <allowed_hosts/>
     <units/>
     <snmpv3_contextname/>
     <snmpv3_securityname/>
     <snmpv3_securitylevel>0</snmpv3_securitylevel>
     <snmpv3_authprotocol>0</snmpv3_authprotocol>
     <snmpv3_authpassphrase/>
     <snmpv3_privprotocol>0</snmpv3_privprotocol>
     <snmpv3_privpassphrase/>
     <params/>
     <ipmi_sensor/>
     <authtype>0</authtype>
     <username/>
     <password/>
     <publickey/>
     <privatekey/>
     <port/>
     <description>requests</description>
     <inventory_link>0</inventory_link>
     <applications>
      <application>
       <name>nginx</name>
      </application>
     </applications>
     <valuemap/>
     <logtimefmt/>
     <preprocessing>
      <step>
       <type>10</type>
       <params/>
      </step>
     </preprocessing>
     <jmx_endpoint/>
     <timeout>3s</timeout>
     <url/>
     <query_fields/>
     <posts/>
     <status_codes>200</status_codes>
     <follow_redirects>1</follow_redirects>
     <post_type>0</post_type>
     <http_proxy/>
     <headers/>
     <retrieve_mode>0</retrieve_mode>
     <request_method>0</request_method>
     <output_format>0</output_format>
     <allow_traps>0</allow_traps>
     <ssl_cert_file/>
     <ssl_key_file/>
     <ssl_key_password/>
     <verify_peer>0</verify_peer>
     <verify_host>0</verify_host>
     <master_item/>
    </item>
    <item>
     <name>nginx status connections waiting</name>
     <type>0</type>
     <snmp_community/>
     <snmp_oid/>
     <key>nginx.status[waiting]</key>
     <delay>60</delay>
     <history>90d</history>
     <trends>365d</trends>
     <status>0</status>
     <value_type>3</value_type>
     <allowed_hosts/>
     <units/>
     <snmpv3_contextname/>
     <snmpv3_securityname/>
     <snmpv3_securitylevel>0</snmpv3_securitylevel>
     <snmpv3_authprotocol>0</snmpv3_authprotocol>
     <snmpv3_authpassphrase/>
     <snmpv3_privprotocol>0</snmpv3_privprotocol>
     <snmpv3_privpassphrase/>
     <params/>
     <ipmi_sensor/>
     <authtype>0</authtype>
     <username/>
     <password/>
     <publickey/>
     <privatekey/>
     <port/>
     <description>waiting</description>
     <inventory_link>0</inventory_link>
     <applications>
      <application>
       <name>nginx</name>
      </application>
     </applications>
     <valuemap/>
     <logtimefmt/>
     <preprocessing/>
     <jmx_endpoint/>
     <timeout>3s</timeout>
     <url/>
     <query_fields/>
     <posts/>
     <status_codes>200</status_codes>
     <follow_redirects>1</follow_redirects>
     <post_type>0</post_type>
     <http_proxy/>
     <headers/>
     <retrieve_mode>0</retrieve_mode>
     <request_method>0</request_method>
     <output_format>0</output_format>
     <allow_traps>0</allow_traps>
     <ssl_cert_file/>
     <ssl_key_file/>
     <ssl_key_password/>
     <verify_peer>0</verify_peer>
     <verify_host>0</verify_host>
     <master_item/>
    </item>
    <item>
     <name>nginx status connections writing</name>
     <type>0</type>
     <snmp_community/>
     <snmp_oid/>
     <key>nginx.status[writing]</key>
     <delay>60</delay>
     <history>90d</history>
     <trends>365d</trends>
     <status>0</status>
     <value_type>3</value_type>
     <allowed_hosts/>
     <units/>
     <snmpv3_contextname/>
     <snmpv3_securityname/>
     <snmpv3_securitylevel>0</snmpv3_securitylevel>
     <snmpv3_authprotocol>0</snmpv3_authprotocol>
     <snmpv3_authpassphrase/>
     <snmpv3_privprotocol>0</snmpv3_privprotocol>
     <snmpv3_privpassphrase/>
     <params/>
     <ipmi_sensor/>
     <authtype>0</authtype>
     <username/>
     <password/>
     <publickey/>
     <privatekey/>
     <port/>
     <description>writing</description>
     <inventory_link>0</inventory_link>
     <applications>
      <application>
       <name>nginx</name>
      </application>
     </applications>
     <valuemap/>
     <logtimefmt/>
     <preprocessing/>
     <jmx_endpoint/>
     <timeout>3s</timeout>
     <url/>
     <query_fields/>
     <posts/>
     <status_codes>200</status_codes>
     <follow_redirects>1</follow_redirects>
     <post_type>0</post_type>
     <http_proxy/>
     <headers/>
     <retrieve_mode>0</retrieve_mode>
     <request_method>0</request_method>
     <output_format>0</output_format>
     <allow_traps>0</allow_traps>
     <ssl_cert_file/>
     <ssl_key_file/>
     <ssl_key_password/>
     <verify_peer>0</verify_peer>
     <verify_host>0</verify_host>
     <master_item/>
    </item>
   </items>
   <discovery_rules/>
   <httptests/>
   <macros/>
   <templates/>
   <screens/>
  </template>
 </templates>
 <triggers>
  <trigger>
   <expression>{template app nginx:nginx.status[ping].last()}=0</expression>
   <recovery_mode>0</recovery_mode>
   <recovery_expression/>
   <name>nginx was down!</name>
   <correlation_mode>0</correlation_mode>
   <correlation_tag/>
   <url/>
   <status>0</status>
   <priority>4</priority>
   <description>nginx进程数:0,请注意</description>
   <type>0</type>
   <manual_close>0</manual_close>
   <dependencies/>
   <tags/>
  </trigger>
 </triggers>
 <graphs>
  <graph>
   <name>nginx status connections</name>
   <width>900</width>
   <height>200</height>
   <yaxismin>0.0000</yaxismin>
   <yaxismax>100.0000</yaxismax>
   <show_work_period>1</show_work_period>
   <show_triggers>1</show_triggers>
   <type>0</type>
   <show_legend>1</show_legend>
   <show_3d>0</show_3d>
   <percent_left>0.0000</percent_left>
   <percent_right>0.0000</percent_right>
   <ymin_type_1>0</ymin_type_1>
   <ymax_type_1>0</ymax_type_1>
   <ymin_item_1>0</ymin_item_1>
   <ymax_item_1>0</ymax_item_1>
   <graph_items>
    <graph_item>
     <sortorder>0</sortorder>
     <drawtype>0</drawtype>
     <color>00c800</color>
     <yaxisside>0</yaxisside>
     <calc_fnc>2</calc_fnc>
     <type>0</type>
     <item>
      <host>template app nginx</host>
      <key>nginx.status[active]</key>
     </item>
    </graph_item>
    <graph_item>
     <sortorder>1</sortorder>
     <drawtype>0</drawtype>
     <color>c80000</color>
     <yaxisside>0</yaxisside>
     <calc_fnc>2</calc_fnc>
     <type>0</type>
     <item>
      <host>template app nginx</host>
      <key>nginx.status[reading]</key>
     </item>
    </graph_item>
    <graph_item>
     <sortorder>2</sortorder>
     <drawtype>0</drawtype>
     <color>0000c8</color>
     <yaxisside>0</yaxisside>
     <calc_fnc>2</calc_fnc>
     <type>0</type>
     <item>
      <host>template app nginx</host>
      <key>nginx.status[waiting]</key>
     </item>
    </graph_item>
    <graph_item>
     <sortorder>3</sortorder>
     <drawtype>0</drawtype>
     <color>c800c8</color>
     <yaxisside>0</yaxisside>
     <calc_fnc>2</calc_fnc>
     <type>0</type>
     <item>
      <host>template app nginx</host>
      <key>nginx.status[writing]</key>
     </item>
    </graph_item>
   </graph_items>
  </graph>
  <graph>
   <name>nginx status server</name>
   <width>900</width>
   <height>200</height>
   <yaxismin>0.0000</yaxismin>
   <yaxismax>100.0000</yaxismax>
   <show_work_period>1</show_work_period>
   <show_triggers>1</show_triggers>
   <type>0</type>
   <show_legend>1</show_legend>
   <show_3d>0</show_3d>
   <percent_left>0.0000</percent_left>
   <percent_right>0.0000</percent_right>
   <ymin_type_1>0</ymin_type_1>
   <ymax_type_1>0</ymax_type_1>
   <ymin_item_1>0</ymin_item_1>
   <ymax_item_1>0</ymax_item_1>
   <graph_items>
    <graph_item>
     <sortorder>0</sortorder>
     <drawtype>0</drawtype>
     <color>00c800</color>
     <yaxisside>0</yaxisside>
     <calc_fnc>2</calc_fnc>
     <type>0</type>
     <item>
      <host>template app nginx</host>
      <key>nginx.status[accepts]</key>
     </item>
    </graph_item>
    <graph_item>
     <sortorder>1</sortorder>
     <drawtype>0</drawtype>
     <color>c80000</color>
     <yaxisside>0</yaxisside>
     <calc_fnc>2</calc_fnc>
     <type>0</type>
     <item>
      <host>template app nginx</host>
      <key>nginx.status[handled]</key>
     </item>
    </graph_item>
    <graph_item>
     <sortorder>2</sortorder>
     <drawtype>0</drawtype>
     <color>0000c8</color>
     <yaxisside>0</yaxisside>
     <calc_fnc>2</calc_fnc>
     <type>0</type>
     <item>
      <host>template app nginx</host>
      <key>nginx.status[requests]</key>
     </item>
    </graph_item>
   </graph_items>
  </graph>
 </graphs>
 <value_maps>
  <value_map>
   <name>service state</name>
   <mappings>
    <mapping>
     <value>0</value>
     <newvalue>down</newvalue>
    </mapping>
    <mapping>
     <value>1</value>
     <newvalue>up</newvalue>
    </mapping>
   </mappings>
  </value_map>
 </value_maps>
</zabbix_export>在zabbix前端页面点击配置→模板→导入:
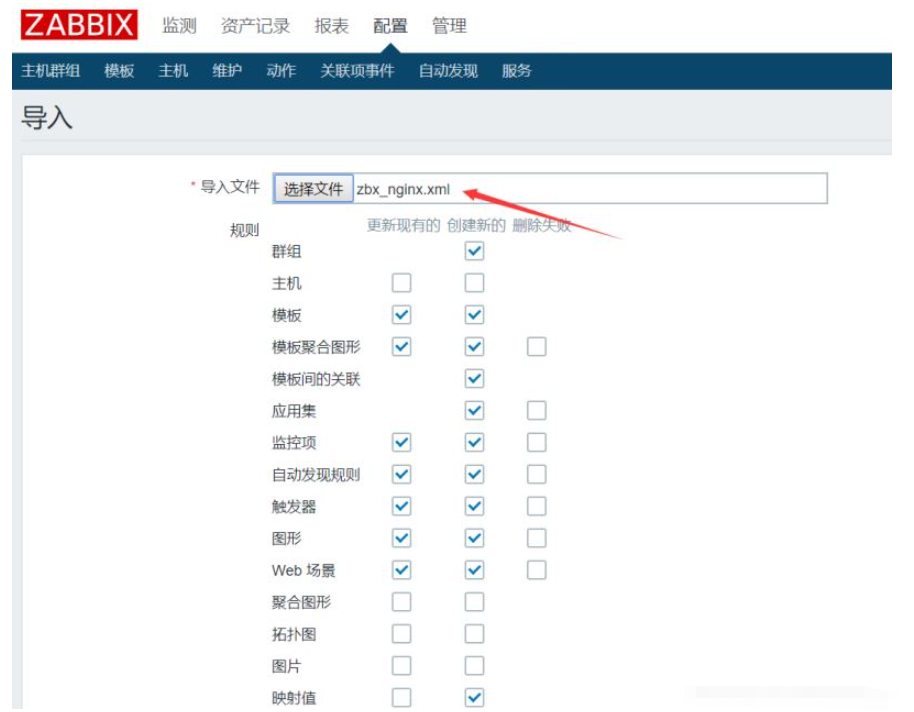
#导入刚才创建的xml文件即可
导入成功后在主机列表页面选择被监控的机器(b机器)链接该模板即可开始监控nginx
zabbix监控tomcat
a机器:zabbix服务端(192.168.234.128) b机器:zabbix客户端(192.168.234.125)
在a机器安装zabbix-java-gateway:
[root@zabbix ~]# wget https://mirrors.tuna.tsinghua.edu.cn/zabbix/zabbix/4.0/rhel/7/x86_64/zabbix-java-gateway-4.0.14-1.el7.x86_64.rpm

[root@zabbix ~]# yum -y localinstall zabbix-java-gateway-4.0.14-1.el7.x86_64.rpm
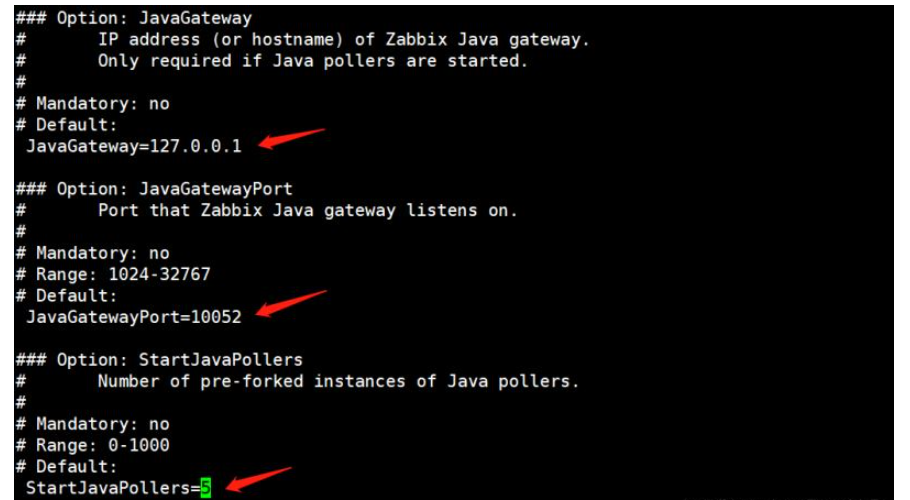
编辑gateway配置文件:
[root@zabbix ~]# vi /etc/zabbix/zabbix_java_gateway.conf
去掉listen_ip、listen_port(监听端口)、start_pollers(进程数)的注释符号#:
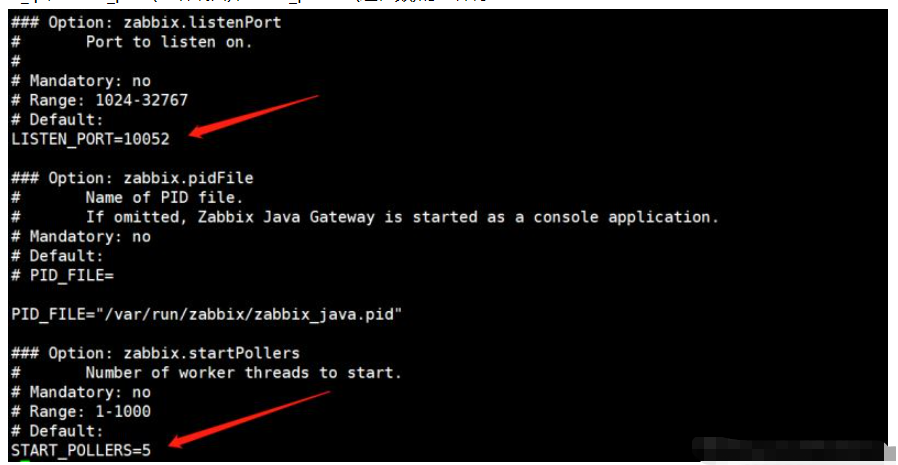
#listen_ip定义被监控机器的地址,不指定默认监听全部机器
编辑server配置文件:
[root@zabbix ~]# vi /etc/zabbix/zabbix_server.conf
定义以下3个配置参数:
启动zabbix-java-gateway服务:
[root@zabbix ~]# systemctl start zabbix-java-gateway
重启zabbix-server服务:
[root@zabbix ~]# systemctl restart zabbix-server
查看监听端口:
[root@zabbix ~]# netstat -lntp |grep java
tcp6  0  0 :::10052    :::*     listen  8706/java
开启jmx
在b机器编辑tomcat配置文件:
[root@centos ~]# vi /usr/local/tomcat/bin/catalina.sh
添加以下内容:
export catalina_opts="$catalina_opts -dcom.sun.management.jmxremote
-djava.rmi.server.hostname=192.168.234.125
-dcom.sun.management.jmxremote.port=9999
-dcom.sun.management.jmxremote.ssl=false
-dcom.sun.management.jmxremote.authenticate=false"
#hostname定义b机器地址,端口9999(默认12345)
重启tomcat:
[root@centos ~]# /usr/local/tomcat/bin/shutdown.sh

[root@centos ~]# /usr/local/tomcat/bin/startup.sh
查看监听端口9999:
[root@centos ~]# netstat -lntp |grep 9999
tcp6  0  0 :::9999     :::*     listen  25861/java
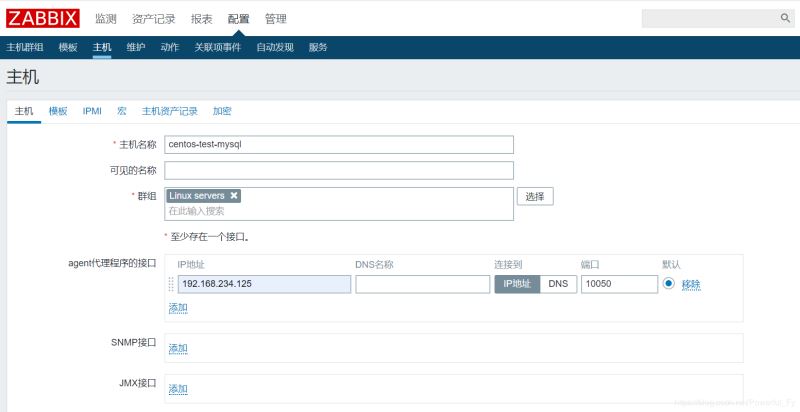
进入zabbix前端页面添加主机:
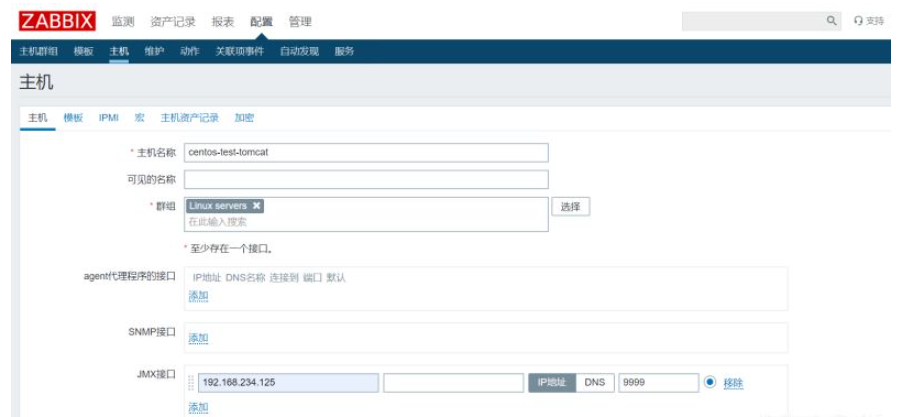
#与普通情况添加监控主机不同,监控b机器的tomcat需要配置jmx接口
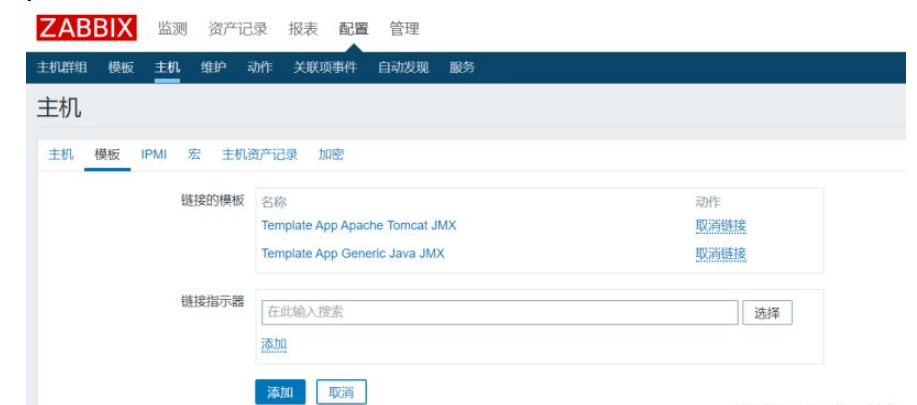
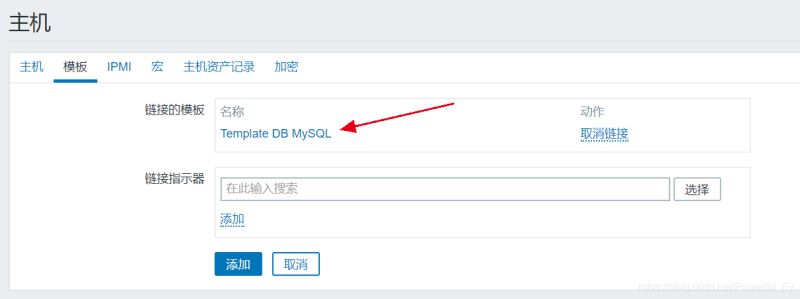
模板链接jmx相关的两个模板:
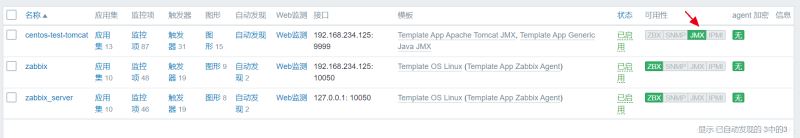
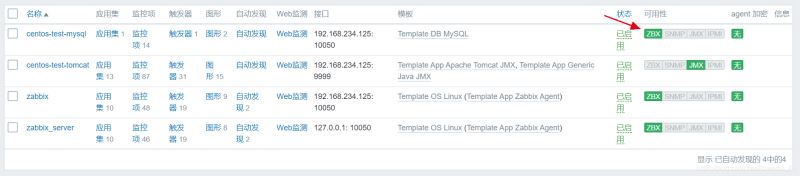
当jmx图标变绿即表示配置成功:
zabbix监控mysql
a机器:zabbix服务端(192.168.234.128) b机器:zabbix客户端(192.168.234.125)
zabbix_agent定义mysql监控的配置文件:/etc/zabbix/zabbix_agentd.d/userparameter_mysql.conf
在b机器登录mysql创建用户:
mysql> grant usage,process,replication client on *.* to zamysql@'localhost' identified by 'zamysql';
创建配置文件指定的目录:
[root@centos ~]# mkdir /var/lib/zabbix
创建my.cnf文件:
[root@centos ~]# vi /var/lib/zabbix/.my.cnf
#需要注意该文件是隐藏文件
添加以下内容:
[mysql]
host=localhost
user=zamysql
password='zamysql'
socket=/tmp/mysql.sock

[mysqladmin]
host=localhost
user=zamysql
password='zamysql'
socket=/tmp/mysql.sock
在a机器测试:
[root@zabbix ~]# zabbix_get -s 192.168.234.125 -p 10050 -k mysql.ping
1
[root@zabbix ~]# zabbix_get -s 192.168.234.125 -p 10050 -k mysql.version
mysql ver 14.14 distrib 5.6.43, for linux-glibc2.12 (x86_64) using editline wrapper
[root@zabbix ~]# zabbix_get -s 192.168.234.125 -p 10050 -k mysql.size
10240
#已成功获取数据
在zabbix前端页面添加主机:
监控模板选择db mysql:
zbx标准变为绿色表示成功:
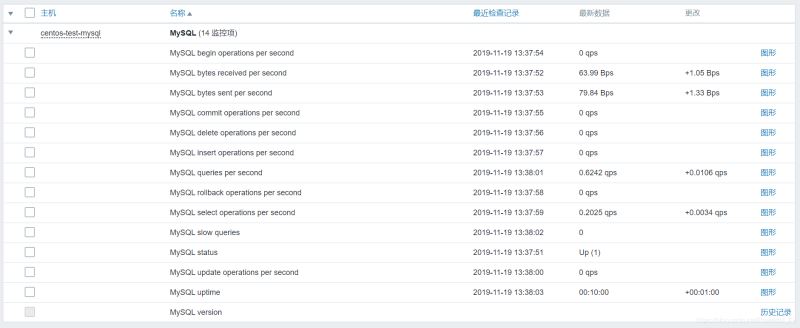
在监测→最新数据页面即可查看mysql监控数据:
The above is the detailed content of How to monitor Nginx/Tomcat/MySQL with zabbix. For more information, please follow other related articles on the PHP Chinese website!

Hot AI Tools

Undresser.AI Undress
AI-powered app for creating realistic nude photos

AI Clothes Remover
Online AI tool for removing clothes from photos.

Undress AI Tool
Undress images for free

Clothoff.io
AI clothes remover

AI Hentai Generator
Generate AI Hentai for free.

Hot Article
Hot Tools

Notepad++7.3.1
Easy-to-use and free code editor

SublimeText3 Chinese version
Chinese version, very easy to use

Zend Studio 13.0.1
Powerful PHP integrated development environment

Dreamweaver CS6
Visual web development tools

SublimeText3 Mac version
God-level code editing software (SublimeText3)
Hot Topics
 1378
1378
 52
52

 How to start nginx in Linux
Apr 14, 2025 pm 12:51 PM
How to start nginx in Linux
Apr 14, 2025 pm 12:51 PM
Steps to start Nginx in Linux: Check whether Nginx is installed. Use systemctl start nginx to start the Nginx service. Use systemctl enable nginx to enable automatic startup of Nginx at system startup. Use systemctl status nginx to verify that the startup is successful. Visit http://localhost in a web browser to view the default welcome page.
 How to start nginx server
Apr 14, 2025 pm 12:27 PM
How to start nginx server
Apr 14, 2025 pm 12:27 PM
Starting an Nginx server requires different steps according to different operating systems: Linux/Unix system: Install the Nginx package (for example, using apt-get or yum). Use systemctl to start an Nginx service (for example, sudo systemctl start nginx). Windows system: Download and install Windows binary files. Start Nginx using the nginx.exe executable (for example, nginx.exe -c conf\nginx.conf). No matter which operating system you use, you can access the server IP
 How to configure nginx in Windows
Apr 14, 2025 pm 12:57 PM
How to configure nginx in Windows
Apr 14, 2025 pm 12:57 PM
How to configure Nginx in Windows? Install Nginx and create a virtual host configuration. Modify the main configuration file and include the virtual host configuration. Start or reload Nginx. Test the configuration and view the website. Selectively enable SSL and configure SSL certificates. Selectively set the firewall to allow port 80 and 443 traffic.
 How to check whether nginx is started
Apr 14, 2025 pm 01:03 PM
How to check whether nginx is started
Apr 14, 2025 pm 01:03 PM
How to confirm whether Nginx is started: 1. Use the command line: systemctl status nginx (Linux/Unix), netstat -ano | findstr 80 (Windows); 2. Check whether port 80 is open; 3. Check the Nginx startup message in the system log; 4. Use third-party tools, such as Nagios, Zabbix, and Icinga.
 How to solve nginx403 error
Apr 14, 2025 pm 12:54 PM
How to solve nginx403 error
Apr 14, 2025 pm 12:54 PM
The server does not have permission to access the requested resource, resulting in a nginx 403 error. Solutions include: Check file permissions. Check the .htaccess configuration. Check nginx configuration. Configure SELinux permissions. Check the firewall rules. Troubleshoot other causes such as browser problems, server failures, or other possible errors.
 How to solve nginx403
Apr 14, 2025 am 10:33 AM
How to solve nginx403
Apr 14, 2025 am 10:33 AM
How to fix Nginx 403 Forbidden error? Check file or directory permissions; 2. Check .htaccess file; 3. Check Nginx configuration file; 4. Restart Nginx. Other possible causes include firewall rules, SELinux settings, or application issues.
 How to check whether nginx is started?
Apr 14, 2025 pm 12:48 PM
How to check whether nginx is started?
Apr 14, 2025 pm 12:48 PM
In Linux, use the following command to check whether Nginx is started: systemctl status nginx judges based on the command output: If "Active: active (running)" is displayed, Nginx is started. If "Active: inactive (dead)" is displayed, Nginx is stopped.
 How to solve the problem of nginx cross-domain
Apr 14, 2025 am 10:15 AM
How to solve the problem of nginx cross-domain
Apr 14, 2025 am 10:15 AM
There are two ways to solve the Nginx cross-domain problem: modify the cross-domain response header: add directives to allow cross-domain requests, specify allowed methods and headers, and set cache time. Use CORS modules: Enable modules and configure CORS rules that allow cross-domain requests, methods, headers, and cache times.
