 Technology peripherals
 AI
AI
 Application of causal recommendation technology in marketing and explainability
Application of causal recommendation technology in marketing and explainability

1. Uplifit gain sensitivity prediction
Regarding Uplift gain, the general business issues can be summarized as, Among the defined groups of people, marketers will want to know how much average revenue (lift, ATE, average treatment effect) the new marketing action T=1 can bring compared to the original marketing action T=0. Everyone will pay attention to whether the new marketing action is more effective than the original one.
In the insurance scenario, marketing actions mainly refer to the recommendation of insurance, such as the copywriting and products revealed on the recommendation module, with the goal of promoting various marketing strategies. Under the constraints of actions and constraints, find the group that has gained the most due to marketing actions and do Audience Targeting.

##First make a more ideal and perfect assumption: for each user i, You can know whether he buys the marketing action. If you buy it, you can think that Di in the formula is positive and the value is relatively large; if you don't buy it and are disgusted with marketing actions, Di may be relatively small or even negative. In this way, the effect of each user's individual treatment can be obtained.
# Regarding crowd division, you can see the four marketing quadrants in the picture above. What we are most concerned about is definitely the crowd of Persuadables in the upper left corner. Combined with the formula, the characteristic of this group of people is that when there are some marketing actions, they will buy it very much, that is, Yi > 0, and the value is relatively large. If no marketing action is taken for this group of people, it will be negative, or it will be relatively small, equal to 0. The Di of such a group of people will be relatively large.
Looking at the people in the other two quadrants, Sure things refer to whether these people will buy them regardless of marketing or not, so the benefits of marketing investment in this group of people The rate is relatively low. Sleeping dogs means that marketing will have some negative effects. It is best not to conduct marketing for these two groups.

But there is also a counterfactual dilemma here: Di is not that perfect. It is impossible for us to know whether a user is interested in treatment at the same time, that is, we cannot know the reaction of the same user to different treatments at the same time.
The most popular example is: Suppose there is a drug. After A takes it, A's reaction to the drug will be obtained. But they don’t know that if A doesn’t take the medicine, because A has already taken the medicine, this is actually a counterfactual existence.
#For the counterfactual, we made an approximate estimate. In the ITE (Individual Treatment Effect) estimation method, although a user cannot be found to experiment with his or her response to two treatments, user groups with the same characteristics can be found to estimate the response. For example, two people with the same Xi can be assumed to In the same feature space, they are approximately equivalent to a person.
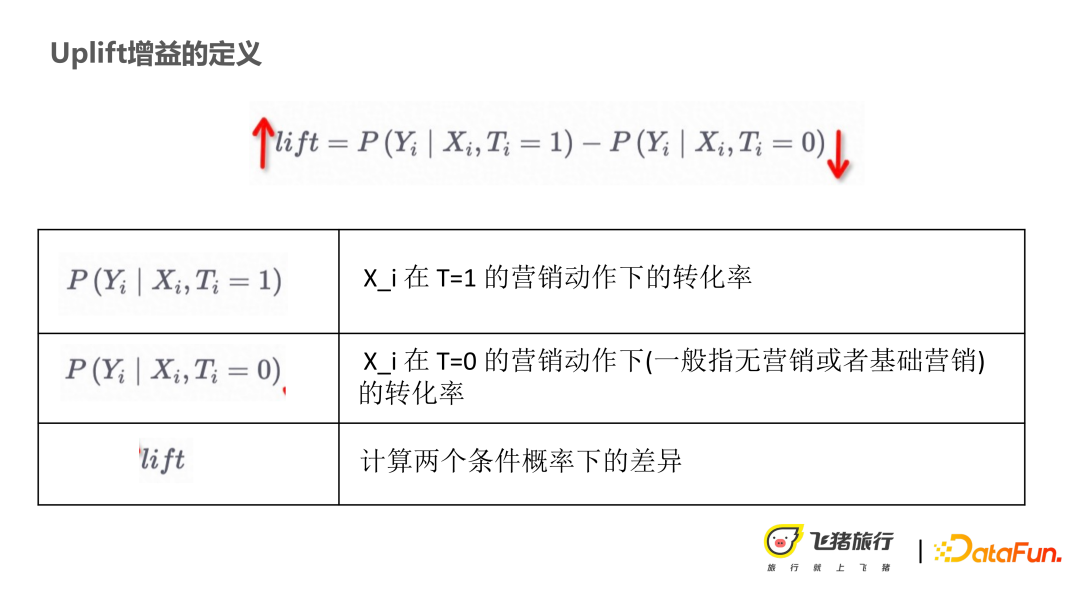
In this way, Di’s estimate is divided into three parts: (1) The conversion rate of Xi under the marketing action of T=1;(2)The conversion rate of Xi under the marketing action of T=0;(3)lift is a Difference, calculates the difference between two conditional probabilities. The higher the lift value of a user group, it means that this group of people is more willing to buy it. How to make lift higher? In the formula, the conversion rate of Xi under the marketing action of T=1 is increased, and the conversion rate of Xi under the marketing action of T=0 is smaller.
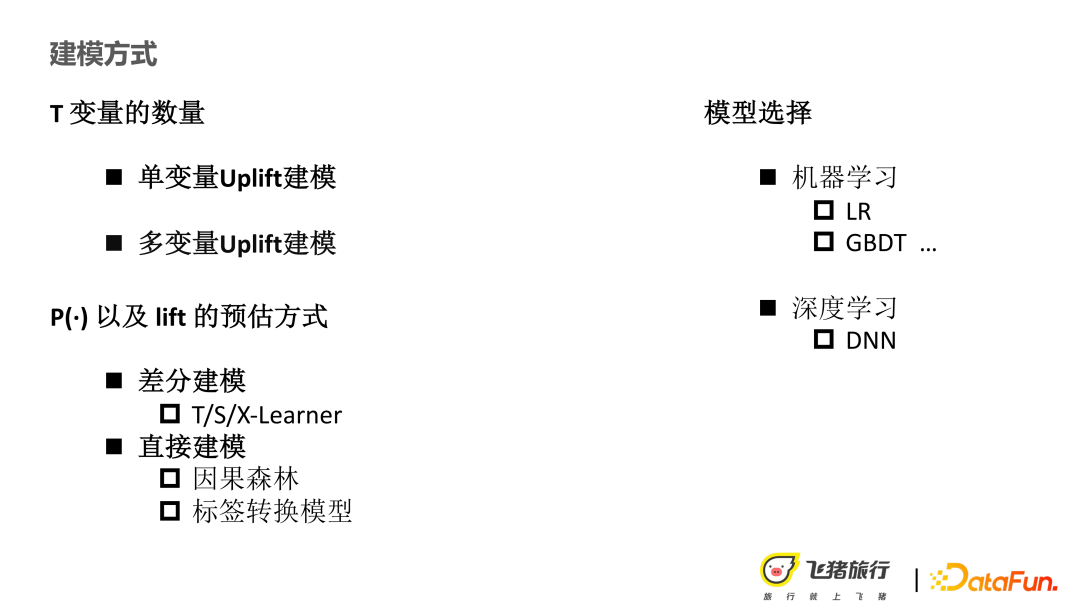
In terms of modeling methods, combined with the above formula, make some generalizations:
(1) Number of T variables , if there is not just one marketing action, but n marketing actions, then multi-variable Uplift modeling is used, otherwise it is univariate Uplift modeling.
(2) Prediction method of conditional probability P and lift: ① Through differential modeling, predict Estimate the P value and then find the lift value, which is indirect modeling. ② Through direct modeling, such as label conversion model, or causal forest, such as Tree base, LR, GBDT or some deep models.
2. Application of gain sensitivity
Gain sensitivity is mainly used in three applications: insurance product recommendation, red envelope recommendation, and copywriting recommendation.
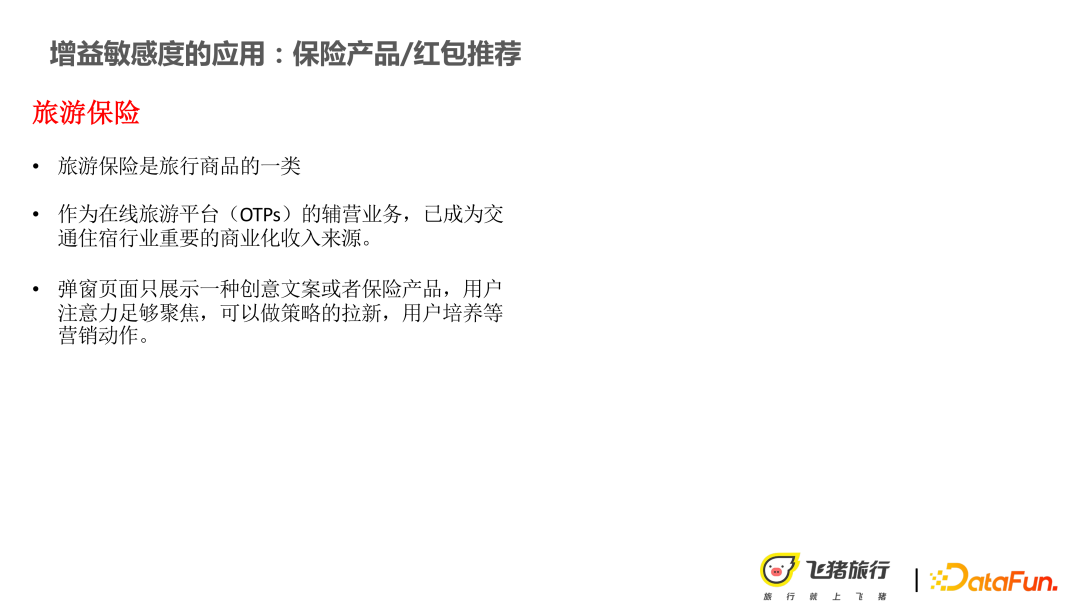
First of all, let’s introduce the positioning of travel insurance on Fliggy. Travel insurance is a category of travel products, but it appears more often in tie-in links with main products. For example, when we book air tickets and hotels, the main purchase intention is: hotels, air tickets, and train tickets. At this time, the APP will ask you whether you want to buy insurance. Therefore, insurance is an ancillary business, but it has now become a very important source of commercial income in the transportation and accommodation industry.
The main scope of this article is the pop-up page: the pop-up page is a page that will pop up when Fliggy APP pulls down the cashier. This page only A creative copy will be displayed, and only one insurance product can be displayed. This is different from the previous details page, which can display multiple types of products and insurance prices. Therefore, this page will focus the user's attention here enough, and it can do some new promotions and even some marketing actions for user education and training.
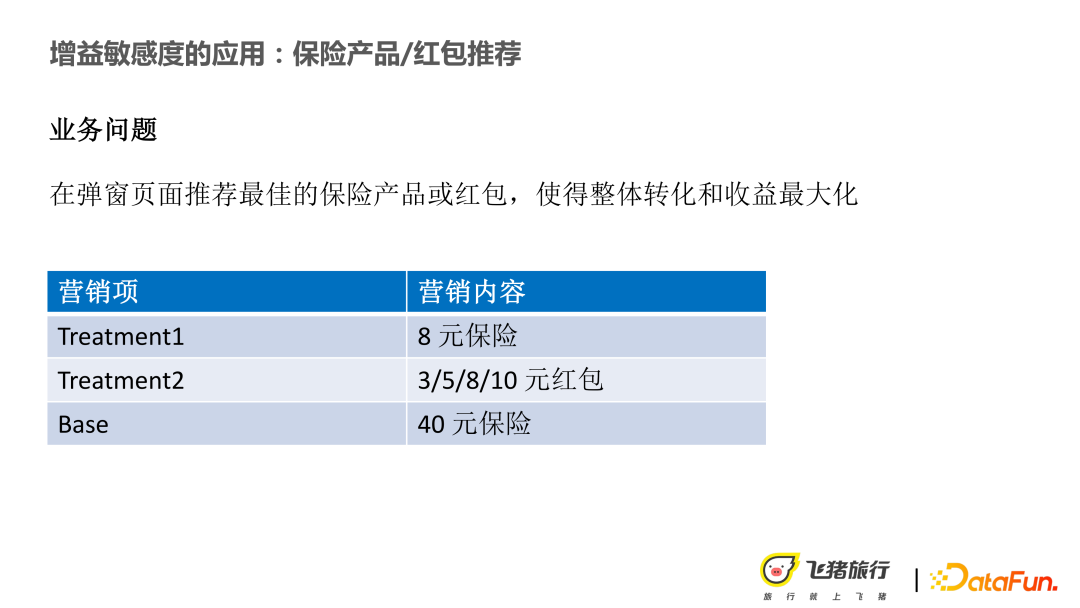
The current business problems encountered are: on the pop-up page, we need to recommend An optimal insurance product or red envelope can maximize the overall conversion or revenue. More specifically, it is to achieve a business goal of attracting new customers or achieving higher conversions. The business revenue goal is to increase the conversion rate without reducing revenue.
Under the above constraints, there are several marketing items: (1) recommend an entry-level low-price insurance to users; (2) another treatment , recommend some red envelopes, mainly to do some new operations. And Base is the original price of insurance.
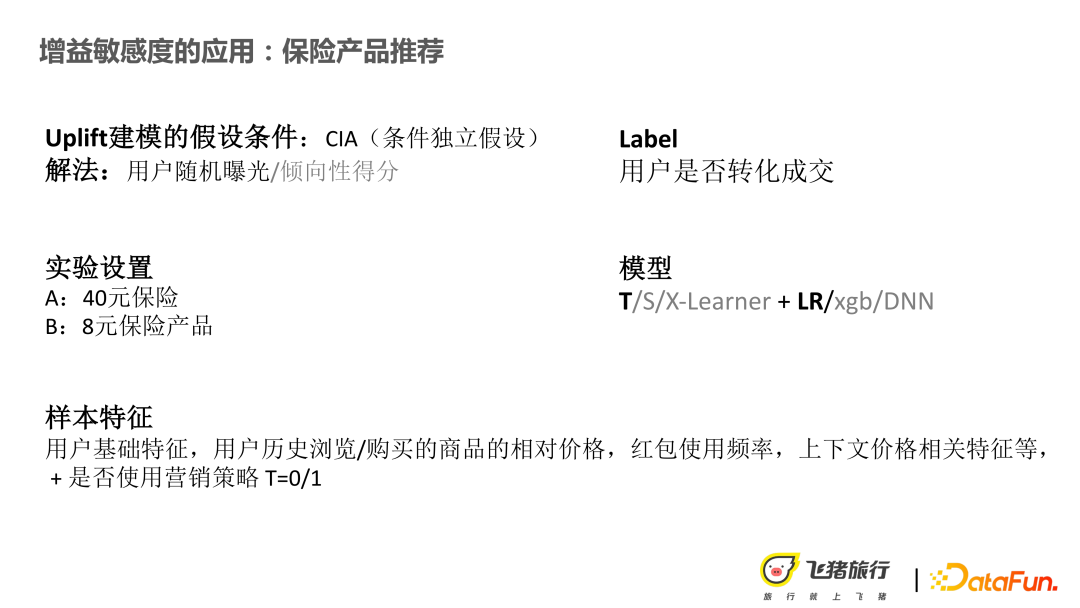
When modeling, there are some assumptions: the assumption of conditional independence. Refers to the treatment marketing action. When modeling uplift collection, the samples obey the assumption of independence, and the user's various characteristics are independent of each other. For example, red envelopes cannot be distributed differently by age. For example, there should be less distribution among young people and more distribution among older people. This will cause the sample to be biased. Therefore, the proposed solution is to let users expose products randomly. Similarly, you can also calculate the propensity score to obtain a homogeneous user group for comparison.
In terms of experimental design, AB experiment: A is to invest according to the original strategy, which may be 40 yuan of insurance, or It could be pricing for operations to do insurance, or a pricing for the original model. Barrel B, low-priced insurance placement.
#Label: Whether the user is converted or not.
Model: T/S/X-learner and various types of Meta models.
Sample structure: The appeal is to characterize whether users are more interested in this kind of low-price insurance. It is necessary to have enough features to characterize the user's sensitivity to price. But in fact, like auxiliary products, there is no relatively strong intention. Therefore, it is difficult for us to see how much insurance the user likes or how much insurance he will buy from the user's historical browsing and purchase records. We can only look at the data within the domain of the main business or some other Fliggy APPs browsed by users. We will also look at the frequency of use of user red envelopes and the proportion of red envelope consumption. For example, will users only send red envelopes in the first few days? Only then was the transformation carried out on Fliggy.
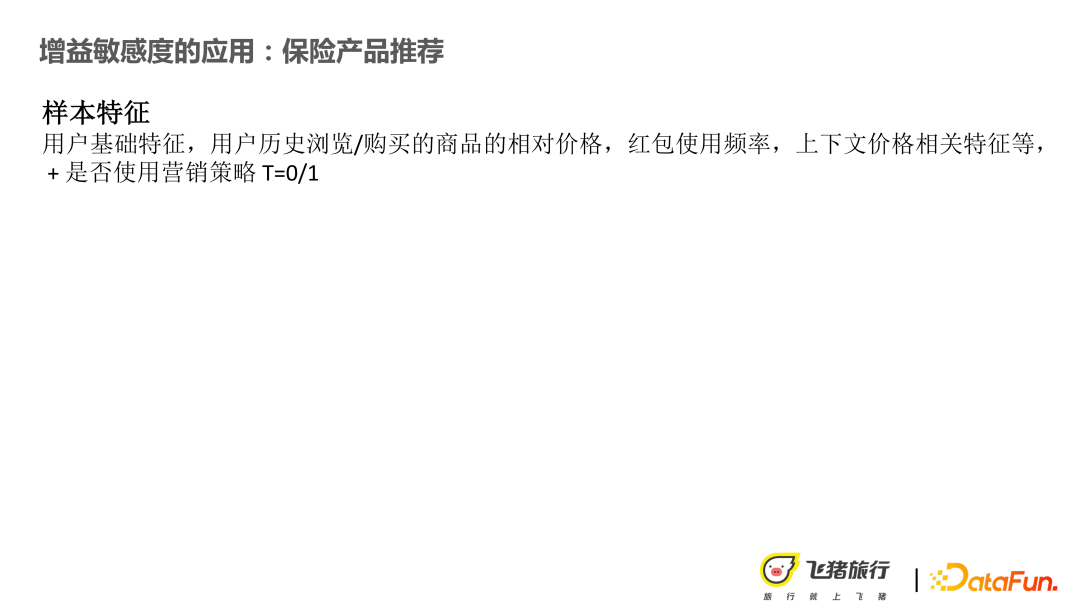
Based on the construction of the above feature samples, the feature importance and interpretability are also carried out analysis. It can be seen from the tree base model that it is relatively sensitive to some time, price variable, and age variable characteristics.
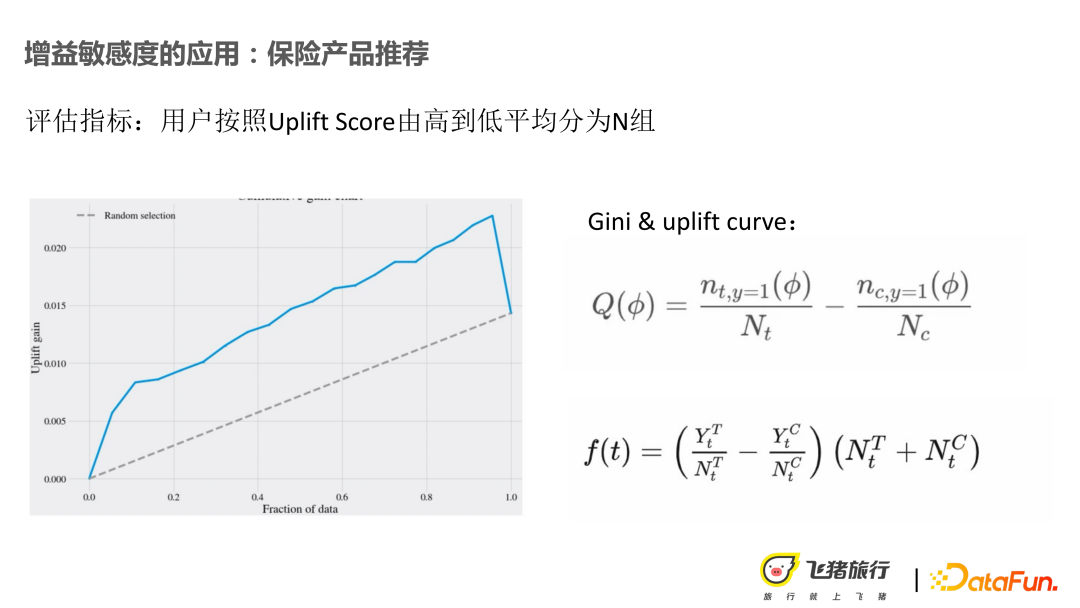
Calculation methods of evaluation indicators: Gini and Accumulated Gini. Divide Uplift into n groups, and calculate a Gini score for each group, as shown in the first formula in the figure above. Under this group, the conversion rate after the user is mapped to the test bucket and the base bucket is obtained, and then the Gini is calculated. By analogy to Uplift Gini, by calculating the income points under different thresholds, it helps us make a threshold determination.
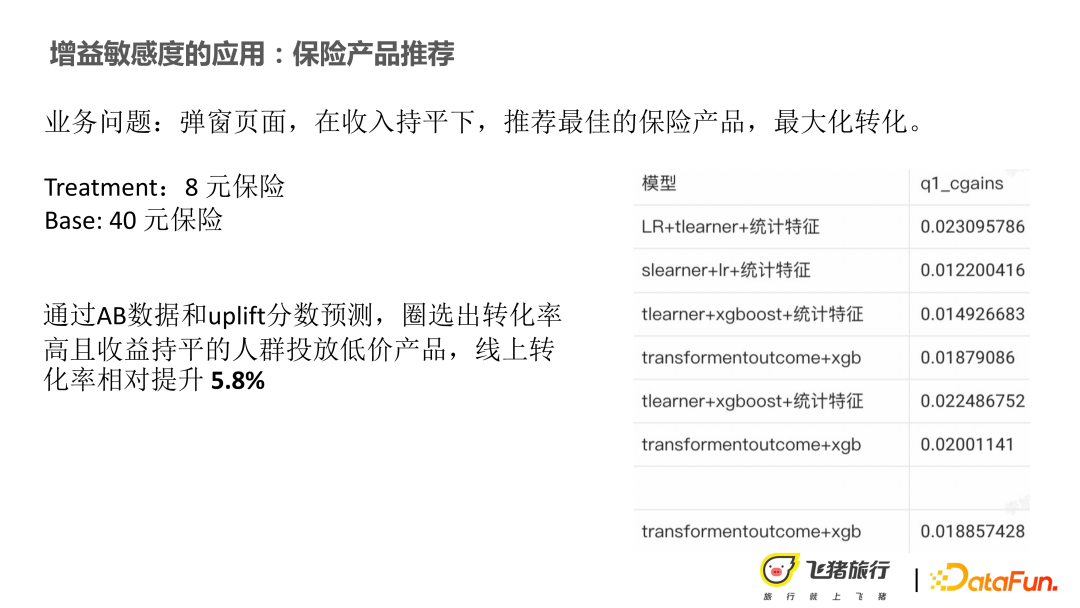
Available offline, the best performing model is LR T-Learner, which actually does not meet the original expectations. . After thinking about this issue, maybe the problem lies in the user's construction of insurance-related price characteristics, which is not enough to describe. Because we have also done some user research, such as the user's personality and sensitivity to insurance. Some user portrait data in the APP domain can show the user's interest in a non-physical product. But in the end, it was still based on this score to delineate the groups for distribution, and the online base bucket increased by 5.8%.
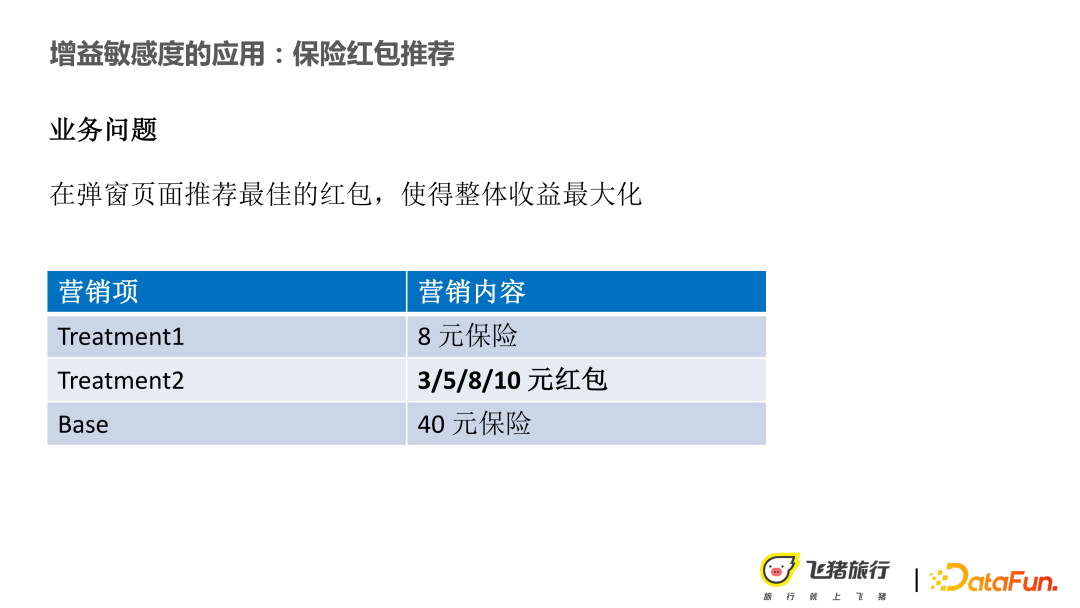
In terms of red envelope recommendations, we can also base on the 40 yuan insurance, Issue an insurance of 3/5/8/10 yuan.

We have a business goal which is incremental ROI. The formula definition is: test bucket Can the incremental GMV obtained by subtracting the GMV of the base bucket from the GMV cover the marketing expenses dropped in the test bucket? If the incremental ROI is greater than 1, it means that marketing is not losing money. So in this scenario, our requirement is not to lose money. Before we use the Uplift model, the operation students will first do a wave of delivery. Among their seed groups, the ROI is between 0.12-0.6, so one of our requirements is to have a higher ROI than this without losing money.
#Through the dismantling of the above goals, the problem is finally transformed into the estimation of the user’s conversion rate and the Uplift estimation, as shown in the formula below the above figure.
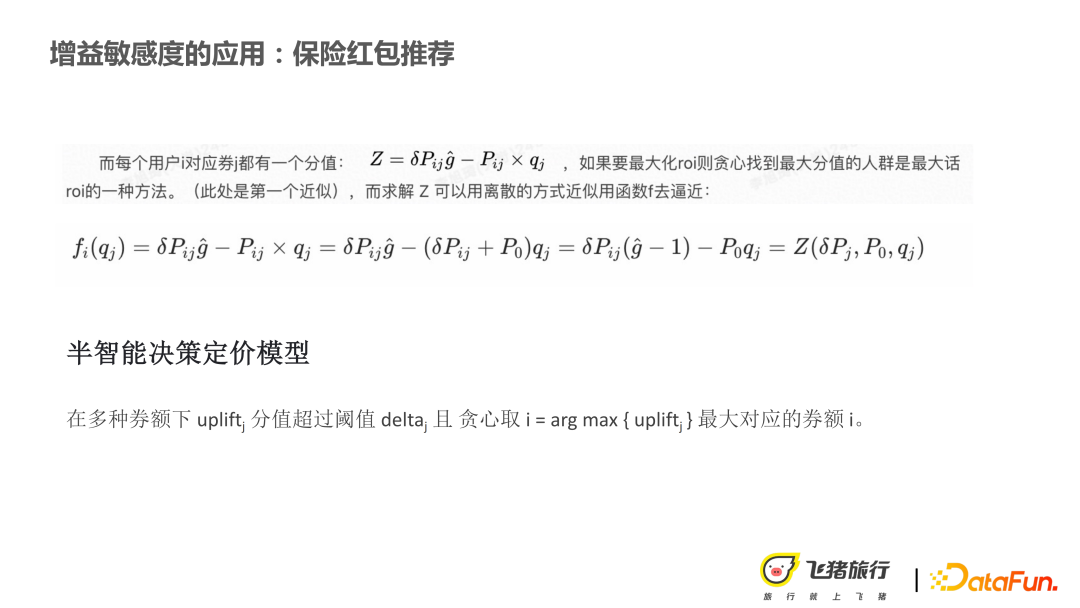
Finally, after a series of changes, we actually returned to solving the Uplift value and non-purchase probability. The non-purchase probability refers to the conversion rate of users when no coupons are issued. If you want to make the ROI just mentioned higher, it means you need to find a user group. The smaller the P0, the better, and the higher the Uplift value, the better.
The first version of the model is a semi-intelligent decision-making model: based on the Uplift value calculated under different coupon amounts, and then observing the effect of the treatment after it goes online, The threshold is fixed, and each threshold is set to cover costs.
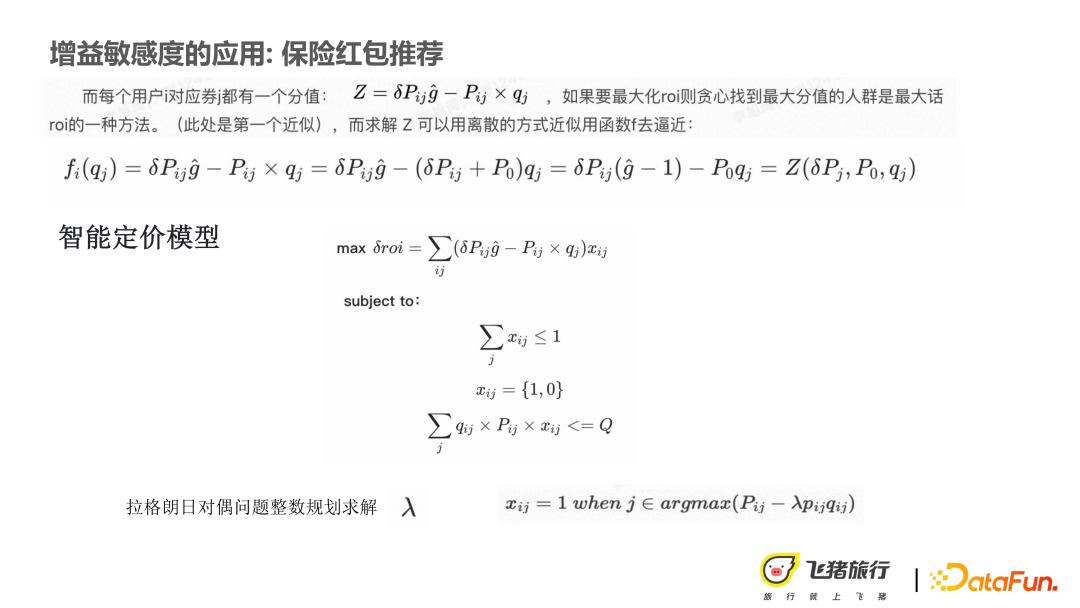
The second version is an intelligent pricing model: it draws on the solution of dual problems and constraints The issuance of coupons must be less than or equal to 1, that is, Xij
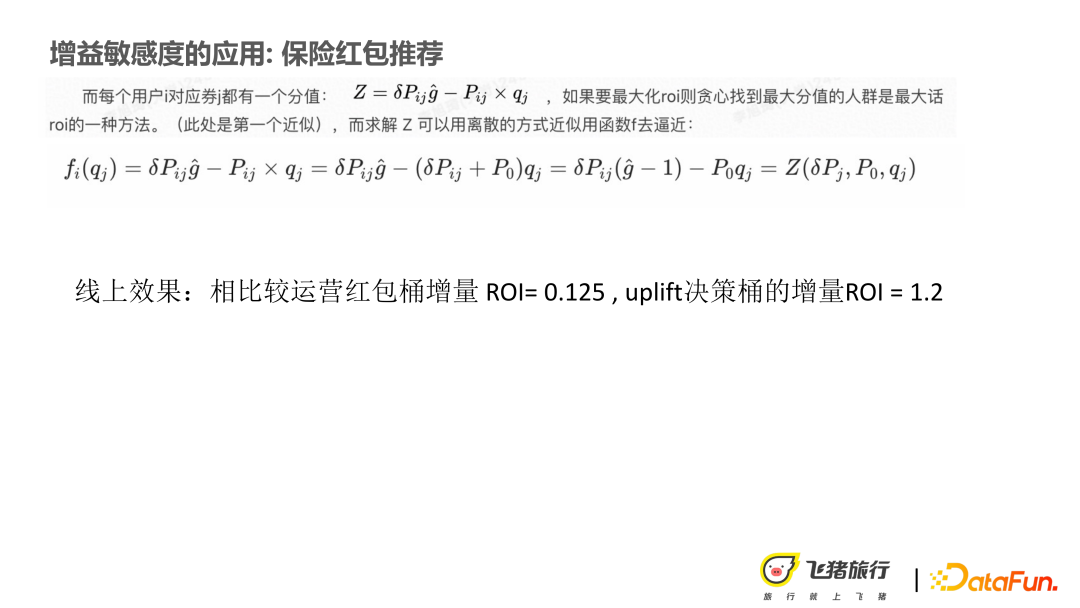
Using the pricing model compared to the red envelope delivery in the original operating bucket, the incremental ROI can reach 1.2.
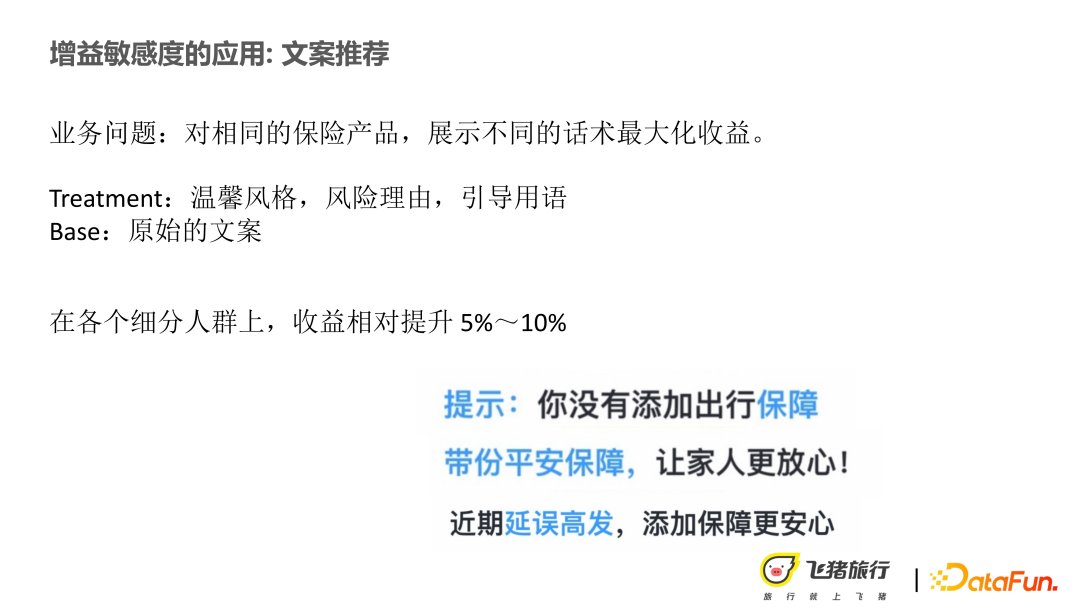
The recommendation in the copywriting is similar to the previous product recommendation and red envelope recommendation ideas. We will find that some users have different preferences for different styles of copywriting, so we will structure it, such as a warm "with safety guarantee", or some warnings about risks. It will also be found that there are relatively large and obvious differences among different segmented groups. From the perspective of feature importance, warm sentences may be effective for those born in the 1980s or some older people, while copywriting with a reason-based nature may be more effective. , will be more suitable for young people. In terms of the importance of characteristics of segmented groups, and at the same time trying to personalize copywriting, there is a relative improvement of 5% to 10%.
##3. Bayesian Causal Network
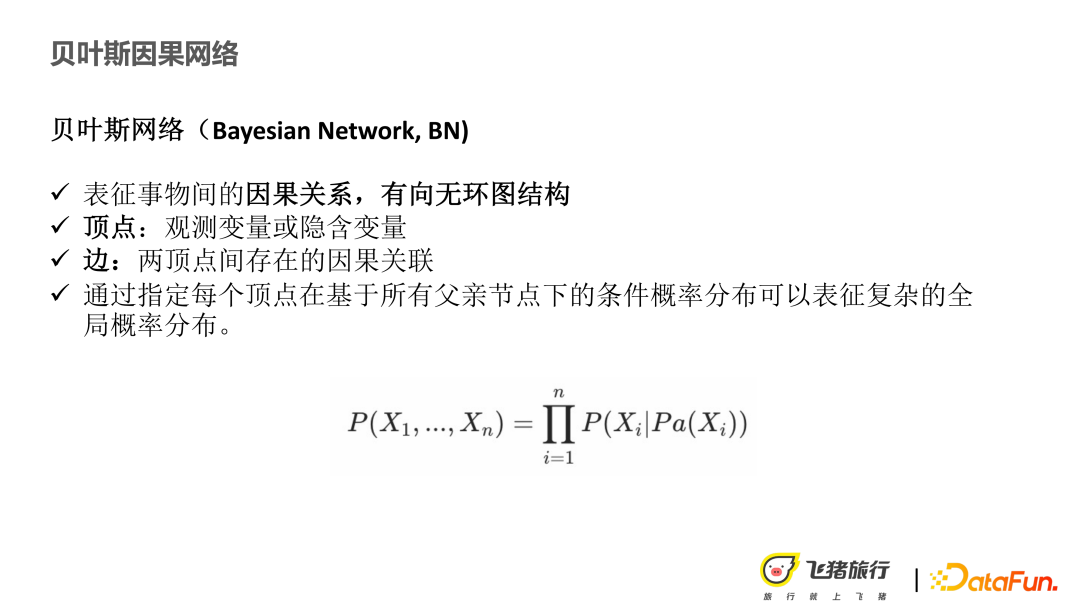
##Bayesian Causal Network# Mainly represents the causal relationship between transactions and the structure of a directed five-ring graph. First, let’s briefly introduce why Bayesian networks are used. Under different recommended copywriting, we want to know why users are interested in the copywriting, or why they can convert, and what are the hidden variables behind it. Therefore, when constructing an interpretable network, the vertices are mainly observed variables or implicit variables; the edges refer to the causal relationships between two vertices, and the relationships can be calculated through the conditional probabilities between nodes. In a Bayesian network, the final network structure is obtained by multiplying the probability values of each vertex under the conditions of all parent nodes.
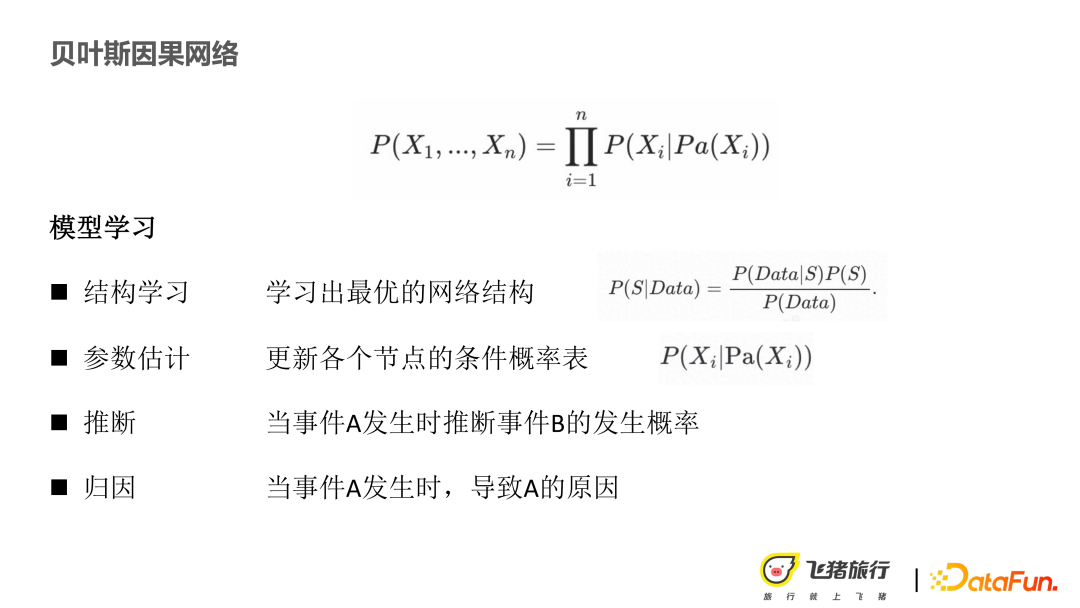
① Structure learning: Based on samples, how to learn a better Bayesian network is mainly based on posteriori, as shown in the formula above. If the probability value of structure is higher, the network is considered to be the most learned. excellent.
② After obtaining the structure, how to know the conditional probability value of the node in the network and its parameters. ③ Inference: When event A occurs, the probability of event B occurring. ④ Attribution: When event A occurs, what are the reasons that caused it to occur.4. Portrait decision path construction and explainability application
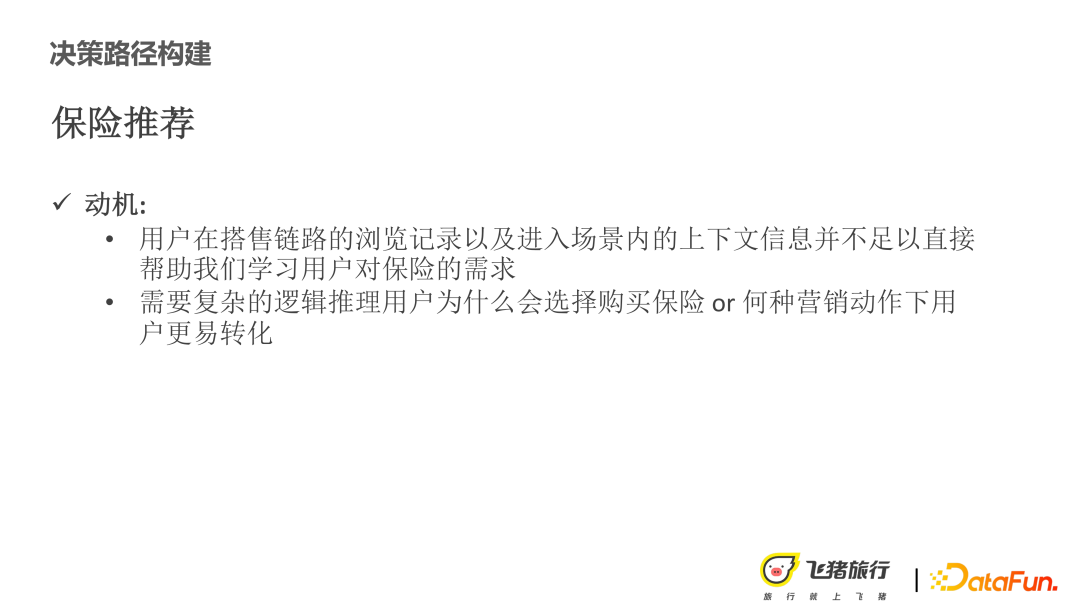
mentioned above Yes, the insurance recommendation scenario is different from the search recommendation. Insurance recommendation is an auxiliary business, and the user is not subjective. That is, before coming to this module, his browsing history in the APP domain has nothing to do with what kind of insurance or insurance the user has. The copywriting is interesting and there is no homogeneous relevance. In the search, if you enter family-friendly hotels, you will know that users have demand for hotels with parent-child labels. In the auxiliary camp scenario, a complex reasoning process is required to know what kind of Treatment action is effective. For example, through network mining, it will be found that sales of delayed insurance will be better when the weather is bad.

How to model and construct the nodes and edges in the network into the following types :
① User node uses the basic information of user portraits such as age and gender as a discrete variable , becomes a node.
② Event node, because the insurance scenario is more sensitive to events than many other product recommendations , for example, during weather or festivals, users may be more sensitive to delay insurance or certain insurances with specific attributes.
③ Creative nodes, such as warm guiding copywriting, dynamic digital copywriting, etc. will have different effects .
Based on the above three categories of nodes, perform conditional probability calculations to complete the construction of the graph.
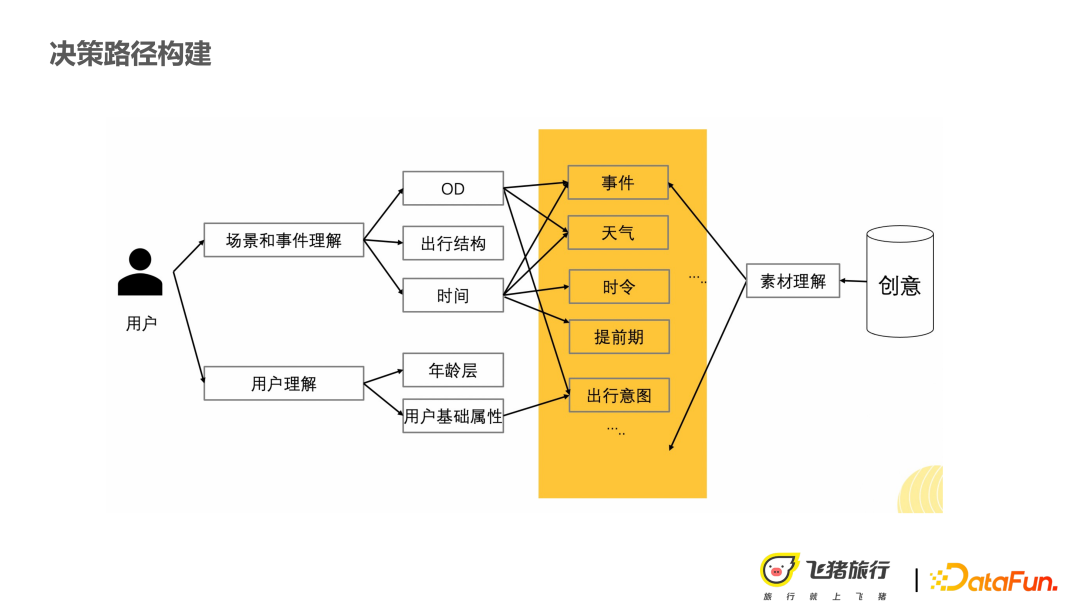
The users just mentioned gain understanding and creative understanding by building scenarios and events. Finally, all node types are unified into the structure shown in the figure above.

After obtaining the nodes, perform structural learning and use Hockman scoring function grade search. This process mainly involves calculating the posterior probability value of the network after given the data and network structure, and evaluating whether the network is effective.
When doing Hockman scoring function, there may be multiple variables, discrete or continuous. When constructed, they become a discrete variable to facilitate subsequent interpretation and modeling. We will assume that each variable conforms to the Dirichlet distribution, apply it to the sample to update the posterior, then calculate the posterior value of each node, multiply the probabilities between nodes, and obtain the score of the structure. It is relatively common. If you are interested, you can learn more about this method later. Since the network structure is relatively complex, the greedy search method is used in the entire network. Parameter estimation is relatively simple, and the conditional probability table of the node is updated based on the sample.

Interpretable application, based on structure and parameter updates, can be done in two parts Things:
① Infer what kind of decision the user may make based on various types of evidence, just like the examples mentioned above. You can use Likelihood weighting or Loopy Belief Propagation, these are some of the more common methods.
② Attribution, what is shown in the picture above is health insurance. For example, accident insurance is suddenly selling well. We really want to know the reason behind it. It is because some people like to buy it. Maybe the user’s consumption The reason for the high level of purchase is that the user is a newbie and has rarely flown before, or the user's destination has plateau attributes, which leads to purchase due to fear.
Finally, to summarize, causal inference plays a great role in the crowd and recommendation strategies of insurance product recommendations, red envelopes and copywriting marketing. At the same time, combined with the construction of Bayesian causal diagrams and visual explanations, it can provide some more meaningful decisions to the business, allowing them to continuously update strategies or copywriting, or make some directional changes. Bayesian causal diagram also provides new ideas for feature selection.
5. Q&A session
Q1: Has the Uplift model adopted by Fliggy Insurance Marketing been verified after its implementation? Before introducing the causal inference model, what technology did Feishu Insurance use for marketing? What are the limitations? What is the most obvious improvement after importing this causal inference model?
A1: ① The verification is there because the effect has been improved on the online AB.
② Before importing the causal model, for example, the initial strategy in the red envelope scenario is conversion rate estimation. If you can predict a user group that will not convert originally, and conduct marketing operations on them, you can ensure that the marketing cost can be controlled.
③ Limitations: The user’s conversion rate may not be high, which means that even if you give him a red envelope, he will not convert. So these are some of the problems we encountered before.
④ After importing causal model inference, the most obvious improvement should be in user flexibility. After using causal inference technology, we can have a clearer understanding of users and a clearer judgment on user group seeds.
#Q2: How to choose the features of the causal inference model? Which features are most important in the scenario?
#A2: If a large number of features are selected in the first step, the effect may not be very good. In the initial selection, we use a single variable to see if there is a particularly strong correlation between the variable and the gain, and then put it in. Of course, you can see on the tree model later that features are scored and then filtered, which is a basis for our judgment.
#Q3: Does selection bias appear in the data during differential modeling? T-Learner can't deal with this kind of problem? Why is AUUC not used when evaluating? What are the latent variables of Bayesian causal networks?
A3: ① Differential modeling, which will lead to an error accumulation.
② T-learner mainly passes offline evaluation. We were quite confused about this issue at the time. In summary, we felt that it might be because there was not a very strong feature to directly characterize the gain. Therefore, the results obtained later on some traditional models are not very bad. This is just an evaluation of the complex model and the simple model. The simple model may be more robust.
③ AUUC In fact, we also use it, but it’s actually not much different.
④ Observed variables may refer to variables that are observable in the data, while hidden variables refer to the implicit variables that we can describe in the observed data. variable. For example, personality, of course, has not been used in the Internet.
#Q4: Have you tried using a matching method followed by a regression method in practice? If so, what is the effect?
A4: Haven’t tried it yet.
Q5: What is the direction of your subsequent exploration? For example, we are currently exploring the direction of insurance recommendations.
#A5: Causal inference was one of our tasks last year. This year it is mainly on the recommendation of creative copywriting.
The above is the detailed content of Application of causal recommendation technology in marketing and explainability. For more information, please follow other related articles on the PHP Chinese website!

Hot AI Tools

Undresser.AI Undress
AI-powered app for creating realistic nude photos

AI Clothes Remover
Online AI tool for removing clothes from photos.

Undress AI Tool
Undress images for free

Clothoff.io
AI clothes remover

AI Hentai Generator
Generate AI Hentai for free.

Hot Article

Hot Tools

Notepad++7.3.1
Easy-to-use and free code editor

SublimeText3 Chinese version
Chinese version, very easy to use

Zend Studio 13.0.1
Powerful PHP integrated development environment

Dreamweaver CS6
Visual web development tools

SublimeText3 Mac version
God-level code editing software (SublimeText3)

Hot Topics
 1382
1382
 52
52
 I Tried Vibe Coding with Cursor AI and It's Amazing!
Mar 20, 2025 pm 03:34 PM
Vibe coding is reshaping the world of software development by letting us create applications using natural language instead of endless lines of code. Inspired by visionaries like Andrej Karpathy, this innovative approach lets dev
 Top 5 GenAI Launches of February 2025: GPT-4.5, Grok-3 & More!
Mar 22, 2025 am 10:58 AM
February 2025 has been yet another game-changing month for generative AI, bringing us some of the most anticipated model upgrades and groundbreaking new features. From xAI’s Grok 3 and Anthropic’s Claude 3.7 Sonnet, to OpenAI’s G
 How to Use YOLO v12 for Object Detection?
Mar 22, 2025 am 11:07 AM
YOLO (You Only Look Once) has been a leading real-time object detection framework, with each iteration improving upon the previous versions. The latest version YOLO v12 introduces advancements that significantly enhance accuracy
 Best AI Art Generators (Free & Paid) for Creative Projects
Apr 02, 2025 pm 06:10 PM
The article reviews top AI art generators, discussing their features, suitability for creative projects, and value. It highlights Midjourney as the best value for professionals and recommends DALL-E 2 for high-quality, customizable art.
 Is ChatGPT 4 O available?
Mar 28, 2025 pm 05:29 PM
ChatGPT 4 is currently available and widely used, demonstrating significant improvements in understanding context and generating coherent responses compared to its predecessors like ChatGPT 3.5. Future developments may include more personalized interactions and real-time data processing capabilities, further enhancing its potential for various applications.
 Which AI is better than ChatGPT?
Mar 18, 2025 pm 06:05 PM
The article discusses AI models surpassing ChatGPT, like LaMDA, LLaMA, and Grok, highlighting their advantages in accuracy, understanding, and industry impact.(159 characters)
 How to Use Mistral OCR for Your Next RAG Model
Mar 21, 2025 am 11:11 AM
Mistral OCR: Revolutionizing Retrieval-Augmented Generation with Multimodal Document Understanding Retrieval-Augmented Generation (RAG) systems have significantly advanced AI capabilities, enabling access to vast data stores for more informed respons
 Top AI Writing Assistants to Boost Your Content Creation
Apr 02, 2025 pm 06:11 PM
The article discusses top AI writing assistants like Grammarly, Jasper, Copy.ai, Writesonic, and Rytr, focusing on their unique features for content creation. It argues that Jasper excels in SEO optimization, while AI tools help maintain tone consist


