 Operation and Maintenance
 Linux Operation and Maintenance
 How to check the network speed and traffic usage occupied by a process in Linux
How to check the network speed and traffic usage occupied by a process in Linux
There are three commands vnstat, iftop and nethogs (recommended)
all require additional installation of software using yum or apt-get
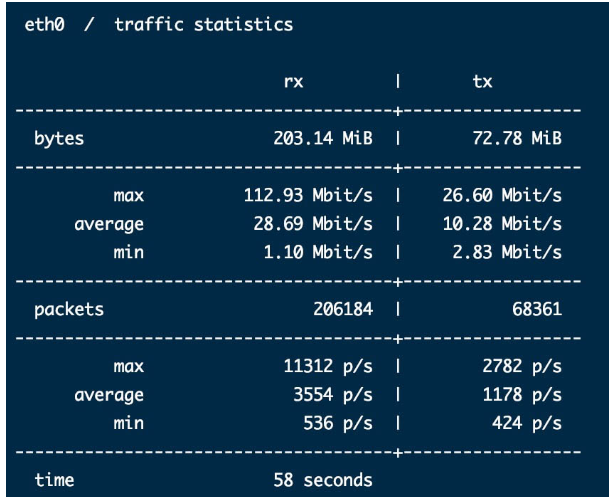
1. Use vnstat and view the interface Statistical report
vnstat -i eth0 -l #实时流量情况
There are other commands to use --help to view

After ctrl c ends, the traffic statistics results during the monitoring period will be displayed

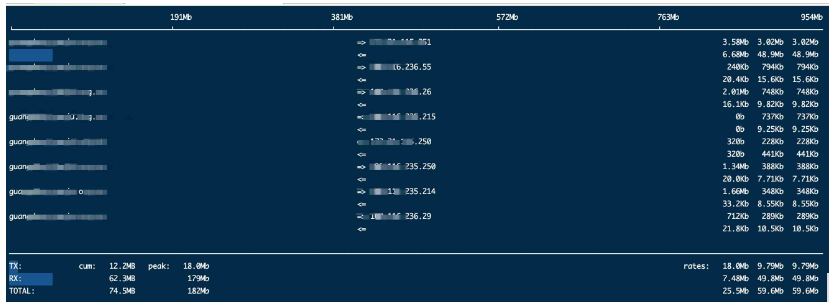
2. Use iftop to check bandwidth usage
iftop can be used to monitor the real-time traffic of the network card (you can specify the network segment), reversely analyze IP, and display port information Wait
Command usage:
-iSet the monitored network card, such as: # iftop -i eth2-BDisplay traffic in bytes (default is bits), such as: # iftop -B-nmakes the host information directly display the IP by default, such as: # iftop -n-Nmakes the port information directly display the port number by default, For example: # iftop -N
Omit other... #Press n to switch to display the IP or host name of this machine;
Press s to switch whether to display the host information of this machine;
Press d Switch whether to display the host information of the remote target host;
Press t to switch the display format to 2 lines/1 line/only send traffic/only receive traffic;
Press N to switch to displaying the port number or port service name;
Press S to switch whether to display the port information of the machine;
-
Press D to switch whether to display the port information of the remote target host;
Press p to switch whether to display the port information;
Omit others …… Bandwidth utilization (recommended)
- Command usage: 1. Set refresh every 5 seconds. Use -d to specify the refresh frequency: nethogs -d 5
2. Monitor eth0 network bandwidth: nethogs eth0
3. Monitor eth0 and eth2 interfaces at the same time: nethogs eth0 eth2
Interactive command:
The following are some interactive commands (keyboard shortcuts) of NetHogs
m : Modify units
r
: Sort by traffics
: Sort by send trafficq
: Exit the command promptUse screenshot:
The above is the detailed content of How to check the network speed and traffic usage occupied by a process in Linux. For more information, please follow other related articles on the PHP Chinese website!

Hot AI Tools

Undresser.AI Undress
AI-powered app for creating realistic nude photos

AI Clothes Remover
Online AI tool for removing clothes from photos.

Undress AI Tool
Undress images for free

Clothoff.io
AI clothes remover

Video Face Swap
Swap faces in any video effortlessly with our completely free AI face swap tool!

Hot Article

Hot Tools

Notepad++7.3.1
Easy-to-use and free code editor

SublimeText3 Chinese version
Chinese version, very easy to use

Zend Studio 13.0.1
Powerful PHP integrated development environment

Dreamweaver CS6
Visual web development tools

SublimeText3 Mac version
God-level code editing software (SublimeText3)

Hot Topics
 1387
1387
 52
52
 How to use docker desktop
Apr 15, 2025 am 11:45 AM
How to use Docker Desktop? Docker Desktop is a tool for running Docker containers on local machines. The steps to use include: 1. Install Docker Desktop; 2. Start Docker Desktop; 3. Create Docker image (using Dockerfile); 4. Build Docker image (using docker build); 5. Run Docker container (using docker run).
 How to view the docker process
Apr 15, 2025 am 11:48 AM
Docker process viewing method: 1. Docker CLI command: docker ps; 2. Systemd CLI command: systemctl status docker; 3. Docker Compose CLI command: docker-compose ps; 4. Process Explorer (Windows); 5. /proc directory (Linux).
 What to do if the docker image fails
Apr 15, 2025 am 11:21 AM
Troubleshooting steps for failed Docker image build: Check Dockerfile syntax and dependency version. Check if the build context contains the required source code and dependencies. View the build log for error details. Use the --target option to build a hierarchical phase to identify failure points. Make sure to use the latest version of Docker engine. Build the image with --t [image-name]:debug mode to debug the problem. Check disk space and make sure it is sufficient. Disable SELinux to prevent interference with the build process. Ask community platforms for help, provide Dockerfiles and build log descriptions for more specific suggestions.
 What computer configuration is required for vscode
Apr 15, 2025 pm 09:48 PM
VS Code system requirements: Operating system: Windows 10 and above, macOS 10.12 and above, Linux distribution processor: minimum 1.6 GHz, recommended 2.0 GHz and above memory: minimum 512 MB, recommended 4 GB and above storage space: minimum 250 MB, recommended 1 GB and above other requirements: stable network connection, Xorg/Wayland (Linux)
 vscode cannot install extension
Apr 15, 2025 pm 07:18 PM
The reasons for the installation of VS Code extensions may be: network instability, insufficient permissions, system compatibility issues, VS Code version is too old, antivirus software or firewall interference. By checking network connections, permissions, log files, updating VS Code, disabling security software, and restarting VS Code or computers, you can gradually troubleshoot and resolve issues.
 Can vscode be used for mac
Apr 15, 2025 pm 07:36 PM
VS Code is available on Mac. It has powerful extensions, Git integration, terminal and debugger, and also offers a wealth of setup options. However, for particularly large projects or highly professional development, VS Code may have performance or functional limitations.
 What is vscode What is vscode for?
Apr 15, 2025 pm 06:45 PM
VS Code is the full name Visual Studio Code, which is a free and open source cross-platform code editor and development environment developed by Microsoft. It supports a wide range of programming languages and provides syntax highlighting, code automatic completion, code snippets and smart prompts to improve development efficiency. Through a rich extension ecosystem, users can add extensions to specific needs and languages, such as debuggers, code formatting tools, and Git integrations. VS Code also includes an intuitive debugger that helps quickly find and resolve bugs in your code.
 How to back up vscode settings and extensions
Apr 15, 2025 pm 05:18 PM
How to back up VS Code configurations and extensions? Manually backup the settings file: Copy the key JSON files (settings.json, keybindings.json, extensions.json) to a safe location. Take advantage of VS Code synchronization: enable synchronization with your GitHub account to automatically back up all relevant settings and extensions. Use third-party tools: Back up configurations with reliable tools and provide richer features such as version control and incremental backups.


