

How to make a box plot in Excel

What is a boxplot?
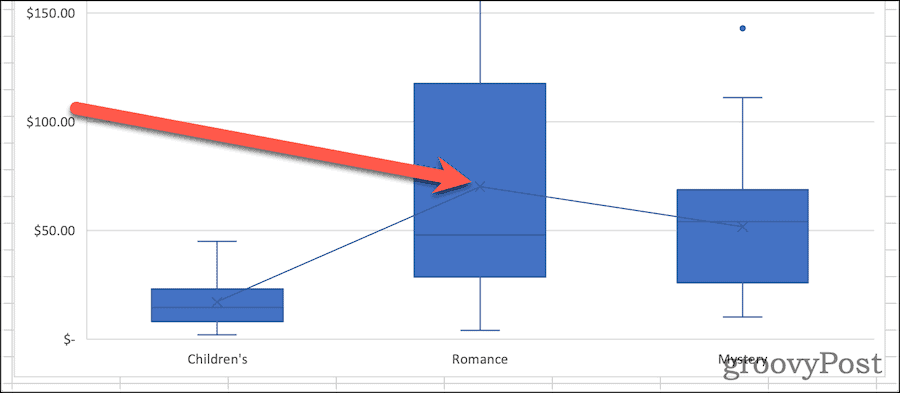
For descriptive statistics, boxplots are one of the best ways to show how data is distributed. It displays numbers in quartiles, highlighting averages and outliers. Boxplots are used extensively in statistical analysis, from comparing medical trial results to comparing the test scores of different teachers.
The basis of the boxplot is to display data based on five-digit summaries. This means showing:
- Minimum value: The lowest data point in the dataset, excluding any outliers.
- Maximum value: The highest data point in the data set, excluding outliers.
- Median : The middle value in the data set
- First or lower quartile : This is the lower half of the data set The median of the values.
- Third or upper quartile: The median of the upper half of the data set values
Sometimes, box plots will show vertical upward or Line segments extending downward to show how data varies outside the upper and lower quartiles. These are called "whiskers," and the chart itself is sometimes called a box-and-whisker plot.
How to make a boxplot in Excel for Microsoft 365
In past versions of Excel, there was no chart template specific to boxplots. While it is still possible to create it, it requires a lot of work. Office 365 does now include box plots as an option, but it's somewhat hidden in the Insert tab.
The following guides and screenshots are based on using the Microsoft 365 version of Excel. The steps provided here are designed for users using Mac computers. However, we will provide instructions accordingly as the steps may be different on a Windows computer.
First, of course, you need your data. Once you've finished typing, you can create and style the box plot.
Create a box plot in Excel:
- Select your data—a single or multiple data series—in an Excel workbook.
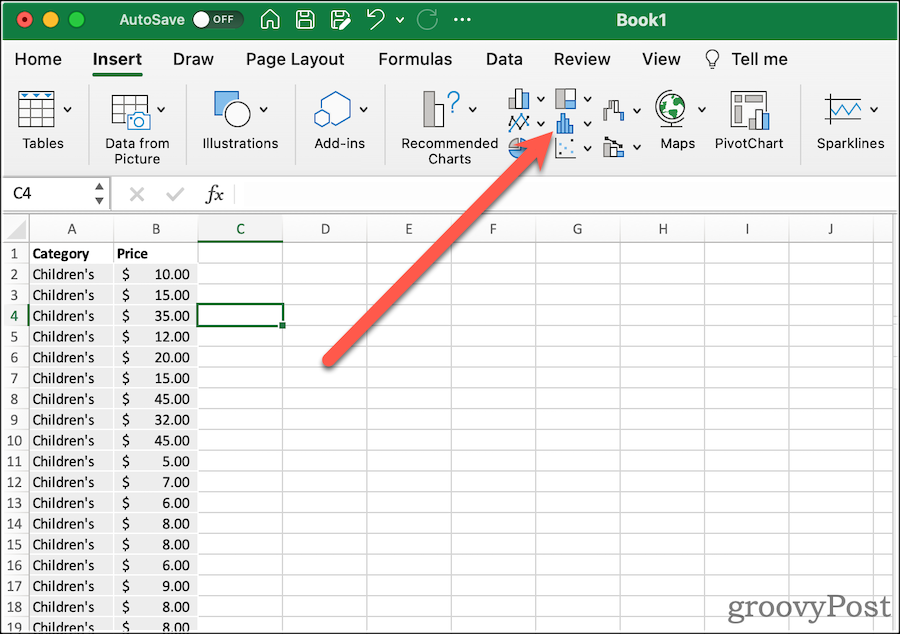
- On the ribbon bar, click the Insert tab.
- On Windows, click Insert > Insert Chart > Box Whiskers.
- On macOS, click the Statistical Chart icon and select Box and Whisker.
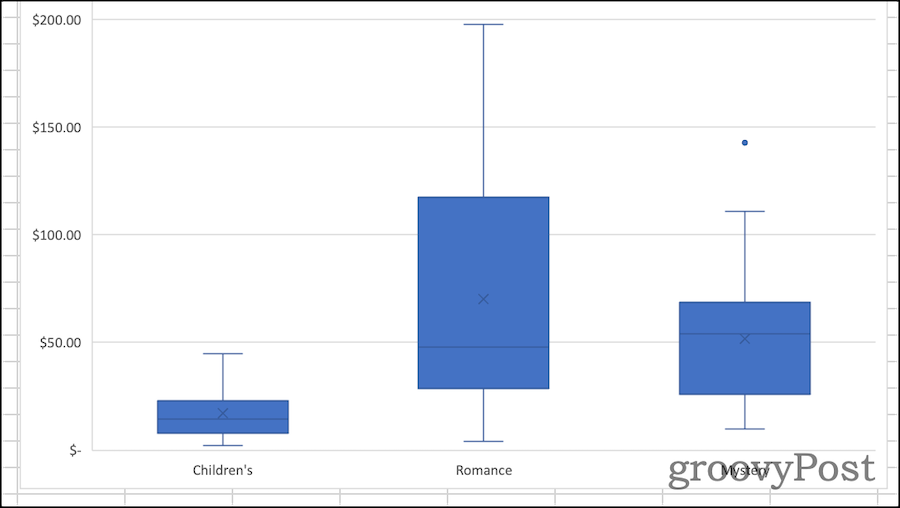
#This will give you a very basic box plot, complete with whiskers. Next, you can modify its options to see it the way you want.
Formatting Box and Whisker Plots in Excel
After you create your box and whisker plot, it’s time to spruce it up. The first thing you should do is give your chart a descriptive title. To do this, click on the existing title and you can select the text and make changes.
From the Design and Format tabs on the ribbon, you can modify Excel to style the box plot. Here you can choose which theme style to use, change the fill color of the box, apply a WordArt style, and more. These options are common to almost all charts and graphs you might create in Excel.
If you want to change options specific to Box and Whisper charts, click Format Pane. Here you can change how the chart represents your data. For example:
-
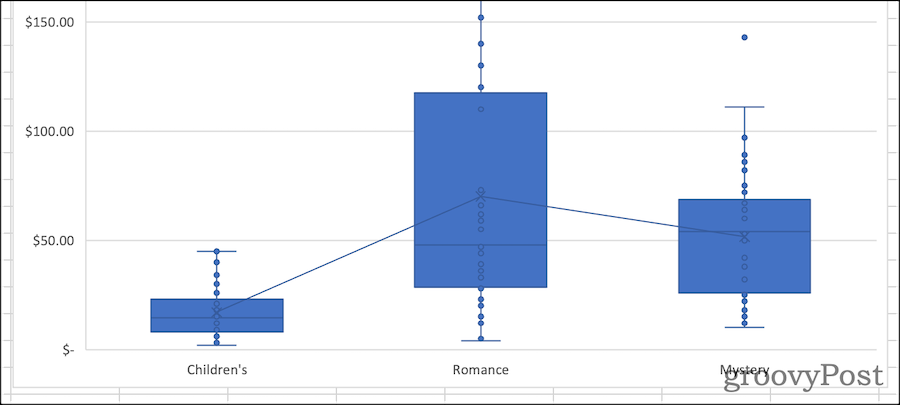
Show interior points: If checked, your boxplot will also show individual values within the first and third quartiles. Excel represents each value with a point, rather than one point for each record in the data set.

-
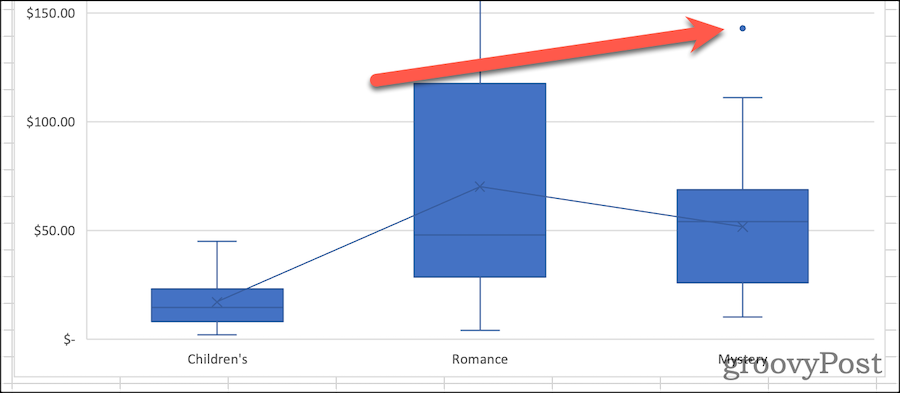
Show Outliers: When this feature is enabled, your chart will include markers showing data points outside the whiskers. In other words, this will be a data point that is unusually far away from other values in the data set.
-
Show average markers: This option turns on or off the average markers in each box.
-
Show average line: If checked, draws a line connecting the average of each data set.
- Quartile Calculation: When you have an odd number of data points, you can calculate your quartiles with or without the median. In general, exclusive interquartile ranges are more suitable for large sample data. Smaller samples can benefit from the inclusive median method because it tends to be more representative of a narrower range of data points.

A welcome addition to statistical analysis
It's not always easy to figure out how to create a box plot in Excel. Creating charts in previous versions of spreadsheet software required manual calculation of the various quartiles. You can then create a bar chart to approximate the boxplot. Microsoft's addition of this chart type in Office 365 and Microsoft 365 is very popular.
The above is the detailed content of How to make a box plot in Excel. For more information, please follow other related articles on the PHP Chinese website!

Hot AI Tools

Undresser.AI Undress
AI-powered app for creating realistic nude photos

AI Clothes Remover
Online AI tool for removing clothes from photos.

Undress AI Tool
Undress images for free

Clothoff.io
AI clothes remover

AI Hentai Generator
Generate AI Hentai for free.

Hot Article
Hot Tools

Notepad++7.3.1
Easy-to-use and free code editor

SublimeText3 Chinese version
Chinese version, very easy to use

Zend Studio 13.0.1
Powerful PHP integrated development environment

Dreamweaver CS6
Visual web development tools

SublimeText3 Mac version
God-level code editing software (SublimeText3)
Hot Topics
 1376
1376
 52
52

 Excel found a problem with one or more formula references: How to fix it
Apr 17, 2023 pm 06:58 PM
Excel found a problem with one or more formula references: How to fix it
Apr 17, 2023 pm 06:58 PM
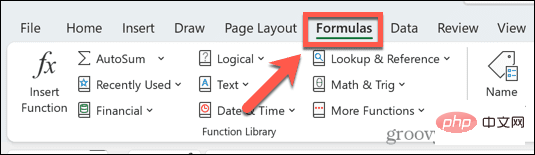
Use an Error Checking Tool One of the quickest ways to find errors with your Excel spreadsheet is to use an error checking tool. If the tool finds any errors, you can correct them and try saving the file again. However, the tool may not find all types of errors. If the error checking tool doesn't find any errors or fixing them doesn't solve the problem, then you need to try one of the other fixes below. To use the error checking tool in Excel: select the Formulas tab. Click the Error Checking tool. When an error is found, information about the cause of the error will appear in the tool. If it's not needed, fix the error or delete the formula causing the problem. In the Error Checking Tool, click Next to view the next error and repeat the process. When not
 How to set the print area in Google Sheets?
May 08, 2023 pm 01:28 PM
How to set the print area in Google Sheets?
May 08, 2023 pm 01:28 PM
How to Set GoogleSheets Print Area in Print Preview Google Sheets allows you to print spreadsheets with three different print areas. You can choose to print the entire spreadsheet, including each individual worksheet you create. Alternatively, you can choose to print a single worksheet. Finally, you can only print a portion of the cells you select. This is the smallest print area you can create since you could theoretically select individual cells for printing. The easiest way to set it up is to use the built-in Google Sheets print preview menu. You can view this content using Google Sheets in a web browser on your PC, Mac, or Chromebook. To set up Google
 How to solve out of memory problem in Microsoft Excel?
Apr 22, 2023 am 10:04 AM
How to solve out of memory problem in Microsoft Excel?
Apr 22, 2023 am 10:04 AM
Microsoft Excel is a popular program used for creating worksheets, data entry operations, creating graphs and charts, etc. It helps users organize their data and perform analysis on this data. As can be seen, all versions of the Excel application have memory issues. Many users have reported seeing the error message "Insufficient memory to run Microsoft Excel. Please close other applications and try again." when trying to open Excel on their Windows PC. Once this error is displayed, users will not be able to use MSExcel as the spreadsheet will not open. Some users reported problems opening Excel downloaded from any email client
 5 Tips to Fix Stdole32.tlb Excel Error in Windows 11
May 09, 2023 pm 01:37 PM
5 Tips to Fix Stdole32.tlb Excel Error in Windows 11
May 09, 2023 pm 01:37 PM
When you start Microsoft Word or Microsoft Excel, Windows very tediously tries to set up Office 365. At the end of the process, you may receive a Stdole32.tlbExcel error. Since there are many bugs in the Microsoft Office suite, launching any of its products can sometimes be a nightmare. Microsoft Office is a software that is used regularly. Microsoft Office has been available to consumers since 1990. Starting from Office 1.0 version and developing to Office 365, this
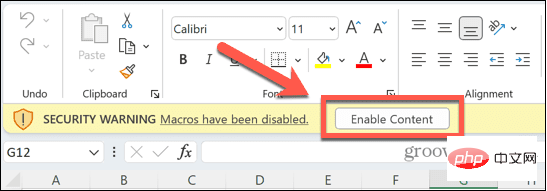 How to enable or disable macros in Excel
Apr 13, 2023 pm 10:43 PM
How to enable or disable macros in Excel
Apr 13, 2023 pm 10:43 PM
What are macros? A macro is a set of instructions that instruct Excel to perform an action or sequence of actions. They save you from performing repetitive tasks in Excel. In its simplest form, you can record a series of actions in Excel and save them as macros. Then, running your macro will perform the same sequence of operations as many times as you need. For example, you may want to insert multiple worksheets into your document. Inserting one at a time is not ideal, but a macro can insert any number of worksheets by repeating the same steps over and over. By using Visu
 How to display the Developer tab in Microsoft Excel
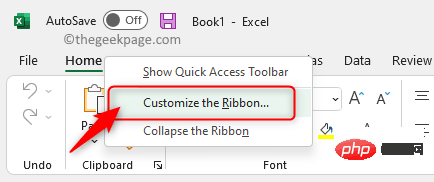
Apr 14, 2023 pm 02:10 PM
How to display the Developer tab in Microsoft Excel
Apr 14, 2023 pm 02:10 PM
If you need to record or run macros, insert Visual Basic forms or ActiveX controls, or import/export XML files in MS Excel, you need the Developer tab in Excel for easy access. However, this developer tab does not appear by default, but you can add it to the ribbon by enabling it in Excel options. If you are working with macros and VBA and want to easily access them from the Ribbon, continue reading this article. Steps to enable Developer tab in Excel 1. Launch MS Excel application. Right-click anywhere on one of the top ribbon tabs and when
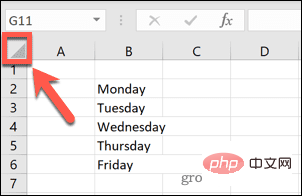 How to find and delete merged cells in Excel
Apr 20, 2023 pm 11:52 PM
How to find and delete merged cells in Excel
Apr 20, 2023 pm 11:52 PM
How to Find Merged Cells in Excel on Windows Before you can delete merged cells from your data, you need to find them all. It's easy to do this using Excel's Find and Replace tool. Find merged cells in Excel: Highlight the cells where you want to find merged cells. To select all cells, click in an empty space in the upper left corner of the spreadsheet or press Ctrl+A. Click the Home tab. Click the Find and Select icon. Select Find. Click the Options button. At the end of the FindWhat settings, click Format. Under the Alignment tab, click Merge Cells. It should contain a check mark rather than a line. Click OK to confirm the format
 How to create a random number generator in Excel
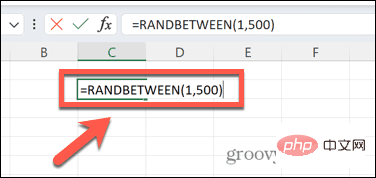
Apr 14, 2023 am 09:46 AM
How to create a random number generator in Excel
Apr 14, 2023 am 09:46 AM
How to use RANDBETWEEN to generate random numbers in Excel If you want to generate random numbers within a specific range, the RANDBETWEEN function is a quick and easy way to do it. This allows you to generate random integers between any two values of your choice. Generate random numbers in Excel using RANDBETWEEN: Click the cell where you want the first random number to appear. Type =RANDBETWEEN(1,500) replacing "1" with the lowest random number you want to generate and "500" with