

How SpringBoot+thymeleaf+Echarts+Mysql realizes visual data reading

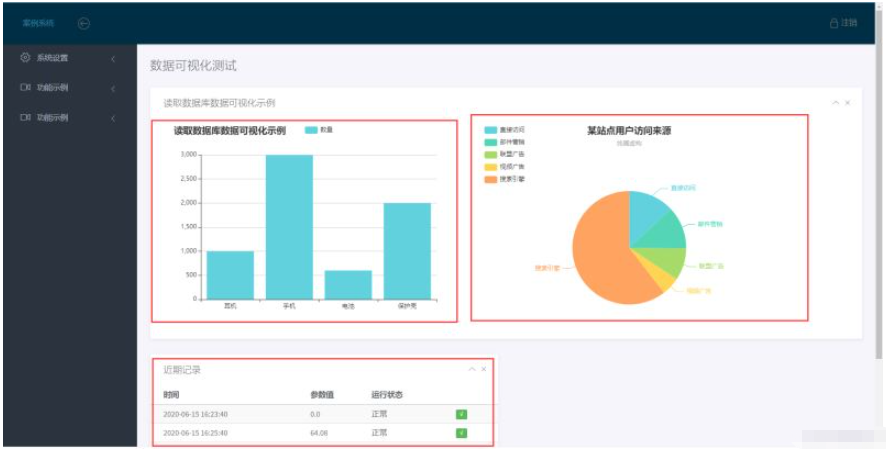
Achieve data visualization by getting data from the database, converting it to JSON data, and returning it to the front-end interface.
Data visualization test
<!--Thymeleaf整合security-->
<dependency>
    <groupId>org.thymeleaf.extras</groupId>
    <artifactId>thymeleaf-extras-springsecurity5</artifactId>
    <version>3.0.4.RELEASE</version>
</dependency>
 <!--导入lombok小辣椒驱动依赖,用来生成get/set方法依赖-->
<dependency>
    <groupId>org.projectlombok</groupId>
    <artifactId>lombok</artifactId>
    <!--<optional>true</optional>-->
    <version>1.18.12</version>
    <scope>provided</scope><!--自动生成有参无参构造-->
</dependency>
<dependency>
            <groupId>com.alibaba</groupId>
            <artifactId>fastjson</artifactId>
            <version>1.2.4</version>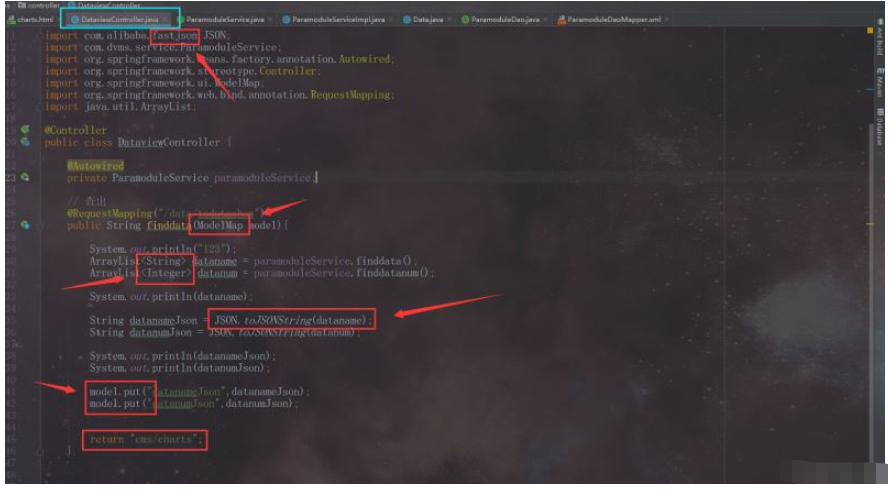
</dependency>package com.dvms.controller;
/*
*文件名: DataviewController
*创建者: CJW
*创建时间:2022/4/15 20:33
*描述: TODO
*/
import com.alibaba.fastjson.JSON;
import com.dvms.service.ParamoduleService;
import org.springframework.beans.factory.annotation.Autowired;
import org.springframework.stereotype.Controller;
import org.springframework.ui.ModelMap;
import org.springframework.web.bind.annotation.RequestMapping;
import java.util.ArrayList;
@Controller
public class DataviewController {
@Autowired
private ParamoduleService paramoduleService;
// 查出
@RequestMapping("/data/todatashow")
public String finddata(ModelMap model){
ArrayList<String> dataname = paramoduleService.finddata();
ArrayList<Integer> datanum = paramoduleService.finddatanum();
String datanameJson = JSON.toJSONString(dataname);
String datanumJson = JSON.toJSONString(datanum);
System.out.println(datanameJson);
System.out.println(datanumJson);
model.put("datanameJson",datanameJson);
model.put("datanumJson",datanumJson);
return "ems/charts";
}
}
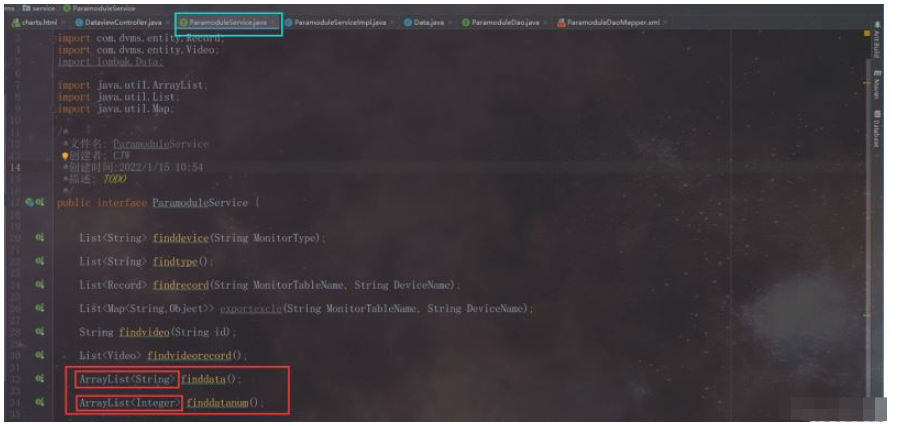
package com.dvms.service;

import com.dvms.entity.Record;
import com.dvms.entity.Video;
import java.util.ArrayList;
import java.util.List;
import java.util.Map;

/*
 *文件名: ParamoduleService
 *创建者: CJW
 *创建时间:2022/1/15 10:54
 *描述: TODO
 */
public interface ParamoduleService {

    ArrayList<String> finddata();

    ArrayList<Integer> finddatanum();
}
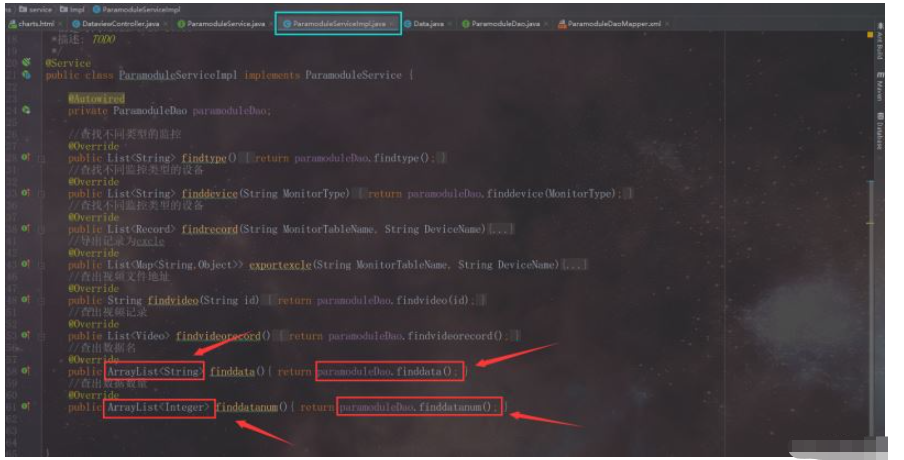
package com.dvms.service.Impl;

import com.dvms.dao.ParamoduleDao;
import com.dvms.entity.Record;
import com.dvms.entity.Video;
import com.dvms.service.ParamoduleService;
import org.springframework.beans.factory.annotation.Autowired;
import org.springframework.stereotype.Service;

import java.util.ArrayList;
import java.util.List;
import java.util.Map;

/*
 *文件名: ParamoduleServiceImpl
 *创建者: CJW
 *创建时间:2022/1/15 10:55
 *描述: TODO
 */
@Service
public class ParamoduleServiceImpl implements ParamoduleService {

    @Autowired
    private ParamoduleDao paramoduleDao;
    //查出数据名
    @Override
    public ArrayList<String> finddata(){ return paramoduleDao.finddata(); }
    //查出数据数量
    @Override
    public ArrayList<Integer> finddatanum(){ return paramoduleDao.finddatanum(); }
} 
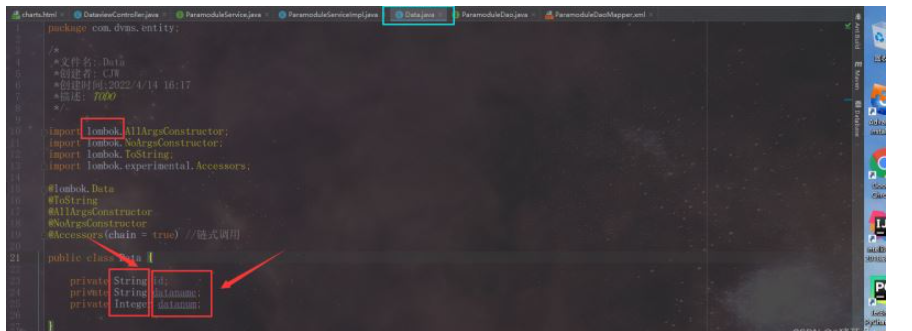
package com.dvms.entity;
/*
*文件名: Data
*创建者: CJW
*创建时间:2022/4/14 16:17
*描述: TODO
*/
import lombok.AllArgsConstructor;
import lombok.NoArgsConstructor;
import lombok.ToString;
import lombok.experimental.Accessors;
@lombok.Data
@ToString
@AllArgsConstructor
@NoArgsConstructor
@Accessors(chain = true) //链式调用
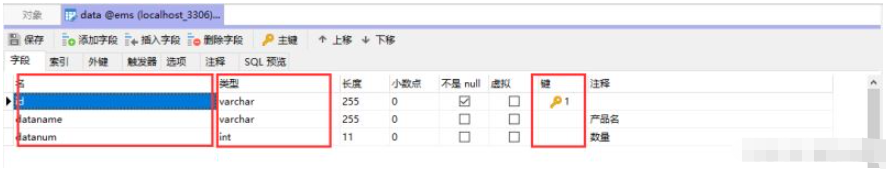
public class Data {
private String id;
private String dataname;
private Integer datanum;
}
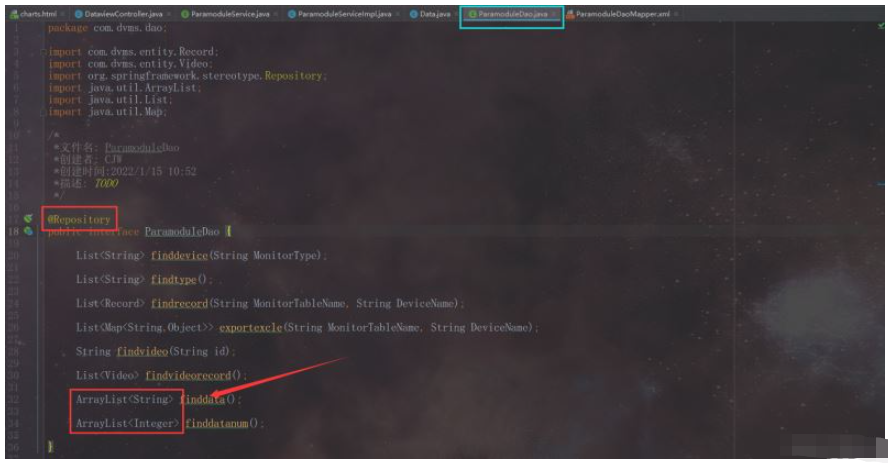
package com.dvms.dao;

import com.dvms.entity.Record;
import com.dvms.entity.Video;
import org.springframework.stereotype.Repository;
import java.util.ArrayList;
import java.util.List;
import java.util.Map;

/*
 *文件名: ParamoduleDao
 *创建者: CJW
 *创建时间:2022/1/15 10:52
 *描述: TODO
 */

@Repository
public interface ParamoduleDao {

     ArrayList<String> finddata();

     ArrayList<Integer> finddatanum();

}
<?xml version="1.0" encoding="UTF-8" ?>
<!DOCTYPE mapper
        PUBLIC "-//mybatis.org//DTD Mapper 3.0//EN"
        "http://mybatis.org/dtd/mybatis-3-mapper.dtd">
<mapper namespace="com.dvms.dao.ParamoduleDao">

    <!--查询数据名-->
    <select id="finddata" resultType="String">
        select dataname from data
    </select>

    <!--查询数据数量-->
    <select id="finddatanum" resultType="Integer">
        select datanum from data
    </select>

</mapper>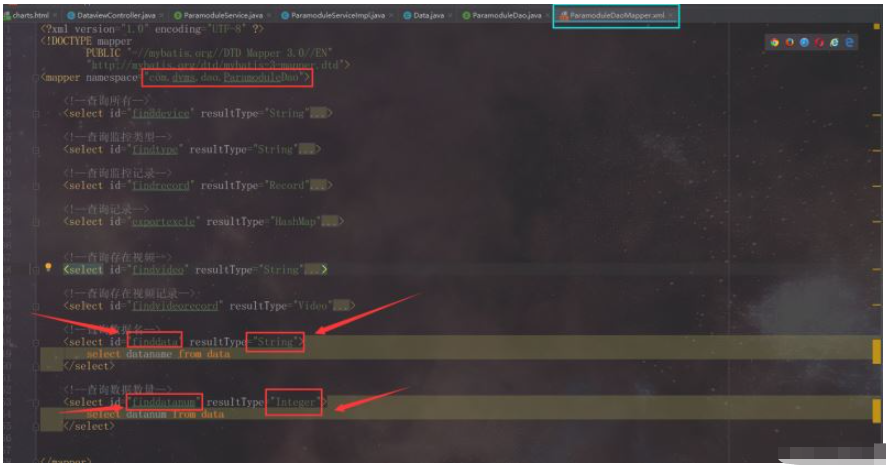
	<script src="https://cdn.bootcss.com/echarts/4.6.0/echarts.min.js">
	<html lang="en" xmlns:th="http://www.thymeleaf.org"></script>
var datanum=[[${datanumJson}]]; // thymeleaf 获取后端参数方式

JSON.parse(dataname) // JSON接收数据 <div class="main">
<!-- MAIN CONTENT -->
<div class="main-content">
<div class="container-fluid">
<h4 id="数据可视化测试示例">数据可视化测试示例</h4>
<div class="row">
<div class="col-md-12">
<div class="panel">
<div class="panel-heading">
<h4 id="读取数据库数据可视化示例">读取数据库数据可视化示例</h4>
<div class="right">
<button type="button" class="btn-toggle-collapse"><i class="lnr lnr-chevron-up"></i>
</button>
<button type="button" class="btn-remove"><i class="lnr lnr-cross"></i></button>
</div>
</div>
<div class="panel-body">
<!--<div id="demo-line-chart" class="ct-chart"></div>-->
<!-- 为ECharts准备一个具备大小(宽高)的Dom -->
<div class="col-md-6" id="main" >
<script type="text/javascript" th:inline="javascript">
//在js读取thymeleaf变量值
var dataname=[[${datanameJson}]];
var datanum=[[${datanumJson}]];
// 基于准备好的dom,初始化echarts实例
var myChart = echarts.init(document.getElementById('main'));
// 指定图表的配置项和数据
var option = {
title: {
text: '读取数据库数据可视化示例'
},
tooltip: {},
legend: {
data: ['数量']
},
xAxis: {
data: JSON.parse(dataname)
},
yAxis: {},
color:['#62d1de'],//在这里设置colorList,是一个数组,图片颜色会按顺序选取
series: [
{
name: '数量',
type: 'bar',
data: JSON.parse(datanum)
}
]
};
// 使用刚指定的配置项和数据显示图表。
myChart.setOption(option);
</script>
</div>
<div class="col-md-6" id="main1" >
<script type="text/javascript" th:inline="javascript">
// 基于准备好的dom,初始化echarts实例
var myChart1 = echarts.init(document.getElementById('main1'));
option = {
title: {
text: '某站点用户访问来源',
subtext: '纯属虚构',
left: 'center'
},
tooltip: {
trigger: 'item',
formatter: '{a} <br/>{b} : {c} ({d}%)'
},
legend: {
orient: 'vertical',
left: 'left',
data: ['直接访问', '邮件营销', '联盟广告', '视频广告', '搜索引擎']
},
color:['#62d1de','#54d6b6','#a6db69','#ffd454','#ffa361','#d1d1d1'],//在这里设置colorList,是一个数组,图片颜色会按顺序选取
series: [
{
name: '访问来源',
type: 'pie',
radius: '55%',
center: ['50%', '60%'],
data: [
{value: 335, name: '直接访问'},
{value: 310, name: '邮件营销'},
{value: 234, name: '联盟广告'},
{value: 135, name: '视频广告'},
{value: 1548, name: '搜索引擎'}
],
emphasis: {
itemStyle: {
shadowBlur: 10,
shadowOffsetX: 0,
shadowColor: 'rgba(0, 0, 0, 0.5)'
}
}
}
]
};
// 使用刚指定的配置项和数据显示图表。
myChart1.setOption(option);
</script>
</div>
</div>
</div>
</div>
</div>
</div>
</div>
</div>
<!-- END MAIN CONTENT -->
</div>The above is the detailed content of How SpringBoot+thymeleaf+Echarts+Mysql realizes visual data reading. For more information, please follow other related articles on the PHP Chinese website!

Hot AI Tools

Undresser.AI Undress
AI-powered app for creating realistic nude photos

AI Clothes Remover
Online AI tool for removing clothes from photos.

Undress AI Tool
Undress images for free

Clothoff.io
AI clothes remover

Video Face Swap
Swap faces in any video effortlessly with our completely free AI face swap tool!

Hot Article
Hot Tools

Notepad++7.3.1
Easy-to-use and free code editor

SublimeText3 Chinese version
Chinese version, very easy to use

Zend Studio 13.0.1
Powerful PHP integrated development environment

Dreamweaver CS6
Visual web development tools

SublimeText3 Mac version
God-level code editing software (SublimeText3)
Hot Topics
 1389
1389
 52
52

 ECharts and Java interface: How to quickly implement statistical charts such as line charts, bar charts, pie charts, etc.
Dec 17, 2023 pm 10:37 PM
ECharts and Java interface: How to quickly implement statistical charts such as line charts, bar charts, pie charts, etc.
Dec 17, 2023 pm 10:37 PM
ECharts and Java interface: How to quickly implement statistical charts such as line charts, bar charts, and pie charts. Specific code examples are required. With the advent of the Internet era, data analysis has become more and more important. Statistical charts are a very intuitive and powerful display method. Charts can display data more clearly, allowing people to better understand the connotation and patterns of the data. In Java development, we can use ECharts and Java interfaces to quickly display various statistical charts. ECharts is a software developed by Baidu
 How to use php interface and ECharts to generate visual statistical charts
Dec 18, 2023 am 11:39 AM
How to use php interface and ECharts to generate visual statistical charts
Dec 18, 2023 am 11:39 AM
In today's context where data visualization is becoming more and more important, many developers hope to use various tools to quickly generate various charts and reports so that they can better display data and help decision-makers make quick judgments. In this context, using the Php interface and ECharts library can help many developers quickly generate visual statistical charts. This article will introduce in detail how to use the Php interface and ECharts library to generate visual statistical charts. In the specific implementation, we will use MySQL
 Comparison and difference analysis between SpringBoot and SpringMVC
Dec 29, 2023 am 11:02 AM
Comparison and difference analysis between SpringBoot and SpringMVC
Dec 29, 2023 am 11:02 AM
SpringBoot and SpringMVC are both commonly used frameworks in Java development, but there are some obvious differences between them. This article will explore the features and uses of these two frameworks and compare their differences. First, let's learn about SpringBoot. SpringBoot was developed by the Pivotal team to simplify the creation and deployment of applications based on the Spring framework. It provides a fast, lightweight way to build stand-alone, executable
 Steps to draw dashboard using ECharts and Python interface
Dec 18, 2023 am 08:40 AM
Steps to draw dashboard using ECharts and Python interface
Dec 18, 2023 am 08:40 AM
The steps to draw a dashboard using ECharts and Python interface require specific code examples. Summary: ECharts is an excellent data visualization tool that can easily perform data processing and graphics drawing through the Python interface. This article will introduce the specific steps to draw a dashboard using ECharts and Python interface, and provide sample code. Keywords: ECharts, Python interface, dashboard, data visualization Introduction Dashboard is a commonly used form of data visualization, which uses
 How to use map heat map to display city heat in ECharts
Dec 18, 2023 pm 04:00 PM
How to use map heat map to display city heat in ECharts
Dec 18, 2023 pm 04:00 PM
How to use a map heat map to display city heat in ECharts ECharts is a powerful visual chart library that provides various chart types for developers to use, including map heat maps. Map heat maps can be used to show the popularity of cities or regions, helping us quickly understand the popularity or density of different places. This article will introduce how to use the map heat map in ECharts to display city heat, and provide code examples for reference. First, we need a map file containing geographic information, EC
 How to use calendar charts to display time data in ECharts
Dec 18, 2023 am 08:52 AM
How to use calendar charts to display time data in ECharts
Dec 18, 2023 am 08:52 AM
How to use calendar charts to display time data in ECharts ECharts (Baidu’s open source JavaScript chart library) is a powerful and easy-to-use data visualization tool. It offers a variety of chart types, including line charts, bar charts, pie charts, and more. The calendar chart is a very distinctive and practical chart type in ECharts, which can be used to display time-related data. This article will introduce how to use calendar charts in ECharts and provide specific code examples. First, you need to use
 ECharts and golang technical guide: practical tips for creating various statistical charts
Dec 17, 2023 pm 09:56 PM
ECharts and golang technical guide: practical tips for creating various statistical charts
Dec 17, 2023 pm 09:56 PM
ECharts and golang technical guide: Practical tips for creating various statistical charts, specific code examples are required. Introduction: In the field of modern data visualization, statistical charts are an important tool for data analysis and visualization. ECharts is a powerful data visualization library, while golang is a fast, reliable and efficient programming language. This article will introduce you to how to use ECharts and golang to create various types of statistical charts, and provide code examples to help you master this skill. Preparation
 Does ECharts depend on jQuery? In-depth analysis
Feb 27, 2024 am 08:39 AM
Does ECharts depend on jQuery? In-depth analysis
Feb 27, 2024 am 08:39 AM
Does ECharts need to rely on jQuery? Detailed interpretation requires specific code examples. ECharts is an excellent data visualization library that provides a rich range of chart types and interactive functions and is widely used in web development. When using ECharts, many people will have a question: Does ECharts need to rely on jQuery? This article will explain this in detail and give specific code examples. First, to be clear, ECharts itself does not rely on jQuery;
