How to debug functions in PHP
PHP is a popular server scripting language used for developing web applications. For developing and debugging PHP code, there are many tools available. The most commonly used of these is the debugger.
The debugger can help us find errors and problems in the program. In PHP, we can use various debuggers to trace program execution, inspect the values of variables, and test methods of functions and classes. Here's a look at some of the most popular PHP debuggers and how to use them to debug functions.
- Xdebug
Xdebug is one of the most popular debuggers in the PHP development community. It can be used to trace the execution of PHP code and provides a set of powerful debugging tools such as breakpoints, variable display and stack tracing. Xdebug is complex to install and configure, but once configured successfully, it provides excellent debugging capabilities.
Steps to use Xdebug to debug functions:
- First, install the Xdebug extension and enable it through the php.ini file.
- Set breakpoints in the IDE (Integrated Development Environment) you are using. For example, in PhpStorm, you can set a breakpoint by clicking on the space area to the right of the line number.
- Start the PHP script that needs to be debugged in the web browser, and the execution will be paused in the IDE and the code near the current breakpoint will be displayed.
- Use the tools in the IDE to view variables, stacks, and other useful information.
- PhpStorm
PhpStorm is a popular PHP IDE that comes with powerful debugging tools. It uses the Xdebug extension to provide advanced debugging capabilities. PhpStorm's debugger integrates Xdebug and provides many useful features, such as variable viewing, conditional breakpoints, and multi-thread debugging.
Steps to use PhpStorm to debug functions:
- Set breakpoints in PhpStorm. Breakpoints can be set by clicking on the space area to the right of the line number.
- Start the PHP script that needs to be debugged in the web browser, and the execution will be paused in PhpStorm and the code near the current breakpoint will be displayed.
- Use the tools in PhpStorm to view variables, stacks, and other useful information.
- DBG
DBG is another popular PHP debugger. It has functionality similar to Xdebug and PhpStorm, with the ability to debug in CLI mode. DBG provides a command line-based graphical user interface to display debugging information.
Steps to use DBG to debug functions:
- Insert debugging statements in the PHP script. For example, you can use the DBGp::dbg() function to insert debugging instructions in a script.
- Run the script in your web browser. This will start DBG and display debug information in the debug GUI.
- Use the tools in DBG to view variables, stacks, and other useful information.
Summary
Debugging functions in PHP are an important aspect of web application development. Using debuggers provides a better development experience because they help developers find and solve problems quickly. This article introduces several popular PHP debuggers and provides steps for using debuggers to debug functions. No matter which PHP debugger you choose, using a debugger can make PHP development easier and more efficient.
The above is the detailed content of How to debug functions in PHP. For more information, please follow other related articles on the PHP Chinese website!

Hot AI Tools

Undresser.AI Undress
AI-powered app for creating realistic nude photos

AI Clothes Remover
Online AI tool for removing clothes from photos.

Undress AI Tool
Undress images for free

Clothoff.io
AI clothes remover

AI Hentai Generator
Generate AI Hentai for free.

Hot Article

Hot Tools

Notepad++7.3.1
Easy-to-use and free code editor

SublimeText3 Chinese version
Chinese version, very easy to use

Zend Studio 13.0.1
Powerful PHP integrated development environment

Dreamweaver CS6
Visual web development tools

SublimeText3 Mac version
God-level code editing software (SublimeText3)

Hot Topics
 1377
1377
 52
52
 PHP 8.4 Installation and Upgrade guide for Ubuntu and Debian
Dec 24, 2024 pm 04:42 PM
PHP 8.4 brings several new features, security improvements, and performance improvements with healthy amounts of feature deprecations and removals. This guide explains how to install PHP 8.4 or upgrade to PHP 8.4 on Ubuntu, Debian, or their derivati
 CakePHP Date and Time
Sep 10, 2024 pm 05:27 PM
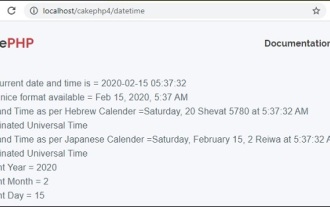
To work with date and time in cakephp4, we are going to make use of the available FrozenTime class.
 Discuss CakePHP
Sep 10, 2024 pm 05:28 PM
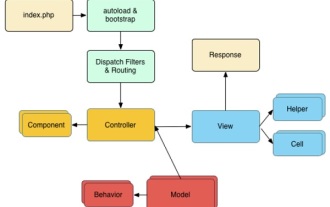
CakePHP is an open-source framework for PHP. It is intended to make developing, deploying and maintaining applications much easier. CakePHP is based on a MVC-like architecture that is both powerful and easy to grasp. Models, Views, and Controllers gu
 CakePHP File upload
Sep 10, 2024 pm 05:27 PM
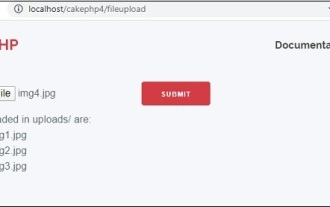
To work on file upload we are going to use the form helper. Here, is an example for file upload.
 CakePHP Creating Validators
Sep 10, 2024 pm 05:26 PM
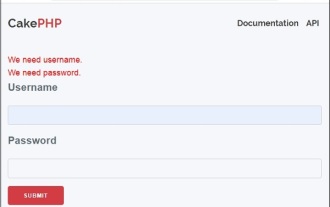
Validator can be created by adding the following two lines in the controller.
 How To Set Up Visual Studio Code (VS Code) for PHP Development
Dec 20, 2024 am 11:31 AM
Visual Studio Code, also known as VS Code, is a free source code editor — or integrated development environment (IDE) — available for all major operating systems. With a large collection of extensions for many programming languages, VS Code can be c
 CakePHP Quick Guide
Sep 10, 2024 pm 05:27 PM
CakePHP is an open source MVC framework. It makes developing, deploying and maintaining applications much easier. CakePHP has a number of libraries to reduce the overload of most common tasks.
 How do you parse and process HTML/XML in PHP?
Feb 07, 2025 am 11:57 AM
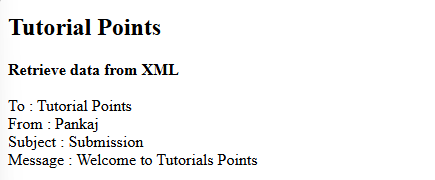
This tutorial demonstrates how to efficiently process XML documents using PHP. XML (eXtensible Markup Language) is a versatile text-based markup language designed for both human readability and machine parsing. It's commonly used for data storage an


