

How to use Prometheus+Grafana to monitor Springboot applications

1 Introduction
The more the project progresses, the more I feel that operation and maintenance monitoring is too important for any system that goes online.
Prometheus is an excellent open source monitoring, alarm and time series database combination system. In the most common Kubernetes container management system, it is usually paired with PrometheusMonitor.
2.1 Introduction to Springboot
Introduce Prometheus into dependencies as follows:
<dependency>
 <groupid>io.micrometer</groupid>
 <artifactid>micrometer-registry-prometheus</artifactid>
</dependency>
For Springboot, enable Actuator and open Corresponding Endpoint:
management.endpoints.web.exposure.include=*
# 或者
management.endpoints.web.exposure.include=prometheus
After starting Springboot, you can check whether the monitoring data can be obtained correctly through the following URL:
localhost :8080/actuator/prometheus
The data is obtained successfully, indicating that Springboot can provide monitoring data normally.
2.2 Using Docker
For convenience, use Docker to start Prometheus:
# 拉取docker镜像
docker pull prom/prometheus
Preparation Configuration file prometheus.yml:
scrape_configs:
# 可随意指定
- job_name: 'spring'
 # 多久采集一次数据
 scrape_interval: 15s
 # 采集时的超时时间
 scrape_timeout: 10s
 # 采集的路径
 metrics_path: '/actuator/prometheus'
 # 采集服务的地址,设置成Springboot应用所在服务器的具体地址
 static_configs:
 - targets: ['hostname:9000','hostname:8080']
Start the docker instance:
# The port is 9090, specify the configuration file
docker run -d -p 9090 :9090 -v ~/temp/prometheus.yml:/etc/prometheus/prometheus.yml prom/prometheus --config.file=/etc/prometheus/prometheus.yml
2.3 Testing and Viewing
After successful startup, you can open the web page to view it and display it graphically. The URL is http://localhost:9090/.
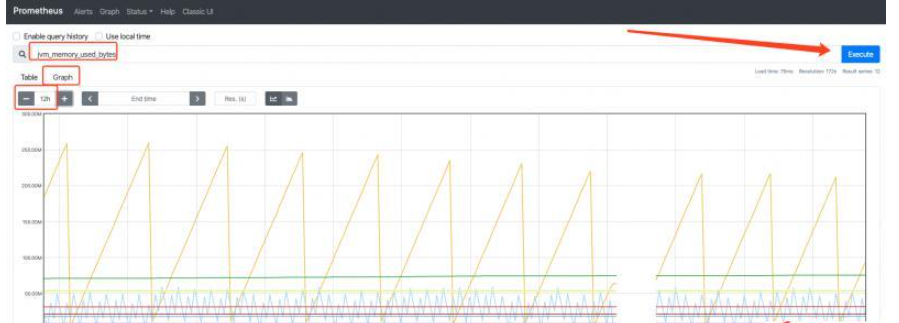
As shown in the picture above, after opening the web page, select a corresponding monitoring indicator and parameter and click Execute to view it.
3 Grafana
Grafana is an open source measurement analysis and visualization suite, a front-end tool developed purely in JavaScript. Display custom reports, display charts, etc. by accessing libraries (such as InfluxDB). Its UI is very flexible, rich in plug-ins and templates, and powerful. Generally used in monitoring time series data.
3.1 Docker installation and startup
# 拉取镜像
docker pull grafana/grafana
# 运行实例
docker run -d -p 3000:3000 grafana/grafana
After successful startup, visit http://localhost:3000 to check whether it is successful. The initial administrator account password is admin /admin.
3.2 Configure the data source
GrafanaTo display data, you need to configure the corresponding data source. In this article, configure the that was installed and enabled before. Prometheus data source, the specific configuration is shown in the figure below:
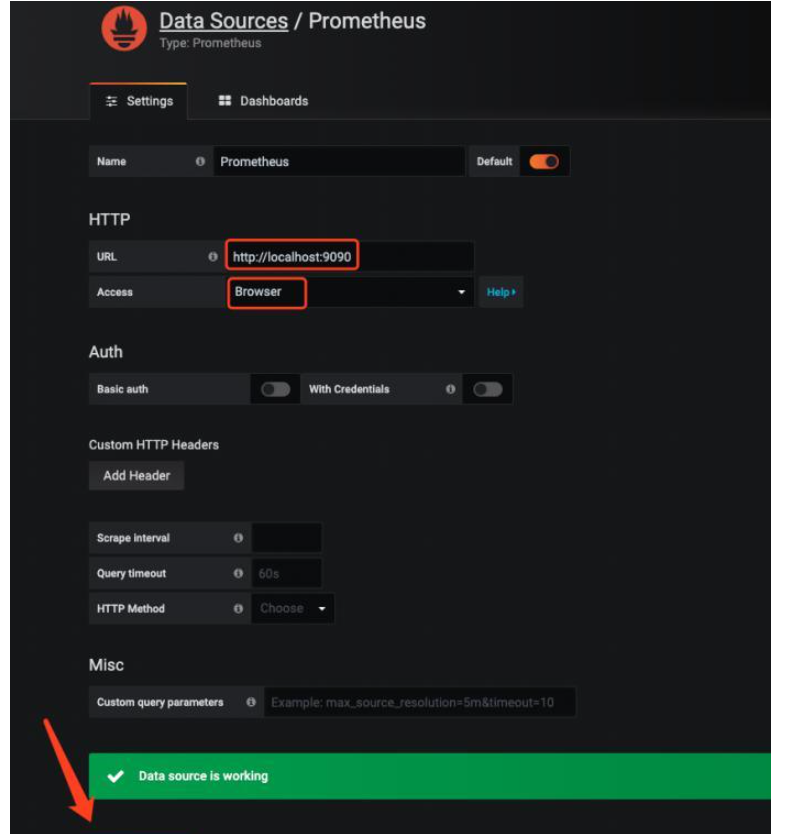
It should be noted that Access must select Browser mode , otherwise the data cannot be obtained normally. After the configuration is completed, click Save & Test.
3.3 Template application
After you can obtain the data, you can customize the data visualization display. But if you add one indicator at a time, it will be very troublesome. In fact, Grafana provides many excellent templates, which can be found on the web page https://grafana.com/grafana/dashboards.
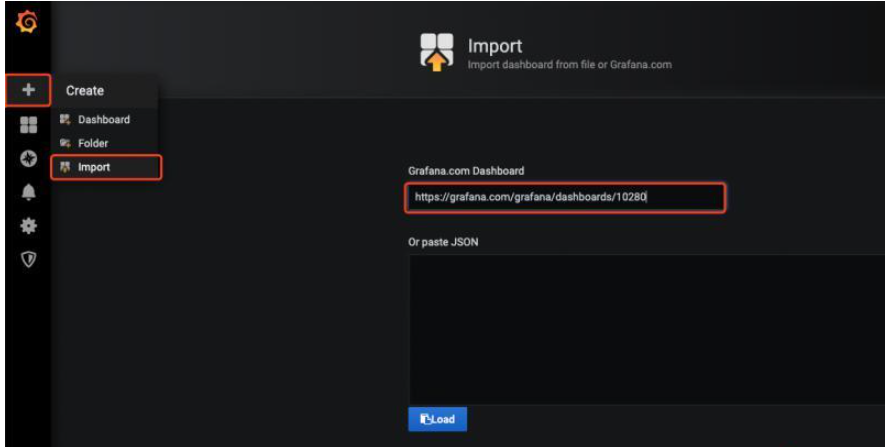
This article uses the Spring Boot 2.1 Statistics template. The import method is as follows:
Click on the number--> Import - -> Enter the template link or ID --> Click Load.
After successful import, you can monitor the data, and the interface is really nice:
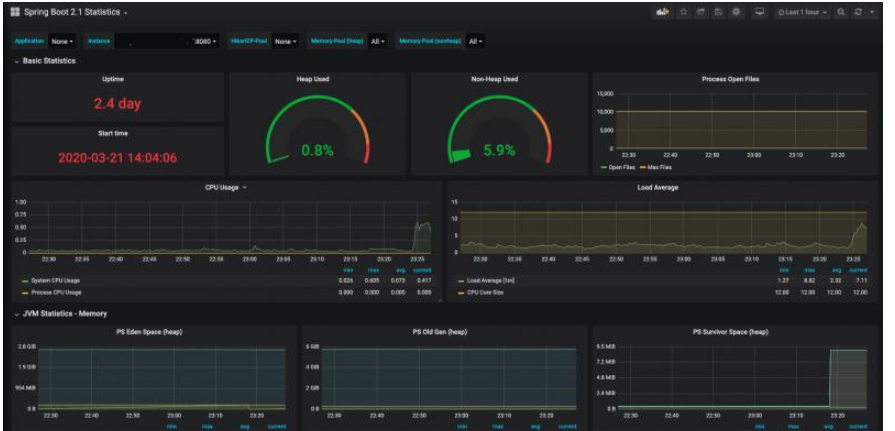
Example in this article The software version information is as follows:
springboot.version=2.2.5
micrometer-registry-prometheus=1.3.5
prometheus.version=2.16
grafana.version=6.7.0-beta1
The above is the detailed content of How to use Prometheus+Grafana to monitor Springboot applications. For more information, please follow other related articles on the PHP Chinese website!

Hot AI Tools

Undresser.AI Undress
AI-powered app for creating realistic nude photos

AI Clothes Remover
Online AI tool for removing clothes from photos.

Undress AI Tool
Undress images for free

Clothoff.io
AI clothes remover

Video Face Swap
Swap faces in any video effortlessly with our completely free AI face swap tool!

Hot Article
Hot Tools

Notepad++7.3.1
Easy-to-use and free code editor

SublimeText3 Chinese version
Chinese version, very easy to use

Zend Studio 13.0.1
Powerful PHP integrated development environment

Dreamweaver CS6
Visual web development tools

SublimeText3 Mac version
God-level code editing software (SublimeText3)
Hot Topics
 1386
1386
 52
52

 How Springboot integrates Jasypt to implement configuration file encryption
Jun 01, 2023 am 08:55 AM
How Springboot integrates Jasypt to implement configuration file encryption
Jun 01, 2023 am 08:55 AM
Introduction to Jasypt Jasypt is a java library that allows a developer to add basic encryption functionality to his/her project with minimal effort and does not require a deep understanding of how encryption works. High security for one-way and two-way encryption. , standards-based encryption technology. Encrypt passwords, text, numbers, binaries... Suitable for integration into Spring-based applications, open API, for use with any JCE provider... Add the following dependency: com.github.ulisesbocchiojasypt-spring-boot-starter2. 1.1Jasypt benefits protect our system security. Even if the code is leaked, the data source can be guaranteed.
 How SpringBoot integrates Redisson to implement delay queue
May 30, 2023 pm 02:40 PM
How SpringBoot integrates Redisson to implement delay queue
May 30, 2023 pm 02:40 PM
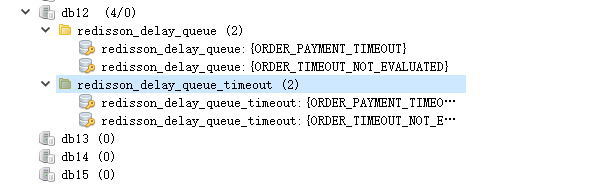
Usage scenario 1. The order was placed successfully but the payment was not made within 30 minutes. The payment timed out and the order was automatically canceled. 2. The order was signed and no evaluation was conducted for 7 days after signing. If the order times out and is not evaluated, the system defaults to a positive rating. 3. The order is placed successfully. If the merchant does not receive the order for 5 minutes, the order is cancelled. 4. The delivery times out, and push SMS reminder... For scenarios with long delays and low real-time performance, we can Use task scheduling to perform regular polling processing. For example: xxl-job Today we will pick
 How to use Redis to implement distributed locks in SpringBoot
Jun 03, 2023 am 08:16 AM
How to use Redis to implement distributed locks in SpringBoot
Jun 03, 2023 am 08:16 AM
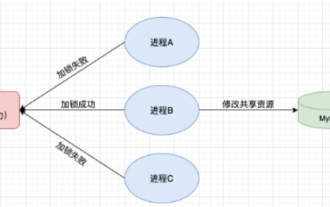
1. Redis implements distributed lock principle and why distributed locks are needed. Before talking about distributed locks, it is necessary to explain why distributed locks are needed. The opposite of distributed locks is stand-alone locks. When we write multi-threaded programs, we avoid data problems caused by operating a shared variable at the same time. We usually use a lock to mutually exclude the shared variables to ensure the correctness of the shared variables. Its scope of use is in the same process. If there are multiple processes that need to operate a shared resource at the same time, how can they be mutually exclusive? Today's business applications are usually microservice architecture, which also means that one application will deploy multiple processes. If multiple processes need to modify the same row of records in MySQL, in order to avoid dirty data caused by out-of-order operations, distribution needs to be introduced at this time. The style is locked. Want to achieve points
 How to solve the problem that springboot cannot access the file after reading it into a jar package
Jun 03, 2023 pm 04:38 PM
How to solve the problem that springboot cannot access the file after reading it into a jar package
Jun 03, 2023 pm 04:38 PM
Springboot reads the file, but cannot access the latest development after packaging it into a jar package. There is a situation where springboot cannot read the file after packaging it into a jar package. The reason is that after packaging, the virtual path of the file is invalid and can only be accessed through the stream. Read. The file is under resources publicvoidtest(){Listnames=newArrayList();InputStreamReaderread=null;try{ClassPathResourceresource=newClassPathResource("name.txt");Input
 How to implement Springboot+Mybatis-plus without using SQL statements to add multiple tables
Jun 02, 2023 am 11:07 AM
How to implement Springboot+Mybatis-plus without using SQL statements to add multiple tables
Jun 02, 2023 am 11:07 AM
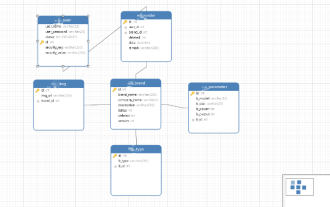
When Springboot+Mybatis-plus does not use SQL statements to perform multi-table adding operations, the problems I encountered are decomposed by simulating thinking in the test environment: Create a BrandDTO object with parameters to simulate passing parameters to the background. We all know that it is extremely difficult to perform multi-table operations in Mybatis-plus. If you do not use tools such as Mybatis-plus-join, you can only configure the corresponding Mapper.xml file and configure The smelly and long ResultMap, and then write the corresponding sql statement. Although this method seems cumbersome, it is highly flexible and allows us to
 Comparison and difference analysis between SpringBoot and SpringMVC
Dec 29, 2023 am 11:02 AM
Comparison and difference analysis between SpringBoot and SpringMVC
Dec 29, 2023 am 11:02 AM
SpringBoot and SpringMVC are both commonly used frameworks in Java development, but there are some obvious differences between them. This article will explore the features and uses of these two frameworks and compare their differences. First, let's learn about SpringBoot. SpringBoot was developed by the Pivotal team to simplify the creation and deployment of applications based on the Spring framework. It provides a fast, lightweight way to build stand-alone, executable
 How SpringBoot customizes Redis to implement cache serialization
Jun 03, 2023 am 11:32 AM
How SpringBoot customizes Redis to implement cache serialization
Jun 03, 2023 am 11:32 AM
1. Customize RedisTemplate1.1, RedisAPI default serialization mechanism. The API-based Redis cache implementation uses the RedisTemplate template for data caching operations. Here, open the RedisTemplate class and view the source code information of the class. publicclassRedisTemplateextendsRedisAccessorimplementsRedisOperations, BeanClassLoaderAware{//Declare key, Various serialization methods of value, the initial value is empty @NullableprivateRedisSe
 Using Prometheus and Grafana to implement monitoring and alarming in Beego
Jun 22, 2023 am 09:06 AM
Using Prometheus and Grafana to implement monitoring and alarming in Beego
Jun 22, 2023 am 09:06 AM
With the rise of cloud computing and microservices, application complexity has increased. Therefore, monitoring and diagnostics become one of the important development tasks. In this regard, Prometheus and Grafana are two popular open source monitoring and visualization tools that can help developers better monitor and analyze applications. This article will explore how to use Prometheus and Grafana to implement monitoring and alarming in the Beego framework. 1. Introduction Beego is an open source rapid development web application.
