 Operation and Maintenance
 Linux Operation and Maintenance
 What is the command to check Linux performance
What is the command to check Linux performance
1.uptime

#This command can quickly check the load status of the machine. In Linux systems, these data represent the number of processes waiting for CPU resources and blocked in uninterruptible IO processes (process status is D). This data can give us a macro understanding of system resource usage. The output of the
command indicates the average load conditions for 1 minute, 5 minutes, and 15 minutes respectively. Through these three data, you can understand whether the server load is becoming tight or easing in the area. If the 1-minute average load is very high and the 15-minute average load is very low, it means that the server is commanding a high load and you need to further investigate where the CPU resources are being consumed. On the other hand, if the 15-minute load average is high and the 1-minute load average is low, it is possible that the time when CPU resources are tight has passed. If the average load in the past minute is much higher than the load in 15 minutes, then we need to use the vmstat and mpstat commands to troubleshoot.
2.dmesg|tail
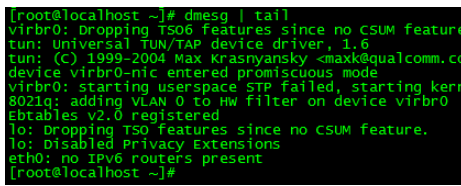
dmesgThis command is used to view boot information
dmesg|tailThis command will output the system log The last 10 lines of
3.vmstat1

Each line will output some core system indicators, which allow us to understand the system status in more detail. The following parameter 2 indicates that statistical information is output every two seconds. The header indicates the meaning of each column. These columns introduce some columns related to performance tuning:
r: Process waiting for CPU resources number. This data reflects the CPU load better than the average load. The data does not include processes waiting for IO. If this value is greater than the number of machine CPU cores, then the machine's CPU resources are saturated.
free: The amount of system available memory (in kilobytes). If the remaining memory is insufficient, it will also cause system performance problems. The free command introduced below can provide a more detailed understanding of system memory usage.
si,so: The number of writes and reads in the swap area. If this data is not 0, it means that the system is already using the swap area (swap) and the machine's physical memory is insufficient.
us,sy,id,wa,st: These all represent the consumption of CPU time. They respectively represent user time (user), system (kernel) time (sys), idle time (idle), IO Waiting time (wait) and stolen time (stolen, usually consumed by other virtual machines).
The above CPU times allow us to quickly understand whether the CPU is busy. Generally, if the sum of user time and system time is very large, the CPU is busy executing instructions. If the IO wait time is long, the bottleneck of the system may be disk IO.
4.mpstat-PALL1
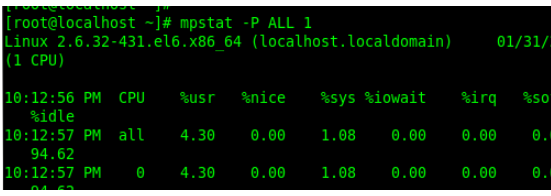
#This command can display the occupancy of each CPU. If there is a CPU with a particularly high occupancy rate, it may be Caused by a single-threaded application.
5.pidstat1

The pidstat command outputs the CPU usage of the process. This command will continue to output and will not overwrite the previous data, making it easy to observe. System dynamics.
6.iostat-xz1

The iostat command is mainly used to check the machine disk IO status. The main meanings of the columns output by this command are:
r/s,w/s,rkB/s,wkB/s: respectively represent the number of reads and writes per second and the amount of data read and written per second (kilobytes) ). Excessive read and write volume may cause performance problems.
await: The average waiting time for IO operations, in milliseconds. This is the time the application needs to spend when interacting with the disk, including IO waiting and actual operation time. If this value is too large, the hardware device may have encountered a bottleneck or malfunctioned.
avgqu-sz: The average number of requests made to the device. If this value is greater than 1, the hardware device may be saturated (some front-end hardware devices support parallel writing).
%util: Device utilization. This value indicates how busy the device is. The empirical value is that if it exceeds 60, it may affect IO performance (you can refer to the average waiting time of IO operations). If it reaches 100%, it means that the hardware device is saturated.
If the data of the logical device is displayed, the device utilization does not mean that the actual back-end hardware device is saturated. It is worth noting that even if the IO performance is not ideal, it does not necessarily mean that the application performance will be poor. Strategies such as pre-reading and write caching can be used to improve application performance.
7.free-h

The free command can be used to view the system memory usage. The last two columns represent the amount of memory used for IO cache and the amount of memory used for file system page cache respectively. It should be noted that the second line -/buffers/cache, it seems that the cache takes up a lot of memory space. This is the memory usage strategy of the Linux system. Utilize the memory as much as possible. If the application needs memory, this memory will be immediately reclaimed and allocated to the application. Therefore, this part of memory is generally regarded as available memory.
If there is very little available memory, the system may use the swap area (if configured), which will increase IO overhead (can be withdrawn in the iostat command) and reduce system performance.
8.sar-nDEV1
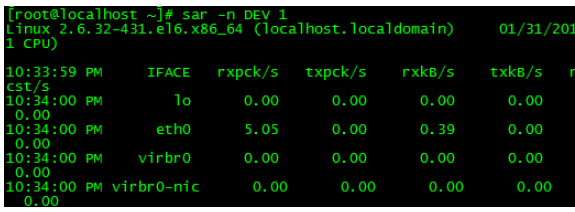
The sar command can check the throughput rate of the network device here. When troubleshooting performance problems, you can judge whether the network device is saturated by the throughput of the network device. As shown in the sample output, the throughput rate of the eth0 network card device is only about 0.39Mbytes/s.
9.sar-nTCP,ETCP1

The sar command is in This is used to view the TCP connection status, including:
active/s: the number of locally initiated TCP connections per second, that is, the TCP connections created through the connect call;
passive/s: every The number of remotely initiated TCP connections per second, that is, the TCP connections created through the accept call;
retrans/s: the number of TCP retransmissions per second;
The number of TCP connections can be used to determine whether there is a performance problem Since too many connections have been established, it can be further determined whether the connection is actively initiated or passively accepted. TCP retransmission may be caused by poor network environment or excessive server pressure, resulting in packet loss.
10.top

The first line is the task queue information, which is the same as the execution result of the uptime command: the first column represents the current time, the second column Indicates how long the system has been running, the third column indicates the current number of people logged in, and the last loadaverage indicates the system load (the three values are: 1 minute, 5 minutes, and 15 minutes ago to the present load average)
The second column represents the process information, which is very intuitive.
The above is the detailed content of What is the command to check Linux performance. For more information, please follow other related articles on the PHP Chinese website!

Hot AI Tools

Undresser.AI Undress
AI-powered app for creating realistic nude photos

AI Clothes Remover
Online AI tool for removing clothes from photos.

Undress AI Tool
Undress images for free

Clothoff.io
AI clothes remover

AI Hentai Generator
Generate AI Hentai for free.

Hot Article

Hot Tools

Notepad++7.3.1
Easy-to-use and free code editor

SublimeText3 Chinese version
Chinese version, very easy to use

Zend Studio 13.0.1
Powerful PHP integrated development environment

Dreamweaver CS6
Visual web development tools

SublimeText3 Mac version
God-level code editing software (SublimeText3)

Hot Topics
 1377
1377
 52
52
 Unable to log in to mysql as root
Apr 08, 2025 pm 04:54 PM
The main reasons why you cannot log in to MySQL as root are permission problems, configuration file errors, password inconsistent, socket file problems, or firewall interception. The solution includes: check whether the bind-address parameter in the configuration file is configured correctly. Check whether the root user permissions have been modified or deleted and reset. Verify that the password is accurate, including case and special characters. Check socket file permission settings and paths. Check that the firewall blocks connections to the MySQL server.
 C language conditional compilation: a detailed guide for beginners to practical applications
Apr 04, 2025 am 10:48 AM
C language conditional compilation is a mechanism for selectively compiling code blocks based on compile-time conditions. The introductory methods include: using #if and #else directives to select code blocks based on conditions. Commonly used conditional expressions include STDC, _WIN32 and linux. Practical case: Print different messages according to the operating system. Use different data types according to the number of digits of the system. Different header files are supported according to the compiler. Conditional compilation enhances the portability and flexibility of the code, making it adaptable to compiler, operating system, and CPU architecture changes.
 What are the 5 basic components of Linux?
Apr 06, 2025 am 12:05 AM
The five basic components of Linux are: 1. The kernel, managing hardware resources; 2. The system library, providing functions and services; 3. Shell, the interface for users to interact with the system; 4. The file system, storing and organizing data; 5. Applications, using system resources to implement functions.
 How to solve mysql cannot be started
Apr 08, 2025 pm 02:21 PM
There are many reasons why MySQL startup fails, and it can be diagnosed by checking the error log. Common causes include port conflicts (check port occupancy and modify configuration), permission issues (check service running user permissions), configuration file errors (check parameter settings), data directory corruption (restore data or rebuild table space), InnoDB table space issues (check ibdata1 files), plug-in loading failure (check error log). When solving problems, you should analyze them based on the error log, find the root cause of the problem, and develop the habit of backing up data regularly to prevent and solve problems.
 Can mysql run on android
Apr 08, 2025 pm 05:03 PM
MySQL cannot run directly on Android, but it can be implemented indirectly by using the following methods: using the lightweight database SQLite, which is built on the Android system, does not require a separate server, and has a small resource usage, which is very suitable for mobile device applications. Remotely connect to the MySQL server and connect to the MySQL database on the remote server through the network for data reading and writing, but there are disadvantages such as strong network dependencies, security issues and server costs.
 Solutions to the errors reported by MySQL on a specific system version
Apr 08, 2025 am 11:54 AM
The solution to MySQL installation error is: 1. Carefully check the system environment to ensure that the MySQL dependency library requirements are met. Different operating systems and version requirements are different; 2. Carefully read the error message and take corresponding measures according to prompts (such as missing library files or insufficient permissions), such as installing dependencies or using sudo commands; 3. If necessary, try to install the source code and carefully check the compilation log, but this requires a certain amount of Linux knowledge and experience. The key to ultimately solving the problem is to carefully check the system environment and error information, and refer to the official documents.
 MySQL can't be installed after downloading
Apr 08, 2025 am 11:24 AM
The main reasons for MySQL installation failure are: 1. Permission issues, you need to run as an administrator or use the sudo command; 2. Dependencies are missing, and you need to install relevant development packages; 3. Port conflicts, you need to close the program that occupies port 3306 or modify the configuration file; 4. The installation package is corrupt, you need to download and verify the integrity; 5. The environment variable is incorrectly configured, and the environment variables must be correctly configured according to the operating system. Solve these problems and carefully check each step to successfully install MySQL.
 Unable to access mysql from terminal
Apr 08, 2025 pm 04:57 PM
Unable to access MySQL from the terminal may be due to: MySQL service not running; connection command error; insufficient permissions; firewall blocks connection; MySQL configuration file error.


