 Backend Development
 Python Tutorial
 What is the implementation principle of the debugger in the Python virtual machine?
What is the implementation principle of the debugger in the Python virtual machine?
The debugger is a very important part of a programming language. The debugger is a tool used to diagnose and fix code errors (or bugs). It allows developers to step by step view and analyze the status of the code while the program is executing. and behavior, which can help developers diagnose and fix code errors, understand program behavior, and optimize performance. The debugger is a very powerful tool in any programming language and can improve development efficiency and code quality.
Let the program stop
If we need to debug a program, the most important point is that if we stop the program, only by stopping the execution of the program can we observe the execution of the program. Status, for example, we need to debug the 99 multiplication table:
def m99():
    for i in range(1, 10):
        for j in range(1, i + 1):
            print(f"{i}x{j}={i*j}", end='\t')
        print()


if __name__ == '__main__':
m99() Now execute the command python -m pdb pdbusage.py to debug the above program:
(py3.8) ➜ pdb_test git:(master) ✗ python -m pdb pdbusage.py
> /Users/xxxx/Desktop/workdir/dive-into-cpython/code/pdb_test/pdbusage.py(3 )()
-> def m99():
(Pdb) s
> /Users/xxxx/Desktop/workdir/dive-into-cpython/code/pdb_test/pdbusage .py(10)()
-> if __name__ == '__main__':
(Pdb) s
> /Users/xxxx/Desktop/workdir/dive-into- cpython/code/pdb_test/pdbusage.py(11)()
-> m99()
(Pdb) s
--Call--
> /Users/ xxxx/Desktop/workdir/dive-into-cpython/code/pdb_test/pdbusage.py(3)m99()
-> def m99():
(Pdb) s
> /Users /xxxx/Desktop/workdir/dive-into-cpython/code/pdb_test/pdbusage.py(4)m99()
-> for i in range(1, 10):
(Pdb) s
> /Users/xxxx/Desktop/workdir/dive-into-cpython/code/pdb_test/pdbusage.py(5)m99()
-> for j in range(1, i 1):
(Pdb) s
> /Users/xxxx/Desktop/workdir/dive-into-cpython/code/pdb_test/pdbusage.py(6)m99()
-> print(f"{ i}x{j}={i*j}", end='\t')
(Pdb) p i
1
(Pdb)
Of course you do too You can debug in the IDE:
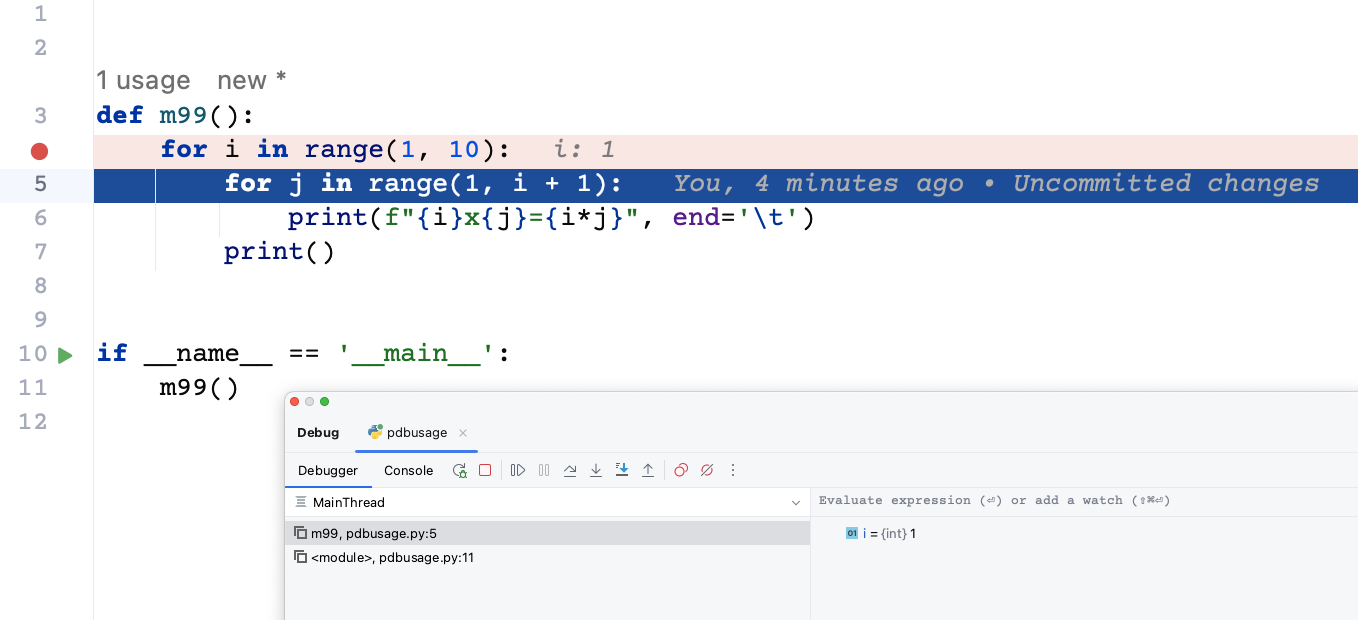
According to our debugging experience, it is easy to know that the first and most important thing to debug a program is that the program needs to be at the location where we set the breakpoint. To be able to stop
cpython King Mechanism——tracing
The question now is, how does the above program stop when the program is executed?
According to the previous study, we can understand that the execution of a python program first needs to be compiled into python bytecode by the python compiler, and then handed over to the python virtual machine for execution. If the program needs to be stopped, it must be The virtual machine provides an interface to the upper-layer Python program, so that when the program is executed, it can know where it is currently executed. This mysterious mechanism is hidden in the sys module. In fact, this module is responsible for almost all the interfaces we use to interact with the python interpreter. A very important function to implement the debugger is the sys.settrace function. This function will set a tracking function for the thread. When the virtual machine has a function call and executes a line of code, or even after executing a bytecode, this function will be executed. function.
To implement a Python source code debugger, you need to set up the tracing function in the system. This function is thread-specific; to support multi-threaded debugging, a trace function must be registered for each thread being debugged, using settrace() or using threading.settrace() .
The tracking function should have three parameters: frame, event and arg. frame is the current stack frame. event is a string: 'call', 'line', 'return', 'exception', 'opcode', 'c_call' or 'c_exception'. arg depends on the event type.
The tracing function is called each time a new local scope is entered (event set to 'call'); it should return a reference to the local tracing function for the new scope, or if If you do not want tracking in this scope, return None.
If any error occurs in the trace function, it will be unset, just like calling settrace(None). The meaning of the
event is as follows:
call, a function is called (or other code blocks are entered). When calling a local trace function, specify arg as None and specify the local function in the return value.
line, a new line of code will be executed, and the value of parameter arg is None.
return, the function (or other block of code) is about to return. When an event is caused by an exception, the local tracing function is called and returns an arg value of None. Return values from tracking functions are ignored.
exception, an exception occurred. Call the local tracing function; arg is a tuple (exception, value, traceback); the return value specifies the new local tracing function.
opcode,解释器即将执行新的字节码指令。执行本地追踪函数,arg为空,返回一个新的本地追踪函数。默认情况下,不会发出每个操作码的事件:必须通过在帧上设置 f_trace_opcodes 为 True 来显式请求。
c_call,一个 c 函数将要被调用。
c_exception,调用 c 函数的时候产生了异常。
自己动手实现一个简单的调试器
我们将在此章节中实现一个简单的调试器,以帮助大家理解调试器的实现原理。调试器的实现代码如下所示,只有短短几十行却可以帮助我们深入去理解调试器的原理,我们先看一下实现的效果在后文当中再去分析具体的实现:
import sys

file = sys.argv[1]
with open(file, "r+") as fp:
    code = fp.read()
lines = code.split("\n")


def do_line(frame, event, arg):
    print("debugging line:", lines[frame.f_lineno - 1])
    return debug


def debug(frame, event, arg):
    if event == "line":
        while True:
            _ = input("(Pdb)")
            if _ == 'n':
                return do_line(frame, event, arg)
            elif _.startswith('p'):
                _, v = _.split()
                v = eval(v, frame.f_globals, frame.f_locals)
                print(v)
            elif _ == 'q':
                sys.exit(0)
    return debug


if __name__ == '__main__':
    sys.settrace(debug)
    exec(code, None, None)
sys.settrace(None)在上面的程序当中使用如下:
输入 n 执行一行代码。
p name 打印变量 name 。
q 退出调试。
现在我们执行上面的程序,进行程序调试:
(py3.10) ➜ pdb_test git:(master) ✗ python mydebugger.py pdbusage.py
(Pdb)n
debugging line: def m99():
(Pdb)n
debugging line: if __name__ == '__main__':
(Pdb)n
debugging line: m99()
(Pdb)n
debugging line: for i in range(1, 10):
(Pdb)n
debugging line: for j in range(1, i + 1):
(Pdb)n
debugging line: print(f"{i}x{j}={i*j}", end='\t')
1x1=1 (Pdb)n
debugging line: for j in range(1, i + 1):
(Pdb)p i
1
(Pdb)p j
1
(Pdb)q
(py3.10) ➜ pdb_test git:(master) ✗
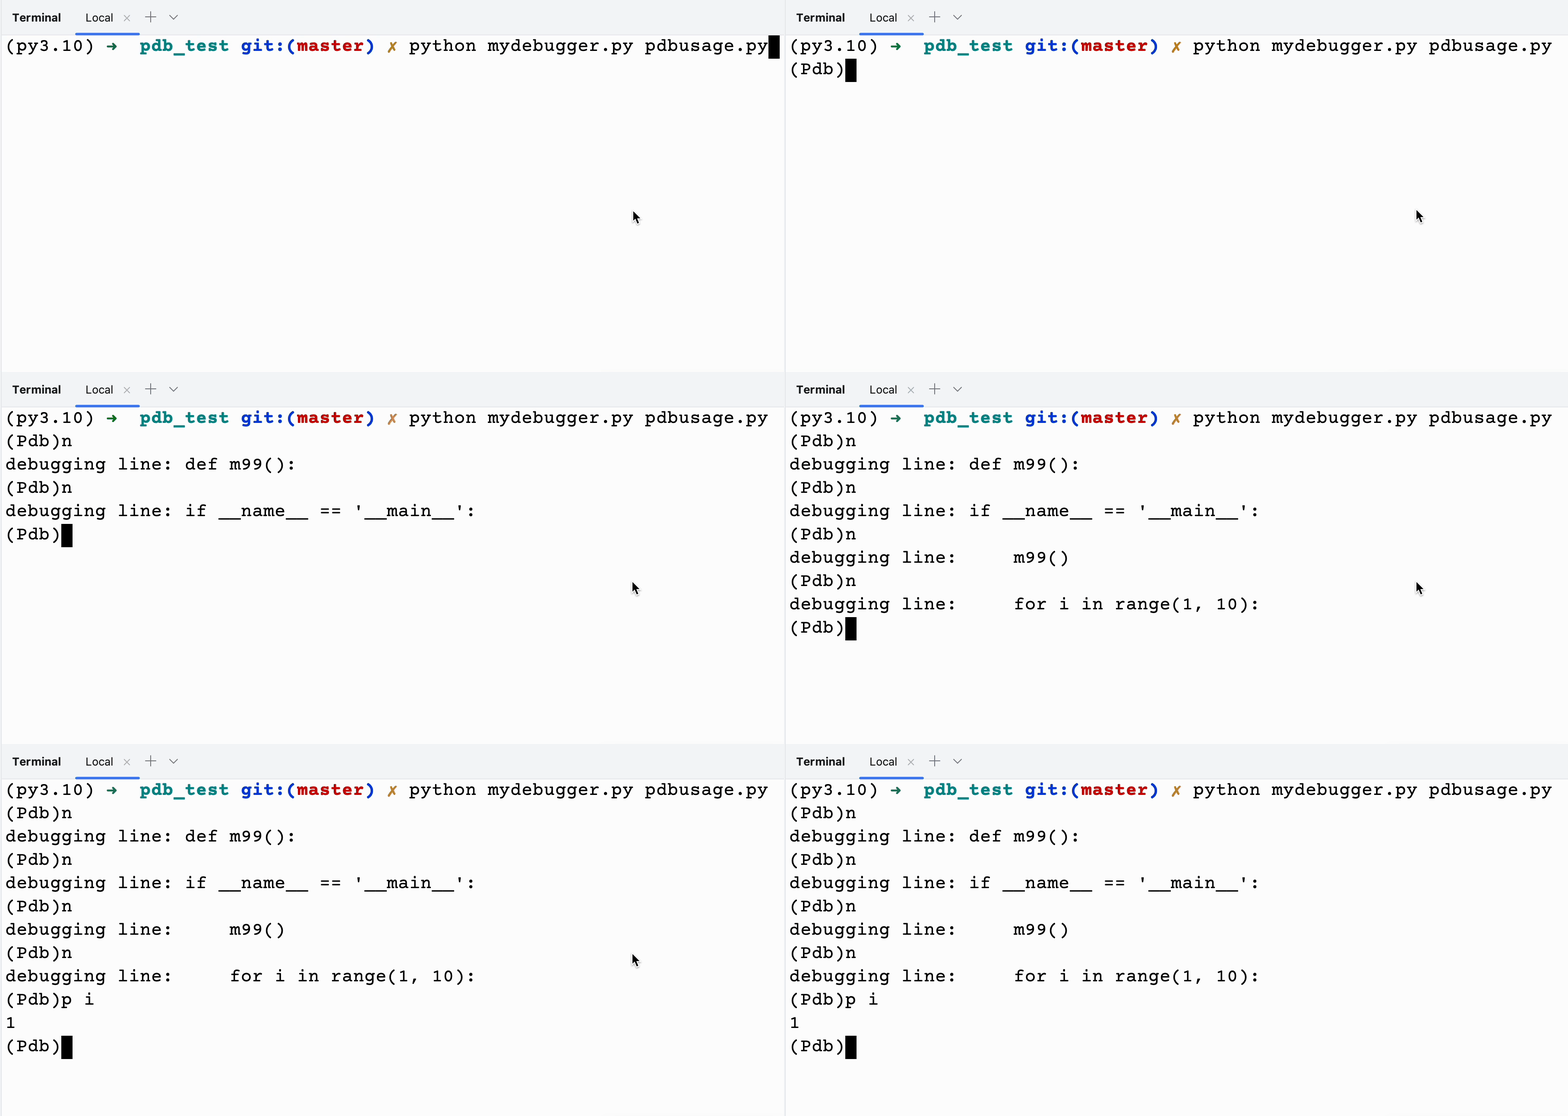
可以看到我们的程序真正的被调试起来了。
现在我们来分析一下我们自己实现的简易版本的调试器,在前文当中我们已经提到了 sys.settrace 函数,调用这个函数时需要传递一个函数作为参数,被传入的函数需要接受三个参数:
frame,当前正在执行的栈帧。
event,事件的类别,这一点在前面的文件当中已经提到了。
arg,参数这一点在前面也已经提到了。
同时需要注意的是这个函数也需要有一个返回值,python 虚拟机在下一次事件发生的时候会调用返回的这个函数,如果返回 None 那么就不会在发生事件的时候调用 tracing 函数了,这是代码当中为什么在 debug 返回 debug 的原因。
我们只对 line 这个事件进行处理,然后进行死循环,只有输入 n 指令的时候才会执行下一行,然后打印正在执行的行,这个时候就会退出函数 debug ,程序就会继续执行了。python 内置的 eval 函数可以获取变量的值。
python 官方调试器源码分析
python 官方的调试器为 pdb 这个是 python 标准库自带的,我们可以通过 python -m pdb xx.py 去调试文件 xx.py 。这里我们只分析核心代码:
代码位置:bdp.py 下面的 Bdb 类
    def run(self, cmd, globals=None, locals=None):
        """Debug a statement executed via the exec() function.

        globals defaults to __main__.dict; locals defaults to globals.
        """
        if globals is None:
            import __main__
            globals = __main__.__dict__
        if locals is None:
            locals = globals
        self.reset()
        if isinstance(cmd, str):
            cmd = compile(cmd, "<string>", "exec")
        sys.settrace(self.trace_dispatch)
        try:
            exec(cmd, globals, locals)
        except BdbQuit:
            pass
        finally:
            self.quitting = True
sys.settrace(None)上面的函数主要是使用 sys.settrace 函数进行 tracing 操作,当有事件发生的时候就能够捕捉了。在上面的代码当中 tracing 函数为 self.trace_dispatch 我们再来看这个函数的代码:
    def trace_dispatch(self, frame, event, arg):
        """Dispatch a trace function for debugged frames based on the event.

        This function is installed as the trace function for debugged
        frames. Its return value is the new trace function, which is
        usually itself. The default implementation decides how to
        dispatch a frame, depending on the type of event (passed in as a
        string) that is about to be executed.

        The event can be one of the following:
            line: A new line of code is going to be executed.
            call: A function is about to be called or another code block
                  is entered.
            return: A function or other code block is about to return.
            exception: An exception has occurred.
            c_call: A C function is about to be called.
            c_return: A C function has returned.
            c_exception: A C function has raised an exception.

        For the Python events, specialized functions (see the dispatch_*()
        methods) are called.  For the C events, no action is taken.

        The arg parameter depends on the previous event.
        """
        if self.quitting:
            return # None
        if event == 'line':
            print("In line")
            return self.dispatch_line(frame)
        if event == 'call':
            print("In call")
            return self.dispatch_call(frame, arg)
        if event == 'return':
            print("In return")
            return self.dispatch_return(frame, arg)
        if event == 'exception':
            print("In execption")
            return self.dispatch_exception(frame, arg)
        if event == 'c_call':
            print("In c_call")
            return self.trace_dispatch
        if event == 'c_exception':
            print("In c_exception")
            return self.trace_dispatch
        if event == 'c_return':
            print("In c_return")
            return self.trace_dispatch
        print('bdb.Bdb.dispatch: unknown debugging event:', repr(event))
return self.trace_dispatch从上面的代码当中可以看到每一种事件都有一个对应的处理函数,在本文当中我们主要分析 函数 dispatch_line,这个处理 line 事件的函数。
    def dispatch_line(self, frame):
        """Invoke user function and return trace function for line event.

        If the debugger stops on the current line, invoke
        self.user_line(). Raise BdbQuit if self.quitting is set.
        Return self.trace_dispatch to continue tracing in this scope.
        """
        if self.stop_here(frame) or self.break_here(frame):
            self.user_line(frame)
            if self.quitting: raise BdbQuit
return self.trace_dispatch这个函数首先会判断是否需要在当前行停下来,如果需要停下来就需要进入 user_line 这个函数,后面的调用链函数比较长,我们直接看最后执行的函数,根据我们使用 pdb 的经验来看,最终肯定是一个 while 循环让我们可以不断的输入指令进行处理:
    def cmdloop(self, intro=None):
        """Repeatedly issue a prompt, accept input, parse an initial prefix
        off the received input, and dispatch to action methods, passing them
        the remainder of the line as argument.

        """
        print("In cmdloop")
        self.preloop()
        if self.use_rawinput and self.completekey:
            try:
                import readline
                self.old_completer = readline.get_completer()
                readline.set_completer(self.complete)
                readline.parse_and_bind(self.completekey+": complete")
            except ImportError:
                pass
        try:
            if intro is not None:
                self.intro = intro
            print(f"{self.intro = }")
            if self.intro:
                self.stdout.write(str(self.intro)+"\n")
            stop = None
            while not stop:
                print(f"{self.cmdqueue = }")
                if self.cmdqueue:
                    line = self.cmdqueue.pop(0)
                else:
                    print(f"{self.prompt = } {self.use_rawinput}")
                    if self.use_rawinput:
                        try:
                            # 核心逻辑就在这里 不断的要求输入然后进行处理
                            line = input(self.prompt) # self.prompt = '(Pdb)'
                        except EOFError:
                            line = 'EOF'
                    else:
                        self.stdout.write(self.prompt)
                        self.stdout.flush()
                        line = self.stdin.readline()
                        if not len(line):
                            line = 'EOF'
                        else:
                            line = line.rstrip('\r\n')

                line = self.precmd(line)
                stop = self.onecmd(line) # 这个函数就是处理我们输入的字符串的比如 p n 等等
                stop = self.postcmd(stop, line)
            self.postloop()
        finally:
            if self.use_rawinput and self.completekey:
                try:
                    import readline
                    readline.set_completer(self.old_completer)
                except ImportError:
pass def onecmd(self, line):
"""Interpret the argument as though it had been typed in response
to the prompt.
This may be overridden, but should not normally need to be;
see the precmd() and postcmd() methods for useful execution hooks.
The return value is a flag indicating whether interpretation of
commands by the interpreter should stop.
"""
cmd, arg, line = self.parseline(line)
if not line:
return self.emptyline()
if cmd is None:
return self.default(line)
self.lastcmd = line
if line == 'EOF' :
self.lastcmd = ''
if cmd == '':
return self.default(line)
else:
try:
# 根据下面的代码可以分析了解到如果我们执行命令 p 执行的函数为 do_p
func = getattr(self, 'do_' + cmd)
except AttributeError:
return self.default(line)
return func(arg)现在我们再来看一下 do_p 打印一个表达式是如何实现的:
    def do_p(self, arg):
        """p expression
        Print the value of the expression.
        """
        self._msg_val_func(arg, repr)

    def _msg_val_func(self, arg, func):
        try:
            val = self._getval(arg)
        except:
            return  # _getval() has displayed the error
        try:
            self.message(func(val))
        except:
            self._error_exc()

    def _getval(self, arg):
        try:
            # 看到这里就破案了这不是和我们自己实现的 pdb 获取变量的方式一样嘛 都是
            # 使用当前执行栈帧的全局和局部变量交给 eval 函数处理 并且将它的返回值输出
            return eval(arg, self.curframe.f_globals, self.curframe_locals)
        except:
            self._error_exc()
raiseThe above is the detailed content of What is the implementation principle of the debugger in the Python virtual machine?. For more information, please follow other related articles on the PHP Chinese website!

Hot AI Tools

Undresser.AI Undress
AI-powered app for creating realistic nude photos

AI Clothes Remover
Online AI tool for removing clothes from photos.

Undress AI Tool
Undress images for free

Clothoff.io
AI clothes remover

AI Hentai Generator
Generate AI Hentai for free.

Hot Article

Hot Tools

Notepad++7.3.1
Easy-to-use and free code editor

SublimeText3 Chinese version
Chinese version, very easy to use

Zend Studio 13.0.1
Powerful PHP integrated development environment

Dreamweaver CS6
Visual web development tools

SublimeText3 Mac version
God-level code editing software (SublimeText3)

Hot Topics
 How to solve the permissions problem encountered when viewing Python version in Linux terminal?
Apr 01, 2025 pm 05:09 PM
Solution to permission issues when viewing Python version in Linux terminal When you try to view Python version in Linux terminal, enter python...
 How to efficiently copy the entire column of one DataFrame into another DataFrame with different structures in Python?
Apr 01, 2025 pm 11:15 PM
When using Python's pandas library, how to copy whole columns between two DataFrames with different structures is a common problem. Suppose we have two Dats...
 Python hourglass graph drawing: How to avoid variable undefined errors?
Apr 01, 2025 pm 06:27 PM
Getting started with Python: Hourglass Graphic Drawing and Input Verification This article will solve the variable definition problem encountered by a Python novice in the hourglass Graphic Drawing Program. Code...
 Python Cross-platform Desktop Application Development: Which GUI Library is the best for you?
Apr 01, 2025 pm 05:24 PM
Choice of Python Cross-platform desktop application development library Many Python developers want to develop desktop applications that can run on both Windows and Linux systems...
 Do Google and AWS provide public PyPI image sources?
Apr 01, 2025 pm 05:15 PM
Many developers rely on PyPI (PythonPackageIndex)...
 How to efficiently count and sort large product data sets in Python?
Apr 01, 2025 pm 08:03 PM
Data Conversion and Statistics: Efficient Processing of Large Data Sets This article will introduce in detail how to convert a data list containing product information to another containing...
 How to optimize processing of high-resolution images in Python to find precise white circular areas?
Apr 01, 2025 pm 06:12 PM
How to handle high resolution images in Python to find white areas? Processing a high-resolution picture of 9000x7000 pixels, how to accurately find two of the picture...
 How to solve the problem of file name encoding when connecting to FTP server in Python?
Apr 01, 2025 pm 06:21 PM
When using Python to connect to an FTP server, you may encounter encoding problems when obtaining files in the specified directory and downloading them, especially text on the FTP server...


