How to perform visualization and dynamic analysis in PHP?
In modern web development, PHP is a widely used server-side language. Its simplicity, ease of learning, rich functions, and high flexibility make it one of the preferred languages for many web developers. However, during the development process, developers need to perform visual and dynamic analysis of the code to ensure the quality and performance of the code. This article will introduce visualization and dynamic analysis in PHP.
1. Visualization
Visualization is very important in the software development process. In PHP development, visual analysis tools can help developers deeply understand the running status, efficiency and performance of the program, and can provide great help in debugging and modifying the code. Below are some of the more commonly used visualization tools in PHP.
- Xdebug
Xdebug is a PHP debugging tool. It can collect various code execution information when running PHP, including function calls, variable assignments, code coverage statistics, etc. This information can help developers quickly locate problems during the development process, and can be debugged through editors such as VSCode. Xdebug also provides remote debugging functionality, which can help developers debug on remote servers.
- Blackfire
Blackfire is a PHP performance analysis tool that helps developers optimize the performance of PHP applications. It can track the resource consumption of PHP code during execution and provide detailed analysis reports to help developers find performance bottlenecks and optimization points. Blackfire also provides a rich command line and web interface, allowing developers to easily view analysis results and solve problems in a targeted manner.
- PHPDBG
PHPDBG is a lightweight PHP debugger that can be used in PHP 5.6 and above. Compared with Xdebug, PHPDBG is lighter and less complex than Xdebug. PHPDBG can provide developers with a simple, fast and direct debugging method. It provides an interactive command line interface and implements standard GDB commands, allowing developers to easily debug PHP programs.
2. Dynamic Analysis
Dynamic analysis is a technology used to examine the behavior of a program while it is running. Compared with static analysis, dynamic analysis can help developers gain a deeper understanding of a program's behavior and can detect some problems that cannot be found at compile time. The following are several commonly used PHP dynamic analysis methods.
- Profilers
PHP’s Profilers (analyzer) are tools for tracking and counting code execution. They measure the resources an application consumes during execution, such as CPU time and memory usage. Some profilers also show an application's function call dynamics graph, code coverage, and performance bottlenecks. Some non-open source analyzers, such as New Relic and AppDynamics, also provide excellent performance optimization suggestions.
- Fuzzing
Fuzzing is a widely used dynamic analysis method often used for web application security testing. Fuzzing tests applications by inputting random data to detect vulnerabilities and other errors in the program. Fuzzing can help developers quickly detect vulnerabilities and errors in code, which is of great significance for protecting application security.
- Load testing
Load testing is a stress test performed by simulating real user traffic. It can simulate user behavior and stress test applications using various tools such as JMeter and ApacheBench. Stress testing can detect application performance bottlenecks and failures and is very useful for solving performance problems.
Summary
PHP’s visualization and dynamic analysis tools can help developers better understand the running status and performance of the program, so as to better optimize the application. This article introduces common PHP visualization and dynamic analysis methods, including Xdebug, Blackfire, PHPDBG, Profilers, Fuzzing and Load testing. Developers can choose appropriate tools to optimize development efficiency and program performance based on the actual needs of the project.
The above is the detailed content of How to perform visualization and dynamic analysis in PHP?. For more information, please follow other related articles on the PHP Chinese website!

Hot AI Tools

Undresser.AI Undress
AI-powered app for creating realistic nude photos

AI Clothes Remover
Online AI tool for removing clothes from photos.

Undress AI Tool
Undress images for free

Clothoff.io
AI clothes remover

AI Hentai Generator
Generate AI Hentai for free.

Hot Article

Hot Tools

Notepad++7.3.1
Easy-to-use and free code editor

SublimeText3 Chinese version
Chinese version, very easy to use

Zend Studio 13.0.1
Powerful PHP integrated development environment

Dreamweaver CS6
Visual web development tools

SublimeText3 Mac version
God-level code editing software (SublimeText3)

Hot Topics
 1377
1377
 52
52
 PHP 8.4 Installation and Upgrade guide for Ubuntu and Debian
Dec 24, 2024 pm 04:42 PM
PHP 8.4 brings several new features, security improvements, and performance improvements with healthy amounts of feature deprecations and removals. This guide explains how to install PHP 8.4 or upgrade to PHP 8.4 on Ubuntu, Debian, or their derivati
 Discuss CakePHP
Sep 10, 2024 pm 05:28 PM
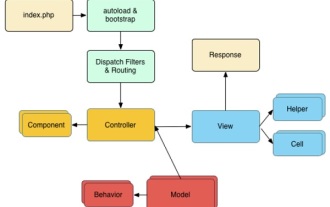
CakePHP is an open-source framework for PHP. It is intended to make developing, deploying and maintaining applications much easier. CakePHP is based on a MVC-like architecture that is both powerful and easy to grasp. Models, Views, and Controllers gu
 CakePHP File upload
Sep 10, 2024 pm 05:27 PM
To work on file upload we are going to use the form helper. Here, is an example for file upload.
 How To Set Up Visual Studio Code (VS Code) for PHP Development
Dec 20, 2024 am 11:31 AM
Visual Studio Code, also known as VS Code, is a free source code editor — or integrated development environment (IDE) — available for all major operating systems. With a large collection of extensions for many programming languages, VS Code can be c
 CakePHP Quick Guide
Sep 10, 2024 pm 05:27 PM
CakePHP is an open source MVC framework. It makes developing, deploying and maintaining applications much easier. CakePHP has a number of libraries to reduce the overload of most common tasks.
 How do you parse and process HTML/XML in PHP?
Feb 07, 2025 am 11:57 AM
This tutorial demonstrates how to efficiently process XML documents using PHP. XML (eXtensible Markup Language) is a versatile text-based markup language designed for both human readability and machine parsing. It's commonly used for data storage an
 Explain JSON Web Tokens (JWT) and their use case in PHP APIs.
Apr 05, 2025 am 12:04 AM
JWT is an open standard based on JSON, used to securely transmit information between parties, mainly for identity authentication and information exchange. 1. JWT consists of three parts: Header, Payload and Signature. 2. The working principle of JWT includes three steps: generating JWT, verifying JWT and parsing Payload. 3. When using JWT for authentication in PHP, JWT can be generated and verified, and user role and permission information can be included in advanced usage. 4. Common errors include signature verification failure, token expiration, and payload oversized. Debugging skills include using debugging tools and logging. 5. Performance optimization and best practices include using appropriate signature algorithms, setting validity periods reasonably,
 PHP Program to Count Vowels in a String
Feb 07, 2025 pm 12:12 PM
A string is a sequence of characters, including letters, numbers, and symbols. This tutorial will learn how to calculate the number of vowels in a given string in PHP using different methods. The vowels in English are a, e, i, o, u, and they can be uppercase or lowercase. What is a vowel? Vowels are alphabetic characters that represent a specific pronunciation. There are five vowels in English, including uppercase and lowercase: a, e, i, o, u Example 1 Input: String = "Tutorialspoint" Output: 6 explain The vowels in the string "Tutorialspoint" are u, o, i, a, o, i. There are 6 yuan in total


