

How to debug code in PHP

When developing PHP applications, you often encounter situations where you need to debug code. Debugging is a necessary step to troubleshoot program problems, find errors in your code, and improve program performance. In PHP, debugging is done using a debugger. This article will introduce how to use the debugger to debug code in PHP.
1. Configure the debugging environment
Before starting debugging, you need to configure the debugging environment. The purpose of configuring the debugging environment is to enable the debugger to run to help you debug your code. There are two main types of PHP debuggers: XDebug and Zend Debugger. Both debuggers are available on platforms including Windows, Mac, and Linux. If you haven't installed the debugger yet, follow the instructions for your platform to install it.
2. Set up the debugger
After configuring the debugger, you need to set up the debugger so that it can start normally. Depending on the debugger, this may need to be set in the php.ini file or other configuration files. For example, when using the XDebug debugger, this can be set by editing the php.ini file. The specific operations are as follows:
1. Open the php.ini file.
2. Find the XDebug module and set its value to "On".
3. Set the IP address and port number for remote debugging.
4. Restart Apache (or other web server).
3. Use the debugger
After completing the configuration and setting up the debugger, you can start using the debugger to debug the code. Below are some commonly used PHP debugger tools.
- PhpStorm - a commonly used PHP IDE. It has a built-in XDebug debugger and provides powerful debugging functions, such as breakpoint debugging, variable monitoring, code tracing, etc.
- Zend Studio - is also a commonly used PHP IDE. It integrates the Zend Debugger debugger and provides debugging capabilities similar to PhpStorm.
- XDebug Helper - When you use a browser, you can use this browser plug-in to enable the XDebug debugger. It can set breakpoints, trace code, view variables, and more.
- DBG - a text interface debugger. It can perform single-step debugging, breakpoint debugging and trace program execution.
When using the above debugger tools, please refer to their official documentation to learn how to operate them. Generally speaking, you can debug code by setting breakpoints, running programs, viewing variables, etc.
4. Debugging skills
When using a debugger to debug code, you need the assistance of some debugging skills. Here are some common debugging tips.
1. Set a breakpoint - Set a breakpoint in the code. When the program reaches this point, the program will stop executing. This allows you to debug specific parts of a program rather than the entire program.
2. View variables - Viewing variables can help you determine the value of a variable, so you can check whether the variable is passed to the function or method correctly.
3. Run the program - By running the program, you can run the program step by step to understand at what point the program has problems.
4. Single-step debugging - Through single-step debugging, you can step by step view the execution of each code segment. This helps understand syntax issues and operational issues in your code.
5. Reference materials
- Official documentation: http://xdebug.org/docs/
- Wiki documentation: https://en.wikipedia.org /wiki/PHP_debugger
Summary
Debugging is an essential step in developing PHP applications. In PHP, the debugger is a commonly used tool that can help you analyze errors, view variables, and find problems in your code. By configuring the debugging environment, setting up the debugger, using the debugger, and applying some debugging techniques, you can debug your code more easily and quickly, improve program performance, and reduce errors.
The above is the detailed content of How to debug code in PHP. For more information, please follow other related articles on the PHP Chinese website!

Hot AI Tools

Undresser.AI Undress
AI-powered app for creating realistic nude photos

AI Clothes Remover
Online AI tool for removing clothes from photos.

Undress AI Tool
Undress images for free

Clothoff.io
AI clothes remover

Video Face Swap
Swap faces in any video effortlessly with our completely free AI face swap tool!
Hot Article
Hot Tools

Notepad++7.3.1
Easy-to-use and free code editor

SublimeText3 Chinese version
Chinese version, very easy to use

Zend Studio 13.0.1
Powerful PHP integrated development environment

Dreamweaver CS6
Visual web development tools

SublimeText3 Mac version
God-level code editing software (SublimeText3)
Hot Topics


 How to solve the problem of invalid debugging when setting breakpoints in SpringBoot project
May 11, 2023 am 10:49 AM
How to solve the problem of invalid debugging when setting breakpoints in SpringBoot project
May 11, 2023 am 10:49 AM
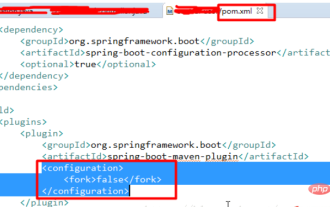
I am new to the springboot project. (1) I found that breakpoint debugging was ineffective. I was very depressed and searched for solutions online. All I saw were some very complicated solutions, which were said to be remote debugging, but also required additional opening slogans. This is different from a traditional project, so I don’t think it’s necessary. So after some exploration, I found that there is a simpler way. The steps are as follows: Add a configuration in the plugin part of the pom file: false and it will be ok; (2) Regarding the error in the SpringBoot project that the web.xml file is missing, because Traditional web projects require web.xml files, but SpringBoot projects do not require web.xml files.
 Will enabling XDebug on a production server make PHP slower?
Sep 22, 2023 pm 10:41 PM
Will enabling XDebug on a production server make PHP slower?
Sep 22, 2023 pm 10:41 PM
Yes, debuggers like XDebug can slow down PHP server performance. This is why the debugger is not placed in a server environment. They are deployed in different environments to avoid unnecessary overhead. Debug messages cannot be displayed in applications that are already in production. When debugging behavior is added to the server, the debugging engine is attached to the PHP process. It starts receiving messages to stop at the breakpoint, but this is not required behavior as it would give a performance hit to other processes, thus stopping the PHP parser. On the other hand, when debuggers are installed, they tend to open ports in the server because they are not intended for use in a production environment. Opening a port in your server is just as bad as opening a door for hackers to snoop through.
 How to use Xdebug for PHP function debugging?
Apr 17, 2024 am 11:12 AM
How to use Xdebug for PHP function debugging?
Apr 17, 2024 am 11:12 AM
By installing the XdebugPHP extension and enabling it, you can debug PHP functions using an Xdebug client such as PhpStorm or VSCode. Set breakpoints, run scripts using the IDE, enter debug mode to inspect variables, perform step-by-step debugging and view call stacks. In a practical case, you can set breakpoints on the sum function and use the debugger to view variables and execution flow to debug errors or optimize the code.
 How to debug CLI mode in PHPStorm?
Apr 01, 2025 pm 02:57 PM
How to debug CLI mode in PHPStorm?
Apr 01, 2025 pm 02:57 PM
How to debug CLI mode in PHPStorm? When developing with PHPStorm, sometimes we need to debug PHP in command line interface (CLI) mode...
 Debugging library in PHP8.0: Xdebug
May 14, 2023 am 08:09 AM
Debugging library in PHP8.0: Xdebug
May 14, 2023 am 08:09 AM
Debugging is an inevitable part of PHP development. In order to help developers debug their own code more easily, PHP8.0 introduced a very useful tool in its debugging library: Xdebug. This article will introduce some of the main features of Xdebug and how to use it to simplify the process of PHP debugging. Xdebug is an open source debugging tool that can capture errors in PHP applications and provide detailed error stack trace information, as well as the variables being used. It helps developers detect and troubleshoot code
 Code debugging methods for PHP functions
Apr 10, 2024 am 11:39 AM
Code debugging methods for PHP functions
Apr 10, 2024 am 11:39 AM
Code debugging methods for PHP functions include: Built-in debugger: Use var_dump() or print_r() to output the contents of a variable or array. Logging: Use the error_log() function to record debugging messages to the specified file or system log. Breakpoint: Pause the program at a specific point in the code to examine variable values and execution flow. Exception handling: Use try-catch blocks to handle exceptions thrown in functions and print exception messages and stack traces. Xdebug Debugger: Provides advanced debugging features such as tracking variable values, setting breakpoints and analyzing code coverage.
 Using Xdebug debugging technology in ThinkPHP6
Jun 20, 2023 pm 09:14 PM
Using Xdebug debugging technology in ThinkPHP6
Jun 20, 2023 pm 09:14 PM
ThinkPHP6 is a popular PHP framework that uses a variety of technologies to make development more convenient. One such technology is debugging tools such as Xdebug. In this article, we will explore how to use Xdebug for debugging in ThinkPHP6. Install and configure Xdebug Before you start using Xdebug, you first need to install and enable it. In the php.ini file, you can add the following configuration: [xdebug]zend_extension=x
 Development tools in PHP
May 23, 2023 am 08:18 AM
Development tools in PHP
May 23, 2023 am 08:18 AM
PHP is a programming language widely used in web development. For PHP development tools, choosing a suitable tool can make the developer's work more efficient and convenient. In this article, we will discuss several common PHP development tools, including integrated development environments (IDEs), text editors, and debugging tools. 1. Integrated development environment (IDE) PhpStorm PhpStorm is a powerful PHP development environment developed by JetBrains. It not only supports PH
