

How to use the functions of Python folium

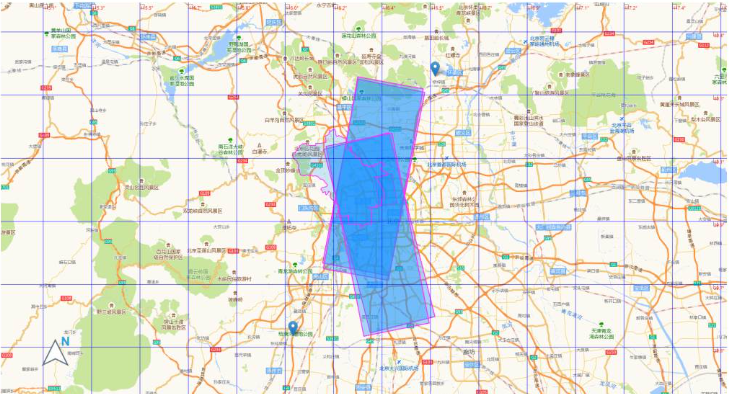
1. Rendering
2. Layer control
The folium official also provides some clearer methods for us to use. Just like layer control. The official method name is FeatureGroup, and the import method is from folium import FeatureGroup, or folium.FeatureGroup(). I won’t go into details about the specific principles here, but mainly look at the examples:
import folium
def map2png(map_data,out_file='pdf.png'):
# 1.直接构造,默认底图
mo = folium.Map(location=[0, 0])
# 2.图层1-高德底图+数据
fg = folium.FeatureGroup()
# 2.1 高德地图
fg.add_child(folium.TileLayer(
tiles='http://webrd02.is.autonavi.com/appmaptile?lang=zh_cn&size=1&scale=1&style=8&x={x}&y={y}&z={z}',
attr="© <a href=http://ditu.amap.com/>高德地图</a>",
min_zoom=0,
max_zoom=19,
control=True,
zoom_control=False,
show=True))
# 2.2添加一个点
fg.add_child(folium.Marker(
location=[45.3311, -121.7113],
popup="Timberline Lodge",
icon=folium.Icon(color="green")))
# 2.3添加一个线形
fg.add_child(folium.PolyLine(
locations=[[38.68,115.67],
[38.85,115.48],
[38.65,115.37],
[38.68,115.67]],
color='green', weight=2, opacity=1))
# 2.4添加一个面
fg.add_child(folium.Polygon(
locations=[[38.68,115.67],
[38.85,115.48],
[38.65,115.37],
[38.68,115.67]],
color='green', weight=2,
fill=True,fill_color = 'red'))
# 2.5将我们的图层加入map
mo.add_child(fg)
# 3.图层2-重点数据+最上层
fg2 = folium.FeatureGroup()
fg2.add_child(folium.Polygon(
locations=[[38.68,115.67],
[38.85,115.48],
[38.65,115.37],
[38.68,115.67]],
color='green', weight=2,
fill=True,fill_color = 'red'))
mo.add_child(fg2)
# 4.将图层fg2显示在最上层,keep_in_front的参数必须是FeatureGroup或TileLayer对象
mo.keep_in_front(fg2)
# 5.根据范围缩放地图
mo.fit_bounds([[38.68,115.67],
[38.85,115.48],
[38.65,115.37],
[38.68,115.67]])
root = mo.get_root()
html = root.render() # 这个拿到的就是一个html的内容
# mo.save('text.html')3. North Arrow
The North Arrow function is not necessarily necessary for maps, but adding it It's always good to go up. The use of FloatImage can achieve this function, although the relevant content is not mentioned in the official documentation and source code analysis. There are many plug-ins provided in the official documentation, the most widely used of which is the HeatMap method called heat map.
The FloatImage method implements placing a picture on the screen and specifying the size of the picture and the position on the screen. The parameters are integers (the FloatImage method implements percentage conversion). Based on the second code, we added the image to the lower left corner.
fg.add_child(FloatImage(os.path.join(base, 'map_png', 'image', 'compass.png'), left=5, bottom=10, width=5))
4. Add js and css to folium
folium official does not provide relevant methods for adding js and css. Many methods on the Internet should be extracted based on interpreting the source code. Relatively speaking, It is relatively simple, and there are no relevant instructions on how to add js and css.
It can be known from the source code that the map function in folium is implemented through jinjia2 to load HTML for data and map.
There are three main methods of adding data and maps used in the source code. These methods have flaws (can only be added at the front). These methods can be used in most scenarios. If they do not involve operations on map objects, these three methods can meet the requirements.
1.Header adds js and css
    init_script = """
        var mapsPlaceholder = [];
        L.Map.addInitHook(function () {mapsPlaceholder.push(this);});
    """
    # 加在header最上边
    mo.get_root().header.add_child(folium.Element(init_script))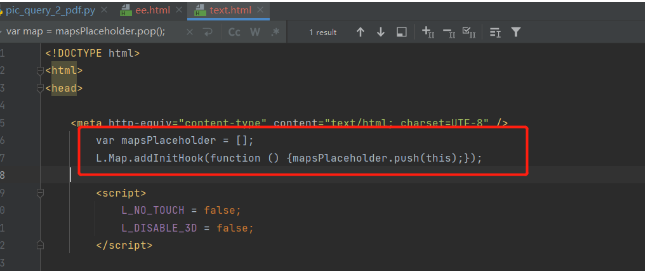
2.body adds js and css
    init_script = """
        var mapsPlaceholder = [];
        L.Map.addInitHook(function () {mapsPlaceholder.push(this);});
    """
    # 加在body中
    mo.get_root().html.add_child(folium.Element(init_script))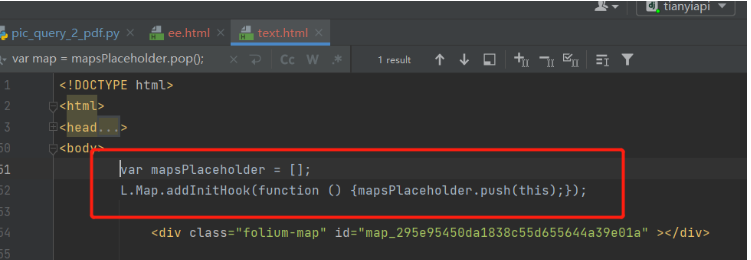
3.script to add js and css
    init_script = """
        var mapsPlaceholder = [];
        L.Map.addInitHook(function () {mapsPlaceholder.push(this);});
    """
    # 加在script中
    mo.get_root().script.add_child(folium.Element(init_script))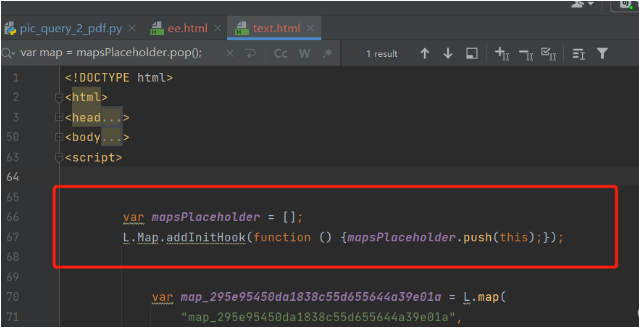
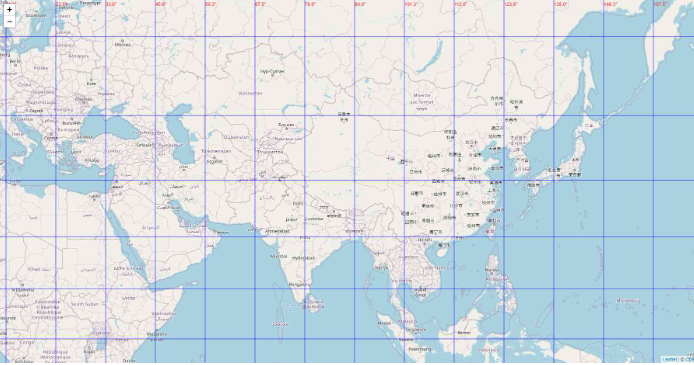
5. Longitude and latitude grid lines
The previous step implemented adding js and css in different locations of the html file method, if it involves the operation of the map object, there may be situations that are not satisfactory, such as adding longitude and latitude grid lines. It is troublesome to implement the function of latitude and longitude grid lines. The main difficulties are as follows:
1. There are no official relevant methods and plug-ins (currently none);
2.folium relies on leadlet.js for implementation If you want to implement the third-party library of latitude and longitude, you need to be familiar with leaflet (only one related article was found on the Internet);
3. The above article is completed by the front end, and there is no direct back-end implementation method.
4. The front-end implementation method is to directly build the map. Here, the map creation object is not available (the map object is randomly generated).
How to determine the latitude and longitude grid lines?
We need to store the object when creating the map object, then get the map object and implement the grid lines according to the zoom level. An important task is to ensure that the JavaScript code is correctly embedded into the HTML page before and after creating the map object.
It has been implemented to store the object in four when the map object is created. By studying the folium source code, the method of adding js has been rewritten to add js after the map object is created.
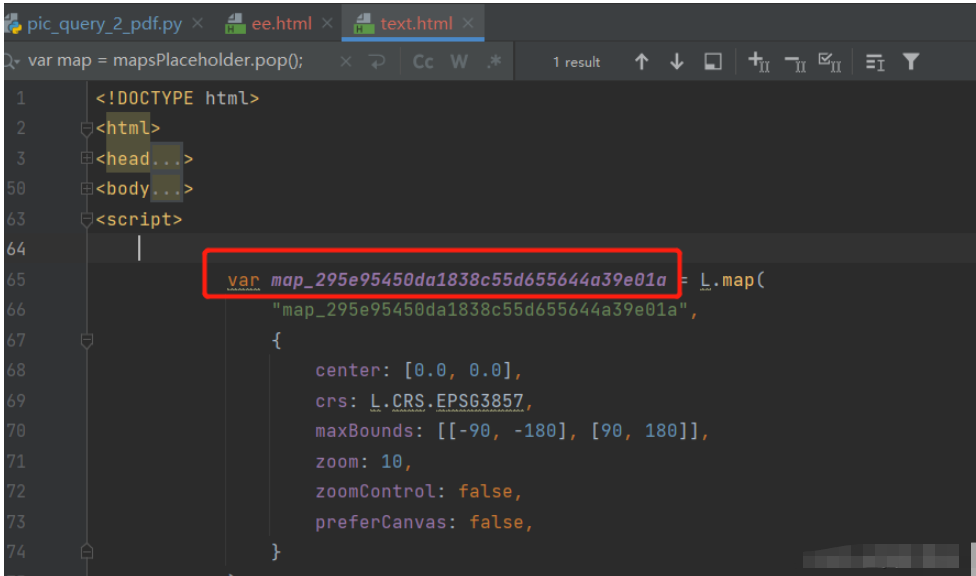
1.html page to implement the latitude and longitude grid
<!DOCTYPE html>
<html lang="en">
<head>
<meta charset="UTF-8" />
<meta http-equiv="X-UA-Compatible" content="IE=edge" />
<meta name="viewport" content="width=device-width, initial-scale=1.0" />
<link
rel="stylesheet"
href="https://unpkg.com/leaflet@1.7.1/dist/leaflet.css" rel="external nofollow"
/>
<script src="https://unpkg.com/leaflet@1.7.1/dist/leaflet.js"></script>
<title>leaflet-经纬网格</title>
<style>
html,
body {
width: 100%;
height: 100%;
padding: 0;
margin: 0;
}
.leaflet-div-icon {
background: none;
border: none;
}
</style>
</head>
<body>
<div id="map" ></div>
<script>
let map = L.map("map", { renderer: L.canvas({ padding: 0.5 }) }).setView(
[25.127879288597576, 118.37905883789064],
4
);
// 添加背景图层
L.tileLayer("https://{s}.tile.openstreetmap.org/{z}/{x}/{y}.png", {
attribution:
'© <a href="https://www.openstreetmap.org/copyright" rel="external nofollow" >OpenStreetMap</a> contributors',
}).addTo(map);
// 创建图层
let lonLatGridLineLayer = L.featureGroup().addTo(map);
// 经纬网格生成方法
let addLonLatLine = () => {
let zoom = map.getZoom();
let bounds = map.getBounds();
let north = bounds.getNorth();
let east = bounds.getEast();
// 经纬度间隔
let d = 90 / Math.pow(2, zoom - 1);
// 经线网格
for (let index = -180; index <= 360; index += d) {
// 判断当前视野内
if (bounds.contains([north, index])) {
// 绘制经线
let lonLine = L.polyline(
[
[-90, index],
[90, index],
],
{ weight: 1, color: "blue" }
);
lonLatGridLineLayer.addLayer(lonLine);
// 标注
let text = index.toFixed(1) + "°";
// 动态计算小数位数
if (zoom > 10) {
text = index.toFixed((zoom - 8) / 2) + "°";
}
let divIcon = L.divIcon({
html: `<div >${text}</div>`,
iconAnchor: [0, -5],
});
let textMarker = L.marker([north, index], { icon: divIcon });
lonLatGridLineLayer.addLayer(textMarker);
}
}
if(d>90)d=90;
// 纬线网格
for (let index = -90; index <= 90; index += d) {
if (bounds.contains([index, east])) {
let lonLine = L.polyline(
[
[index, -180],
[index, 360],
],
{ weight: 1, color: "blue" }
);
lonLatGridLineLayer.addLayer(lonLine);
// 标注
let text = index.toFixed(1) + "°";
if (zoom > 10) {
text = index.toFixed((zoom - 8) / 2) + "°";
}
let divIcon = L.divIcon({
html: `<div >${text}</div>`,
iconAnchor: [(text.length + 1) * 6, 0],
});
let textMarker = L.marker([index, east], { icon: divIcon });
lonLatGridLineLayer.addLayer(textMarker);
}
}
};
addLonLatLine();
map.on("zoomend move", () => {
lonLatGridLineLayer.clearLayers();
addLonLatLine();
});
</script>
</body>
</html>2. Customize the grid line class
Through the class inheritance relationship of the source code, I inherit the MacroElement class.
from branca.element import MacroElement,
from jinja2 import Template
from folium.vector_layers import path_options
class Jwwg(MacroElement):
"""自定义经纬线网格"""
_template = Template("""
{% macro script(this, kwargs) %}
var map = mapsPlaceholder.pop();
// 创建图层
let lonLatGridLineLayer = L.featureGroup().addTo(map);
// 经纬网格生成方法
let addLonLatLine = () => {
let zoom = map.getZoom();
let bounds = map.getBounds();
let north = bounds.getNorth();
let east = bounds.getEast();
// 经纬度间隔
let d = 90 / Math.pow(2, zoom - 1);
// 经线网格
for (let index = -180; index <= 360; index += d) {
// 判断当前视野内
if (bounds.contains([north, index])) {
// 绘制经线
let lonLine = L.polyline(
[
[-90, index],
[90, index],
],
{weight: 1, color: "blue"}
);
lonLatGridLineLayer.addLayer(lonLine);
// 标注
let text = index.toFixed(1) + "°";
// 动态计算小数位数
if (zoom > 10) {
text = index.toFixed((zoom - 8) / 2) + "°";
}
let divIcon = L.divIcon({
html: `<div >${text}</div>`,
iconAnchor: [0, -5],
});
let textMarker = L.marker([north, index], {icon: divIcon});
lonLatGridLineLayer.addLayer(textMarker);
}
}
if (d > 90) d = 90;
// 纬线网格
for (let index = -90; index <= 90; index += d) {
if (bounds.contains([index, east])) {
let lonLine = L.polyline(
[
[index, -180],
[index, 360],
],
{weight: 1, color: "blue"}
);
lonLatGridLineLayer.addLayer(lonLine);
// 标注
let text = index.toFixed(1) + "°";
if (zoom > 10) {
text = index.toFixed((zoom - 8) / 2) + "°";
}
let divIcon = L.divIcon({
html: `<div >${text}</div>`,
iconAnchor: [(text.length + 1) * 6, 0],
});
let textMarker = L.marker([index, east], {icon: divIcon});
lonLatGridLineLayer.addLayer(textMarker);
}
}
};
addLonLatLine();
map.on("zoomend move", () => {
lonLatGridLineLayer.clearLayers();
addLonLatLine();
});
{% endmacro %}
""")
def __init__(self, **kwargs):
super(Jwwg, self).__init__()
self._name = 'Jwwg'
self.options = path_options(line=True, **kwargs)3. Implement grid lines
import folium
def map2png(map_data,out_file='pdf.png'):
# 1.直接构造,默认底图
mo = folium.Map(location=[0, 0])
# 2.图层1-高德底图+数据
fg = folium.FeatureGroup()
# 2.1 高德地图
fg.add_child(folium.TileLayer(
tiles='http://webrd02.is.autonavi.com/appmaptile?lang=zh_cn&size=1&scale=1&style=8&x={x}&y={y}&z={z}',
attr="© <a href=http://ditu.amap.com/>高德地图</a>",
min_zoom=0,
max_zoom=19,
control=True,
zoom_control=False,
show=True))
# 2.2添加一个点
fg.add_child(folium.Marker(
location=[45.3311, -121.7113],
popup="Timberline Lodge",
icon=folium.Icon(color="green")))
# 2.3添加一个线形
fg.add_child(folium.PolyLine(
locations=[[38.68,115.67],
[38.85,115.48],
[38.65,115.37],
[38.68,115.67]],
color='green', weight=2, opacity=1))
# 2.4添加一个面
fg.add_child(folium.Polygon(
locations=[[38.68,115.67],
[38.85,115.48],
[38.65,115.37],
[38.68,115.67]],
color='green', weight=2,
fill=True,fill_color = 'red'))
# 2.5将我们的图层加入map
mo.add_child(fg)
# 5.根据范围缩放地图
mo.fit_bounds([[38.68,115.67],
[38.85,115.48],
[38.65,115.37],
[38.68,115.67]])
# 网格线
init_script = """
var mapsPlaceholder = [];
L.Map.addInitHook(function () {mapsPlaceholder.push(this);});
"""
mo.get_root().script.add_child(folium.Element(init_script))
Jwwg().add_to(mo)
root = mo.get_root()
html = root.render() # 这个拿到的就是一个html的内容
# mo.save('text.html')The above is the detailed content of How to use the functions of Python folium. For more information, please follow other related articles on the PHP Chinese website!

Hot AI Tools

Undresser.AI Undress
AI-powered app for creating realistic nude photos

AI Clothes Remover
Online AI tool for removing clothes from photos.

Undress AI Tool
Undress images for free

Clothoff.io
AI clothes remover

AI Hentai Generator
Generate AI Hentai for free.

Hot Article
Hot Tools

Notepad++7.3.1
Easy-to-use and free code editor

SublimeText3 Chinese version
Chinese version, very easy to use

Zend Studio 13.0.1
Powerful PHP integrated development environment

Dreamweaver CS6
Visual web development tools

SublimeText3 Mac version
God-level code editing software (SublimeText3)
Hot Topics


 Can the Python interpreter be deleted in Linux system?
Apr 02, 2025 am 07:00 AM
Can the Python interpreter be deleted in Linux system?
Apr 02, 2025 am 07:00 AM
Regarding the problem of removing the Python interpreter that comes with Linux systems, many Linux distributions will preinstall the Python interpreter when installed, and it does not use the package manager...
 How to solve the problem of Pylance type detection of custom decorators in Python?
Apr 02, 2025 am 06:42 AM
How to solve the problem of Pylance type detection of custom decorators in Python?
Apr 02, 2025 am 06:42 AM
Pylance type detection problem solution when using custom decorator In Python programming, decorator is a powerful tool that can be used to add rows...
 Python asyncio Telnet connection is disconnected immediately: How to solve server-side blocking problem?
Apr 02, 2025 am 06:30 AM
Python asyncio Telnet connection is disconnected immediately: How to solve server-side blocking problem?
Apr 02, 2025 am 06:30 AM
About Pythonasyncio...
 How to solve permission issues when using python --version command in Linux terminal?
Apr 02, 2025 am 06:36 AM
How to solve permission issues when using python --version command in Linux terminal?
Apr 02, 2025 am 06:36 AM
Using python in Linux terminal...
 Python 3.6 loading pickle file error ModuleNotFoundError: What should I do if I load pickle file '__builtin__'?
Apr 02, 2025 am 06:27 AM
Python 3.6 loading pickle file error ModuleNotFoundError: What should I do if I load pickle file '__builtin__'?
Apr 02, 2025 am 06:27 AM
Loading pickle file in Python 3.6 environment error: ModuleNotFoundError:Nomodulenamed...
 Do FastAPI and aiohttp share the same global event loop?
Apr 02, 2025 am 06:12 AM
Do FastAPI and aiohttp share the same global event loop?
Apr 02, 2025 am 06:12 AM
Compatibility issues between Python asynchronous libraries In Python, asynchronous programming has become the process of high concurrency and I/O...
 What should I do if the '__builtin__' module is not found when loading the Pickle file in Python 3.6?
Apr 02, 2025 am 07:12 AM
What should I do if the '__builtin__' module is not found when loading the Pickle file in Python 3.6?
Apr 02, 2025 am 07:12 AM
Error loading Pickle file in Python 3.6 environment: ModuleNotFoundError:Nomodulenamed...
 How to ensure that the child process also terminates after killing the parent process via signal in Python?
Apr 02, 2025 am 06:39 AM
How to ensure that the child process also terminates after killing the parent process via signal in Python?
Apr 02, 2025 am 06:39 AM
The problem and solution of the child process continuing to run when using signals to kill the parent process. In Python programming, after killing the parent process through signals, the child process still...
