
 Operation and Maintenance
Linux Operation and Maintenance
How to check CPU performance indicators of Linux cloud server through top
Operation and Maintenance
Linux Operation and Maintenance
How to check CPU performance indicators of Linux cloud server through top
How to check CPU performance indicators of Linux cloud server through top

When the server becomes slow and the load is high, you need to first check whether the cpu load is too high. If the cpu load is high, then check to see what process is occupying the cpu resources.
1. cpu load:
View through the top command:
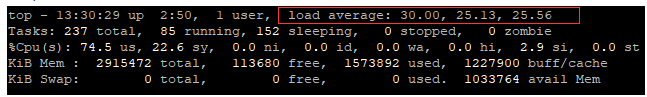
Mainly look at "load average", which can be understood as indicating the top 1, 5, and 15 minute load average. Generally, the number of CPUs with one core should not exceed 4. If it is a 4-core CPU, it should not exceed 16 (ie: number of CPU cores * 4). If it exceeds, it means that the load is high and there is an abnormality.
Other parameters are explained as follows:
us (user time) indicates the time when the CPU executes the user process, including ni time. Usually we only look at this.
sy(system time) indicates the CPU running time in the kernel, including IRQ and softirq time. High system CPU usage indicates that there is a bottleneck in some part of the system. Usually, the lower the value, the better.
wa(waiting time) The time CPI spends waiting for the I/O operation to complete. The system should not spend a lot of time waiting for the I/O operation, otherwise it means there is a problem with the I/O.
id(idle time) The system is in idle period, waiting for the process to run.
ni(nice time) The time it takes the system to adjust the process priority.
hi(hard irq time) The time it takes the system to process hard interrupts.
si(softirq time) The time it takes for the system to process software interrupts.
st(steal time) The time that is forced to wait for the virtual CPU while the hypervisor is serving another virtual processor.
2. Query the processes occupying the cpu
Continue to view through the top command:
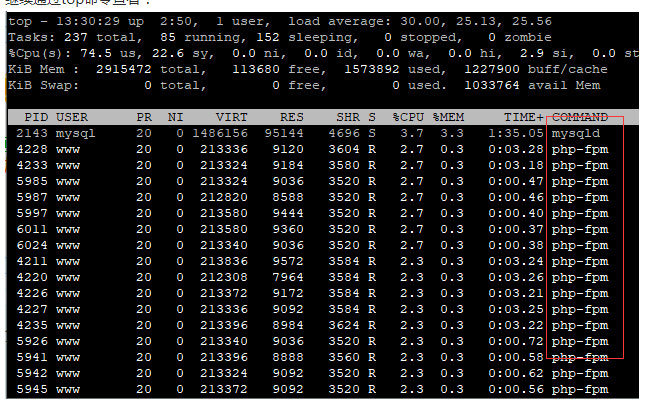
You can clearly find php -The fpm process takes up a lot of resources. php-fpm, mysql, httpd, nginx, etc. are all site web processes. If there is a large amount of resource usage, it usually means that the website has a large number of visits. At this time, you can open the website's access log for analysis. Generally speaking, the website with large access logs will also occupy a large amount of resources. You need to open the log to check and analyze it specifically to see if it is caused by a large number of visits or abnormal access (such as a large number of crawling by a certain type of spider, abnormal execution of a certain program connection, CC attack, etc.).
The above is the detailed content of How to check CPU performance indicators of Linux cloud server through top. For more information, please follow other related articles on the PHP Chinese website!

Hot AI Tools

Undresser.AI Undress
AI-powered app for creating realistic nude photos

AI Clothes Remover
Online AI tool for removing clothes from photos.

Undress AI Tool
Undress images for free

Clothoff.io
AI clothes remover

Video Face Swap
Swap faces in any video effortlessly with our completely free AI face swap tool!
Hot Article
Hot Tools

Notepad++7.3.1
Easy-to-use and free code editor

SublimeText3 Chinese version
Chinese version, very easy to use

Zend Studio 13.0.1
Powerful PHP integrated development environment

Dreamweaver CS6
Visual web development tools

SublimeText3 Mac version
God-level code editing software (SublimeText3)
Hot Topics


 What computer configuration is required for vscode
Apr 15, 2025 pm 09:48 PM
What computer configuration is required for vscode
Apr 15, 2025 pm 09:48 PM
VS Code system requirements: Operating system: Windows 10 and above, macOS 10.12 and above, Linux distribution processor: minimum 1.6 GHz, recommended 2.0 GHz and above memory: minimum 512 MB, recommended 4 GB and above storage space: minimum 250 MB, recommended 1 GB and above other requirements: stable network connection, Xorg/Wayland (Linux)
 vscode cannot install extension
Apr 15, 2025 pm 07:18 PM
vscode cannot install extension
Apr 15, 2025 pm 07:18 PM
The reasons for the installation of VS Code extensions may be: network instability, insufficient permissions, system compatibility issues, VS Code version is too old, antivirus software or firewall interference. By checking network connections, permissions, log files, updating VS Code, disabling security software, and restarting VS Code or computers, you can gradually troubleshoot and resolve issues.
 How to run java code in notepad
Apr 16, 2025 pm 07:39 PM
How to run java code in notepad
Apr 16, 2025 pm 07:39 PM
Although Notepad cannot run Java code directly, it can be achieved by using other tools: using the command line compiler (javac) to generate a bytecode file (filename.class). Use the Java interpreter (java) to interpret bytecode, execute the code, and output the result.
 Linux Architecture: Unveiling the 5 Basic Components
Apr 20, 2025 am 12:04 AM
Linux Architecture: Unveiling the 5 Basic Components
Apr 20, 2025 am 12:04 AM
The five basic components of the Linux system are: 1. Kernel, 2. System library, 3. System utilities, 4. Graphical user interface, 5. Applications. The kernel manages hardware resources, the system library provides precompiled functions, system utilities are used for system management, the GUI provides visual interaction, and applications use these components to implement functions.
 How to use VSCode
Apr 15, 2025 pm 11:21 PM
How to use VSCode
Apr 15, 2025 pm 11:21 PM
Visual Studio Code (VSCode) is a cross-platform, open source and free code editor developed by Microsoft. It is known for its lightweight, scalability and support for a wide range of programming languages. To install VSCode, please visit the official website to download and run the installer. When using VSCode, you can create new projects, edit code, debug code, navigate projects, expand VSCode, and manage settings. VSCode is available for Windows, macOS, and Linux, supports multiple programming languages and provides various extensions through Marketplace. Its advantages include lightweight, scalability, extensive language support, rich features and version
 Can vscode be used for mac
Apr 15, 2025 pm 07:36 PM
Can vscode be used for mac
Apr 15, 2025 pm 07:36 PM
VS Code is available on Mac. It has powerful extensions, Git integration, terminal and debugger, and also offers a wealth of setup options. However, for particularly large projects or highly professional development, VS Code may have performance or functional limitations.
 How to check the warehouse address of git
Apr 17, 2025 pm 01:54 PM
How to check the warehouse address of git
Apr 17, 2025 pm 01:54 PM
To view the Git repository address, perform the following steps: 1. Open the command line and navigate to the repository directory; 2. Run the "git remote -v" command; 3. View the repository name in the output and its corresponding address.
 What is vscode What is vscode for?
Apr 15, 2025 pm 06:45 PM
What is vscode What is vscode for?
Apr 15, 2025 pm 06:45 PM
VS Code is the full name Visual Studio Code, which is a free and open source cross-platform code editor and development environment developed by Microsoft. It supports a wide range of programming languages and provides syntax highlighting, code automatic completion, code snippets and smart prompts to improve development efficiency. Through a rich extension ecosystem, users can add extensions to specific needs and languages, such as debuggers, code formatting tools, and Git integrations. VS Code also includes an intuitive debugger that helps quickly find and resolve bugs in your code.
