MySQL performance indicator TPS+QPS+IOPS stress test example analysis
1. Overview of performance indicators
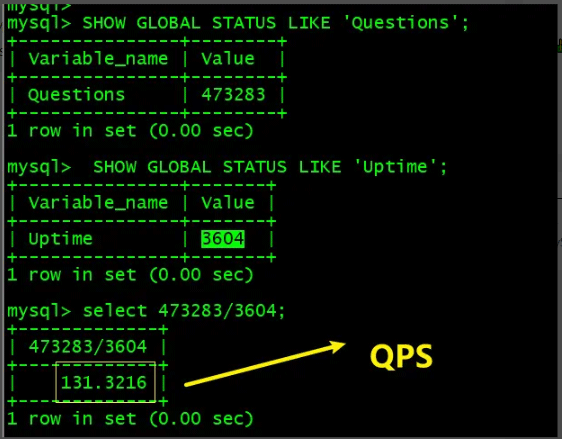
QPS (Queries Per Second) is the number of queries per second. For the database, it is the number of SQLs executed by the database per second (including insert, select, update, delete etc.).
TPS (Transactions Per Second) is the number of transactions per second. For a database, TPS is the number of transactions executed by the database per second, based on the number of successful commits.
IOPS The number of I/O operations performed by the disk per second
2. Indicator calculation method
2.1 TPS
Applicable to innodb Transactions Per Second (The number of transactions transmitted per second), that is, the number of transactions processed by the server per second
Generally, the performance of the evaluation system is measured by the number of technical transactions completed per second. The overall processing capacity of the system depends on the TPS value of the module with the lowest processing capacity
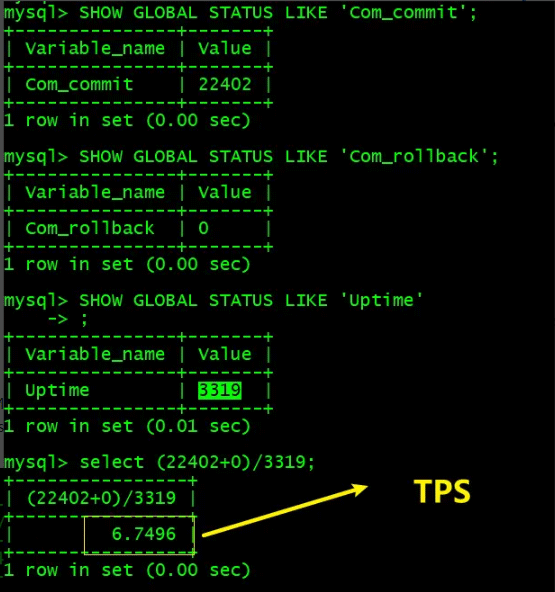
mysql> SHOW GLOBAL STATUS LIKE 'Com_commit';
+---------------+-------+
| Variable_name | Value |
+---------------+-------+
| Com_commit    | 22402 |
+---------------+-------+
1 row in set (0.00 sec)

mysql> SHOW GLOBAL STATUS LIKE 'Com_rollback';
+---------------+-------+
| Variable_name | Value |
+---------------+-------+
| Com_rollback  | 0     |
+---------------+-------+
1 row in set (0.00 sec)
mysql> SHOW GLOBAL STATUS LIKE 'Uptime'
    -> ;
+---------------+-------+
| Variable_name | Value |
+---------------+-------+
| Uptime        | 3319  |
+---------------+-------+
1 row in set (0.01 sec)
TPS=(Com_commit + Com_rollback)/Uptime
2.2 QPS
Applicable to both InnoDB and MyISAM engines Query rate per second (QPS) is a measure of how much traffic a specific query server handles within a specified period of time, corresponding to fetches/sec, that is, the number of response requests per second, which is the maximum throughput capability

2.3 IOPS
IOPS (Input/Output Per Second) is the input and output volume (or number of reads and writes) per second, which is the main indicator of disk performance. one. IOPS refers to the number of I/O requests that the system can handle per unit time. It is generally measured in the number of I/O requests processed per second. I/O requests are usually read or write data operation requests. For applications with frequent random reads and writes, such as OLTP (Online Transaction Processing), IOPS is a key measurement indicator. Another important indicator is data throughput (Throughput), which refers to the amount of data that can be successfully transmitted per unit time. For applications with a large number of sequential reads and writes, such as VOD (Video On Demand), more attention is paid to throughput indicators. IOPS can be broken down into the following indicators: Total IOPS, disk IOPS under mixed read-write and sequential random I/O loads,
This is most consistent with the actual I/O situation, and most applications focus on this indicator.
Random Read IOPS, IOPS under 100% random read load.
Random Write IOPS, IOPS under 100% random write load.
Sequential Read IOPS, IOPS under 100% sequential read load.
Sequential Write IOPS, IOPS under 100% sequential write load.
The IOPS testing benchmark tools mainly include Iometer, IoZone, FIO, etc., which can be used comprehensively to test the IOPS of the disk under different situations. For application systems, it is necessary to first determine the load characteristics of the data, then select reasonable IOPS indicators for measurement and comparative analysis, and select appropriate storage media and software systems accordingly.
理论上可以计算出磁盘的最大IOPS,即IOPS = 1000 ms/ (Tseek + Troatation),忽略数据传输时间。假设磁盘平均物理寻道时间为3ms, 磁盘转速为7200,10K,15K rpm,则磁盘IOPS理论最大值分别为,
IOPS = 1000 / (3 + 60000/7200/2) = 140
IOPS = 1000 / (3 + 60000/10000/2) = 167
IOPS = 1000 / (3 + 60000/15000/2) = 200
3. mysqlslap
3.1 Stress Test
mysqlslap is a tool that comes with MySQL for load performance testing and stress testing. It can simulate multiple clients putting pressure on the database and generate reports to understand the performance of the database.
The running process of mysqlslap is mainly divided into three steps:
① Create libraries and tables, and import data for testing. This process is done by a single thread.
② Start stress testing. This step can be done using multiple threads.
③ Clean test data. This process is done by a single thread.
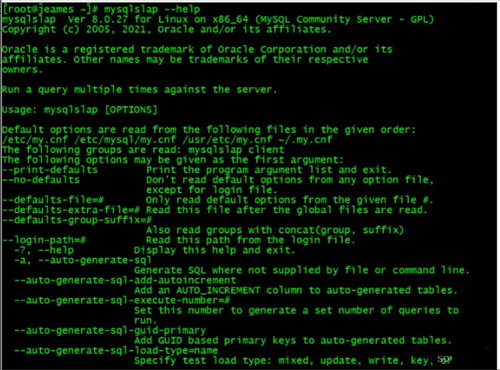
[root@jeames ~]# mysqlslap --help

3.2 Case
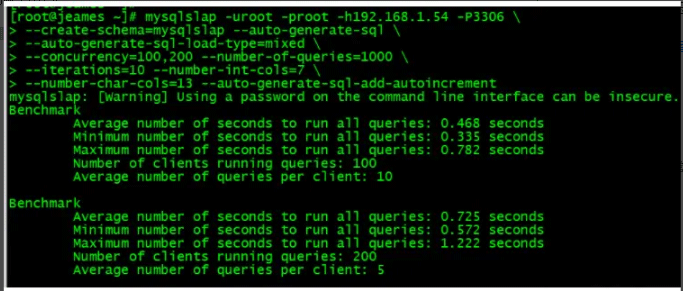
mysqlslap -uroot -proot -h292.168.1.54 -P3306 \
--create-schema=mysqlslap --auto-generate-sql \
--auto-generate-sql-load-type=mixed \
--concurrency=100,200 --number-of-queries=1000 \
--iterations=10 --number-int-cols=7 \
--number-char-cols=13 --auto-generate-sql-add-autoincrement

Benchmark
#运行所有语句的平均时间,单位秒
Average number of seconds to run all queries: 0.018 seconds
#运行所有语句的最小秒数
Minimum number of seconds to run all queries: 0.018 seconds
#运行所有语句的最大秒数
Maximum number of seconds to run all queries: 0.018 seconds
#客户端数量
Number of clients running queries: 1
#每个客户端运行查询的平均数
Average number of queries per client: 0

该语句表示测试并发为 100 和 200 的情况,进行 1000 次访问(该值一般这样预估出来:并发客户数×每客户查询次数)。这样的测试方法迭代 10 次,最终显示最大、
最小、平均值
其中:--debug-info,代表要额外输出 CPU 以及内存的相关信息。如果报错 Option 'debug-info' used, but is disabled 请取消 debug-info 参数
-number-int-cols=7 表示生成的表中必须有 7 个 int 类型的列
-number-char-cols=13 表示生成的表中必须有 13 个 char 类型的列
-concurrency 代表并发数量,多个可以用逗号隔开,concurrency=10,50,100, 并发连接线程数分别是 10、50、100 个并发。
--engines 代表要测试的引擎,可以有多个,用分隔符隔开。
--iterations 代表要运行这些测试多少次。
--auto-generate-sql 代表用系统自己生成的 SQL 脚本来测试。
--auto-generate-sql-load-type 代表要测试的是读还是写还是两者混合的(read,write,update,mixed)
--number-of-queries 代表总共要运行多少次查询。每个客户运行的查询数量可以用查询总数/并发数来计算。
--debug-info 代表要额外输出 CPU 以及内存的相关信息。
--number-int-cols :创建测试表的 int 型字段数量
--auto-generate-sql-add-autoincrement : 代表对生成的表自动添加 auto_increment 列,从 5.1.18 版本开始
--number-char-cols 创建测试表的 char 型字段数量。
--create-schema 测试的 schema,MySQL 中 schema 也就是 database。
--query 使用自定义脚本执行测试,例如可以调用自定义的一个存储过程或者 sql 语句来执行测试。
--only-print 查看语句做了什么。

The above is the detailed content of MySQL performance indicator TPS+QPS+IOPS stress test example analysis. For more information, please follow other related articles on the PHP Chinese website!

Hot AI Tools

Undresser.AI Undress
AI-powered app for creating realistic nude photos

AI Clothes Remover
Online AI tool for removing clothes from photos.

Undress AI Tool
Undress images for free

Clothoff.io
AI clothes remover

AI Hentai Generator
Generate AI Hentai for free.

Hot Article

Hot Tools

Notepad++7.3.1
Easy-to-use and free code editor

SublimeText3 Chinese version
Chinese version, very easy to use

Zend Studio 13.0.1
Powerful PHP integrated development environment

Dreamweaver CS6
Visual web development tools

SublimeText3 Mac version
God-level code editing software (SublimeText3)

Hot Topics
 1378
1378
 52
52
 MySQL: The Ease of Data Management for Beginners
Apr 09, 2025 am 12:07 AM
MySQL is suitable for beginners because it is simple to install, powerful and easy to manage data. 1. Simple installation and configuration, suitable for a variety of operating systems. 2. Support basic operations such as creating databases and tables, inserting, querying, updating and deleting data. 3. Provide advanced functions such as JOIN operations and subqueries. 4. Performance can be improved through indexing, query optimization and table partitioning. 5. Support backup, recovery and security measures to ensure data security and consistency.
 How to open phpmyadmin
Apr 10, 2025 pm 10:51 PM
You can open phpMyAdmin through the following steps: 1. Log in to the website control panel; 2. Find and click the phpMyAdmin icon; 3. Enter MySQL credentials; 4. Click "Login".
 MySQL: Simple Concepts for Easy Learning
Apr 10, 2025 am 09:29 AM
MySQL is an open source relational database management system. 1) Create database and tables: Use the CREATEDATABASE and CREATETABLE commands. 2) Basic operations: INSERT, UPDATE, DELETE and SELECT. 3) Advanced operations: JOIN, subquery and transaction processing. 4) Debugging skills: Check syntax, data type and permissions. 5) Optimization suggestions: Use indexes, avoid SELECT* and use transactions.
 How to create navicat premium
Apr 09, 2025 am 07:09 AM
Create a database using Navicat Premium: Connect to the database server and enter the connection parameters. Right-click on the server and select Create Database. Enter the name of the new database and the specified character set and collation. Connect to the new database and create the table in the Object Browser. Right-click on the table and select Insert Data to insert the data.
 MySQL and SQL: Essential Skills for Developers
Apr 10, 2025 am 09:30 AM
MySQL and SQL are essential skills for developers. 1.MySQL is an open source relational database management system, and SQL is the standard language used to manage and operate databases. 2.MySQL supports multiple storage engines through efficient data storage and retrieval functions, and SQL completes complex data operations through simple statements. 3. Examples of usage include basic queries and advanced queries, such as filtering and sorting by condition. 4. Common errors include syntax errors and performance issues, which can be optimized by checking SQL statements and using EXPLAIN commands. 5. Performance optimization techniques include using indexes, avoiding full table scanning, optimizing JOIN operations and improving code readability.
 How to create a new connection to mysql in navicat
Apr 09, 2025 am 07:21 AM
You can create a new MySQL connection in Navicat by following the steps: Open the application and select New Connection (Ctrl N). Select "MySQL" as the connection type. Enter the hostname/IP address, port, username, and password. (Optional) Configure advanced options. Save the connection and enter the connection name.
 How to recover data after SQL deletes rows
Apr 09, 2025 pm 12:21 PM
Recovering deleted rows directly from the database is usually impossible unless there is a backup or transaction rollback mechanism. Key point: Transaction rollback: Execute ROLLBACK before the transaction is committed to recover data. Backup: Regular backup of the database can be used to quickly restore data. Database snapshot: You can create a read-only copy of the database and restore the data after the data is deleted accidentally. Use DELETE statement with caution: Check the conditions carefully to avoid accidentally deleting data. Use the WHERE clause: explicitly specify the data to be deleted. Use the test environment: Test before performing a DELETE operation.
 How to execute sql in navicat
Apr 08, 2025 pm 11:42 PM
Steps to perform SQL in Navicat: Connect to the database. Create a SQL Editor window. Write SQL queries or scripts. Click the Run button to execute a query or script. View the results (if the query is executed).


