How to use Nginx Plus's online activity monitoring function
nginx plus now launches a real-time activity monitoring interface to provide key load and performance monitoring. Through the simple restful json interface, it is easy to connect real-time monitoring statistics (stats to live dashboards) and third-party monitoring tools.
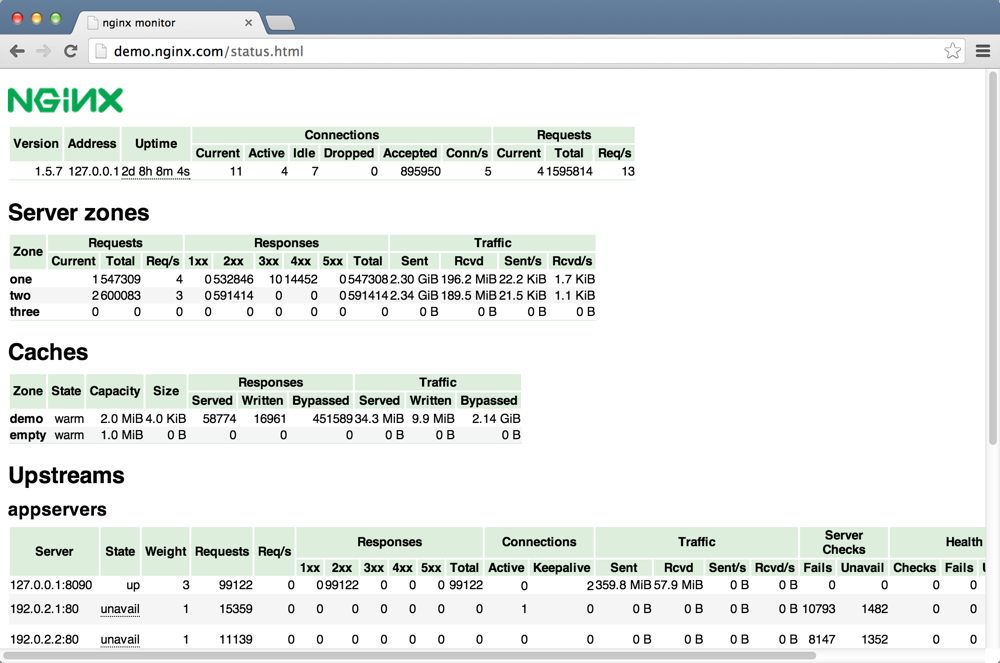
nginx plus ping
Details: Online activity monitoring – json feed
in nginx To enable this status prompt in plus, simply add status processing in the server configuration:
Copy code The code is as follows:
location = /status {
allow 192.168.0.0/16; # permit access from local network
deny all; # deny access from everywhere else
status;
}
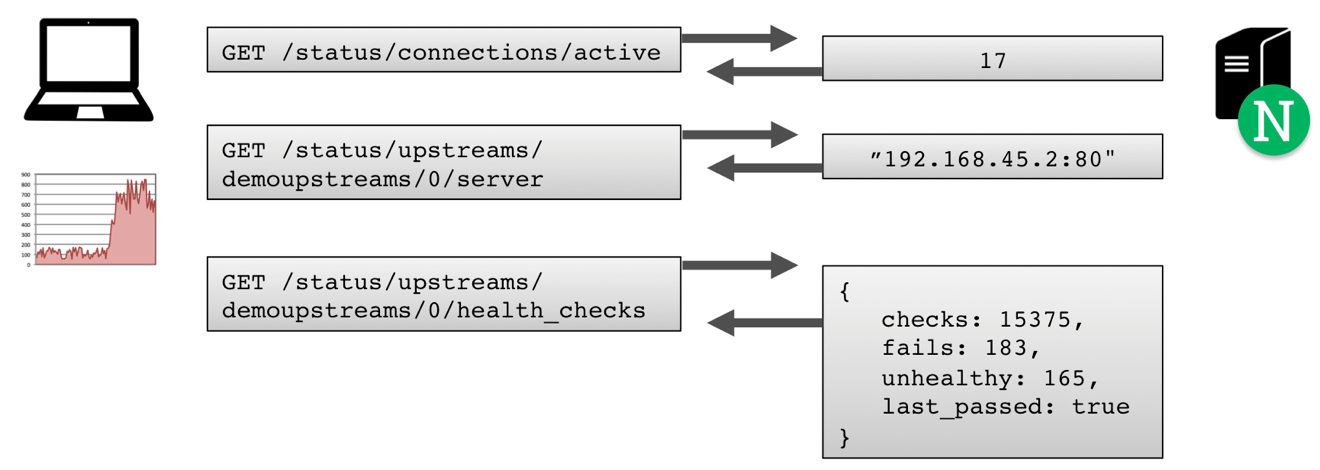
If you request /status (or any URI that matches the location group), nginx plus will respond with a json document containing the current activity data:
Basic version, startup duration, and identification information;
Total number of connections and requests;
Requests and corresponding counts for each status area;
Each upstream server Request and response technology, as well as health check and startup time statistics;
Table data of each named cache area.
You You can continue to extract subsets of data, or use the restfull method to obtain a single data point:
Details: Life Periodic monitoring – web page
nginx plus comes with a simple web page (/usr/share/nginx/html/status.html) for polling status information and displaying it in a simple table. You can use the following configuration to enable this request http://host:8080/status.html:
Copy code The code is as follows:
server {
listen 8080;
root /usr/share/nginx/html;
location = /status {
status;
}
}
The above is the detailed content of How to use Nginx Plus's online activity monitoring function. For more information, please follow other related articles on the PHP Chinese website!

Hot AI Tools

Undresser.AI Undress
AI-powered app for creating realistic nude photos

AI Clothes Remover
Online AI tool for removing clothes from photos.

Undress AI Tool
Undress images for free

Clothoff.io
AI clothes remover

Video Face Swap
Swap faces in any video effortlessly with our completely free AI face swap tool!

Hot Article

Hot Tools

Notepad++7.3.1
Easy-to-use and free code editor

SublimeText3 Chinese version
Chinese version, very easy to use

Zend Studio 13.0.1
Powerful PHP integrated development environment

Dreamweaver CS6
Visual web development tools

SublimeText3 Mac version
God-level code editing software (SublimeText3)

Hot Topics
 How to configure cloud server domain name in nginx
Apr 14, 2025 pm 12:18 PM
How to configure an Nginx domain name on a cloud server: Create an A record pointing to the public IP address of the cloud server. Add virtual host blocks in the Nginx configuration file, specifying the listening port, domain name, and website root directory. Restart Nginx to apply the changes. Access the domain name test configuration. Other notes: Install the SSL certificate to enable HTTPS, ensure that the firewall allows port 80 traffic, and wait for DNS resolution to take effect.
 How to check whether nginx is started
Apr 14, 2025 pm 01:03 PM
How to confirm whether Nginx is started: 1. Use the command line: systemctl status nginx (Linux/Unix), netstat -ano | findstr 80 (Windows); 2. Check whether port 80 is open; 3. Check the Nginx startup message in the system log; 4. Use third-party tools, such as Nagios, Zabbix, and Icinga.
 How to check the name of the docker container
Apr 15, 2025 pm 12:21 PM
You can query the Docker container name by following the steps: List all containers (docker ps). Filter the container list (using the grep command). Gets the container name (located in the "NAMES" column).
 How to check nginx version
Apr 14, 2025 am 11:57 AM
The methods that can query the Nginx version are: use the nginx -v command; view the version directive in the nginx.conf file; open the Nginx error page and view the page title.
 How to configure nginx in Windows
Apr 14, 2025 pm 12:57 PM
How to configure Nginx in Windows? Install Nginx and create a virtual host configuration. Modify the main configuration file and include the virtual host configuration. Start or reload Nginx. Test the configuration and view the website. Selectively enable SSL and configure SSL certificates. Selectively set the firewall to allow port 80 and 443 traffic.
 How to start nginx server
Apr 14, 2025 pm 12:27 PM
Starting an Nginx server requires different steps according to different operating systems: Linux/Unix system: Install the Nginx package (for example, using apt-get or yum). Use systemctl to start an Nginx service (for example, sudo systemctl start nginx). Windows system: Download and install Windows binary files. Start Nginx using the nginx.exe executable (for example, nginx.exe -c conf\nginx.conf). No matter which operating system you use, you can access the server IP
 How to create containers for docker
Apr 15, 2025 pm 12:18 PM
Create a container in Docker: 1. Pull the image: docker pull [mirror name] 2. Create a container: docker run [Options] [mirror name] [Command] 3. Start the container: docker start [Container name]
 How to start containers by docker
Apr 15, 2025 pm 12:27 PM
Docker container startup steps: Pull the container image: Run "docker pull [mirror name]". Create a container: Use "docker create [options] [mirror name] [commands and parameters]". Start the container: Execute "docker start [Container name or ID]". Check container status: Verify that the container is running with "docker ps".


